
Briefly: In our opinion speculative short positions (full) in gold, silver, and mining stocks are justified from the risk/reward perspective.
The metals and miners paused yesterday, but it doesn’t mean that all that was likely to happen, has already happened. No market can move in a straight line, be that up or down, and yesterday’s pause doesn’t have any implications at this time. Let’s take a closer look (charts courtesy of http://stockcharts.com.)
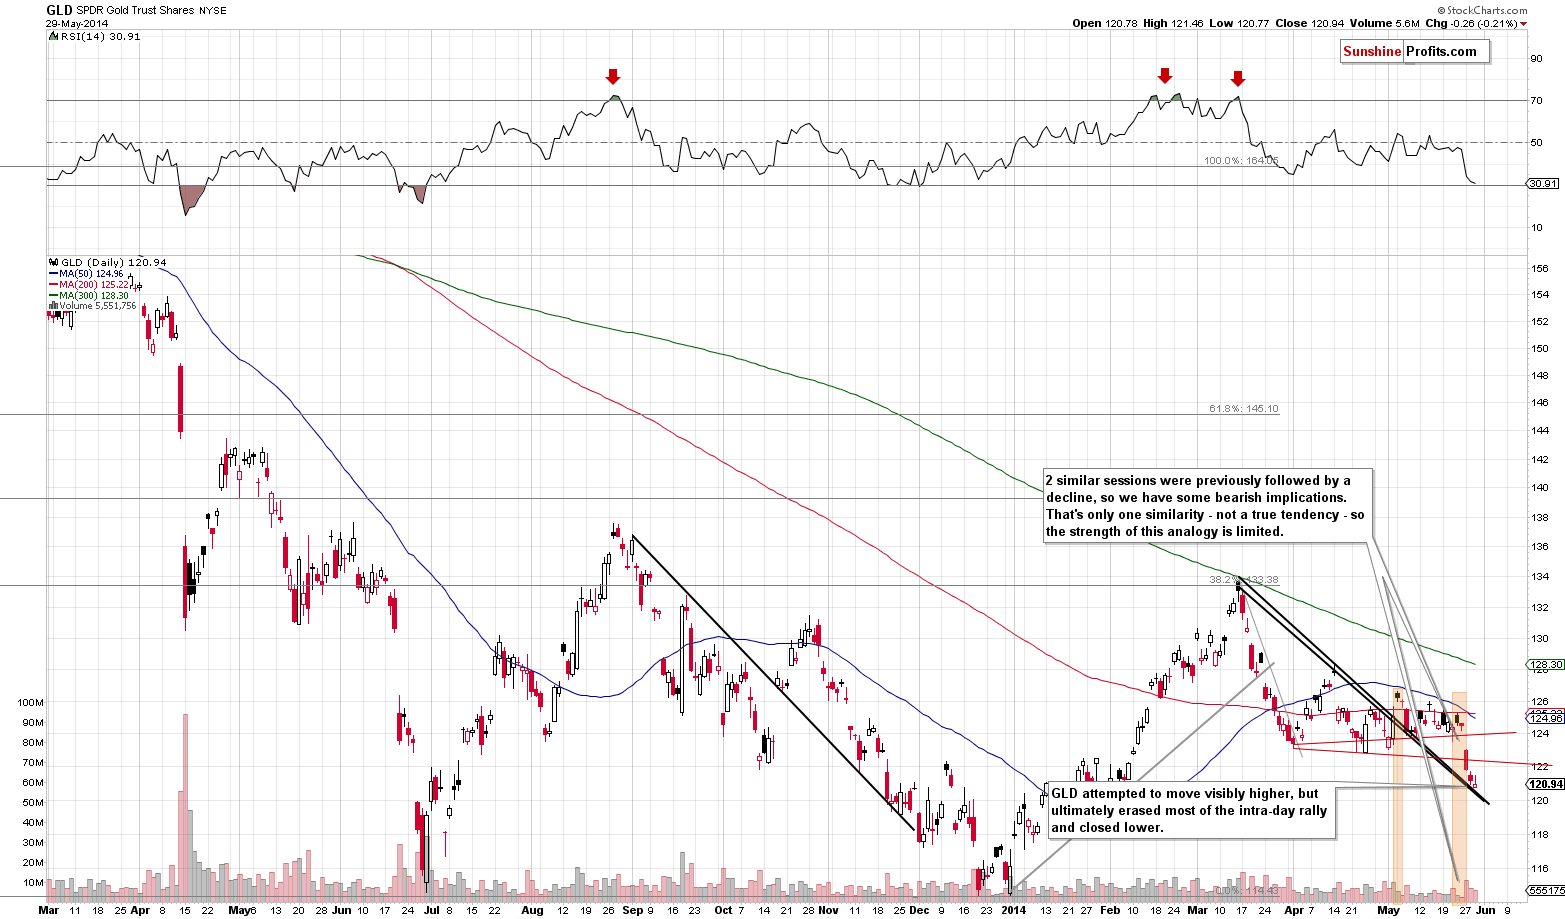
The GLD ETF paused yesterday, but nothing more than that – we simply saw an intra-day move higher after which GLD declined and ended the session below the previous close. We could see a pause here, but it’s not that certain. Overall, the surest thing that we can state is that we saw a breakdown and that the medium-term trend remains down – what happens in the very short-term – next few days – is a bit unclear.
The bearish factors pointed out yesterday remain up-to-date:
We saw a breakdown. Perhaps it will be called “the breakdown” in a few weeks when we will be looking back at this move. The reason that makes it so significant is the combination of several factors:
- Gold is still in a medium-term downtrend, which means that bigger moves to the downside are to be expected – this by itself makes yesterday’s move more believable
- Gold was in a consolidation since the beginning of April, so a breakout or breakdown from this pattern is quite significant (because the consolidation was rather significant as well)
- The move that preceded the consolidation was down (the decline in the second half of March), which means that the move following it, was also likely to be down (thus making the breakdown more believable)
- The breakdown itself took place on huge volume, which confirms the move
- GLD didn’t correct before the end of the session, thus creating a bearish candlestick pattern. In other words, it seems that GLD didn’t stop declining because it showed some strength – it only stopped declining because the session ended and it couldn’t decline more
- The breakdown was actually 2 breakdowns – below support lines created by daily lows and daily closing prices.
As you can see, there are quite a few reasons to think that yesterday’s move is indeed a bearish phenomenon, not a fake move. In fact, we think that the above combination of factors make the breakdown verified even without waiting for 2 more closes below the support/resistance lines that were just broken.
What we wrote about gold in the previous alert remains up-to-date:
We wrote that the strength that we could see here would likely be temporary. It turned out that the rally that this reversal generated was indeed very small and temporary. We saw another lower intra-day high in gold, and the move higher materialized on low volume. We’re once again seeing this bearish combination. If the USD Index confirms its breakout, gold might finally break below the short-term support.
How far can it go initially? Our best guess at this particular moment (this might change as the situation develops) is the $1,200 level or close to it. One of the ways to estimate the size of a given move is to assume that the move following the consolidation (which we’ve been seeing since the beginning of April) will be similar to the one preceding it. In this case, the move following the breakdown could be similar to the March decline, and such a move would take gold close to the $1,200 level. This level is very close to the 2013 lows, so we expect gold to pause there (but not to end the decline).
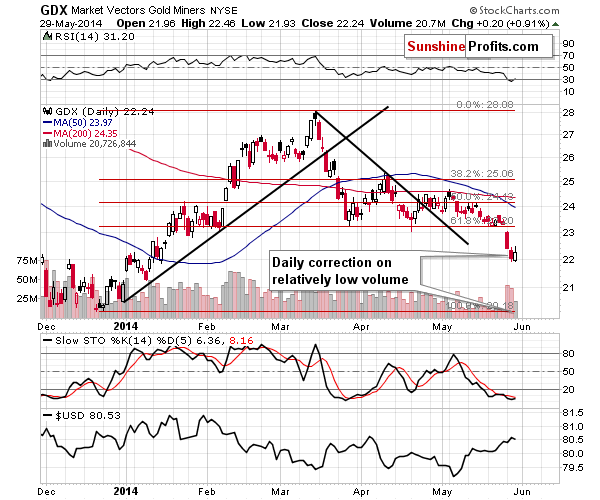
Thursday’s move up was rather small and materialized on relatively low volume. It looks like a pause – it could be followed by further small rallies or not – but doesn’t have to be one.
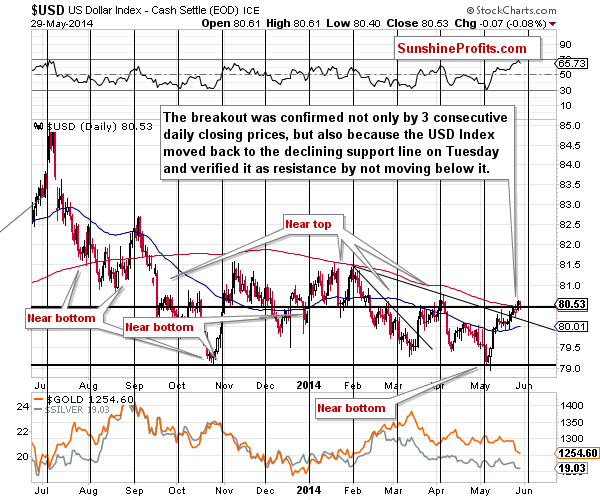
The USD Index paused but didn’t move below the 200-day moving average. It seems that the amount of people that are convinced about the dollar’s strength is growing.
Please note that while the USD Index is close to its April high, gold and silver are well below the levels that they were trading at at the beginning of April. Consequently, speaking of the metals’ outperformance relative to the USD Index is not appropriate – their reaction to the dollar’s rally was only delayed.
It was right before the decline in metals that we wrote the following:
The U.S. dollar moved higher once again and almost confirmed the breakout above the declining resistance line. Precious metals are not reacting yet. Unless metals start to react to the dollar’s strength (by declining) we will view this as a sign of their strength. For now we still think that the reaction is delayed – not really absent.
Please note that based on the proximity of the cyclical turning point, we could see another pullback to the support/resistance line that was just broken in a few days, but it doesn’t seem to be really concerning – it’s not likely to be anything more than just that – a pullback. Once it’s over (or we’re sure that it hasn’t happened) we will likely adjust the stop-loss orders for our positions in the precious metals sector.
There’s one more chart that we would comment on today, before summarizing – the one featuring gold to oil ratio.
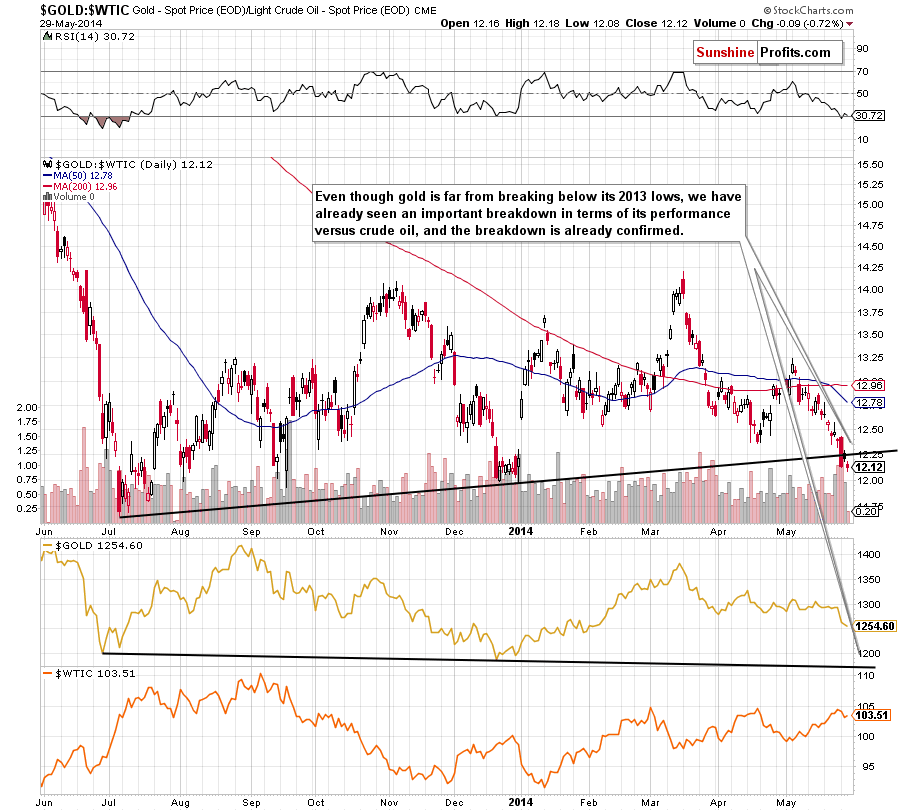
We have not only saw a breakdown below the rising medium-term support line in the gold:oil ratio, but it was also confirmed. The implications are clearly bearish. I (PR) was discussing this chart with Nadia regarding the possible implications for the crude oil market, but they were less clear than the implications for the gold market. Simply put, the breakdown below the key medium-term support line was already seen in case of the ratio. This indicates that an analogous breakdown (which means breaking below the previous lows) in gold will be seen as well. Of course, the implications are bearish.
Summing up, the situation in the precious metals market deteriorated once again – not only in terms of what has already happened (this week’s declines), but also in terms of the outlook.
To summarize:
Trading capital (our opinion): Short positions (full) in: gold, silver, and mining stocks with the following stop-loss orders:
- Gold: $1,326
- Silver: $20.30
- GDX ETF: $25.20
Long-term capital: No positions.
Insurance capital: Full position.
Please note that a full speculative position doesn’t mean using all of the speculative capital for this trade. You will find details on our thoughts on gold portfolio structuring in the Key Insights section on our website.
As always, we'll keep you - our subscribers - updated should our views on the market change. We will continue to send out Gold & Silver Trading Alerts on each trading day and we will send additional Alerts whenever appropriate.
The trading position presented above is the netted version of positions based on subjective signals (opinion) from your Editor, and the automated tools (SP Indicators and the upcoming self-similarity-based tool).
As a reminder, Gold & Silver Trading Alerts are posted before or on each trading day (we usually post them before the opening bell, but we don't promise doing that each day). If there's anything urgent, we will send you an additional small alert before posting the main one.
Thank you.
Sincerely,
Przemyslaw Radomski, CFA
Founder, Editor-in-chief
Gold & Silver Trading Alerts
Forex Trading Alerts
Oil Investment Updates
Oil Trading Alerts

