

Briefly: In our opinion, full (150% of the regular full position) speculative short positions in gold, silver and mining stocks are justified from the risk/reward perspective at the moment of publishing this alert.
In yesterday’s alert we wrote that the reversal in the precious metals market should once again not be taken at its face value and that one should not overreact based on it as the size of the potential rally was limited. Well, it turned out that “limited rally” was an euphemism for a decline. Gold, silver and mining stocks declined once again despite the previous day’s reversal and gold stocks confirmed the breakdown below the key support line. The implications are strongly bearish. However, there’s something ever more bearish and much more profound.
Let’s recall the situation in silver. A few weeks ago we wrote about silver’s move to the key resistance line and the huge importance of the invalidation of the breakdown below the line based on the weekly closing prices. Silver is now significantly below the resistance line, but the key question is if the decline is already over. Well, it seems that it’s far from being over and the analogy that we are going to discuss shows just how far it could be from being over.
History repeats itself – maybe not to the letter, but more or less – that’s the key principle of technical analysis. This principle is usually utilized by using chart patterns, but it goes beyond this – to self-similarity and fractal analysis. Long story short, if one manages to find a pattern that is a good reflection of a pattern from the past (either direct or on a proportional basis) then they could profit on the pattern’s continuation.
Based on the above paragraph and the title of this article, you may already suspect that there is a very important self-similar pattern in silver. Let’s take a closer look (charts courtesy of http://stockcharts.com).
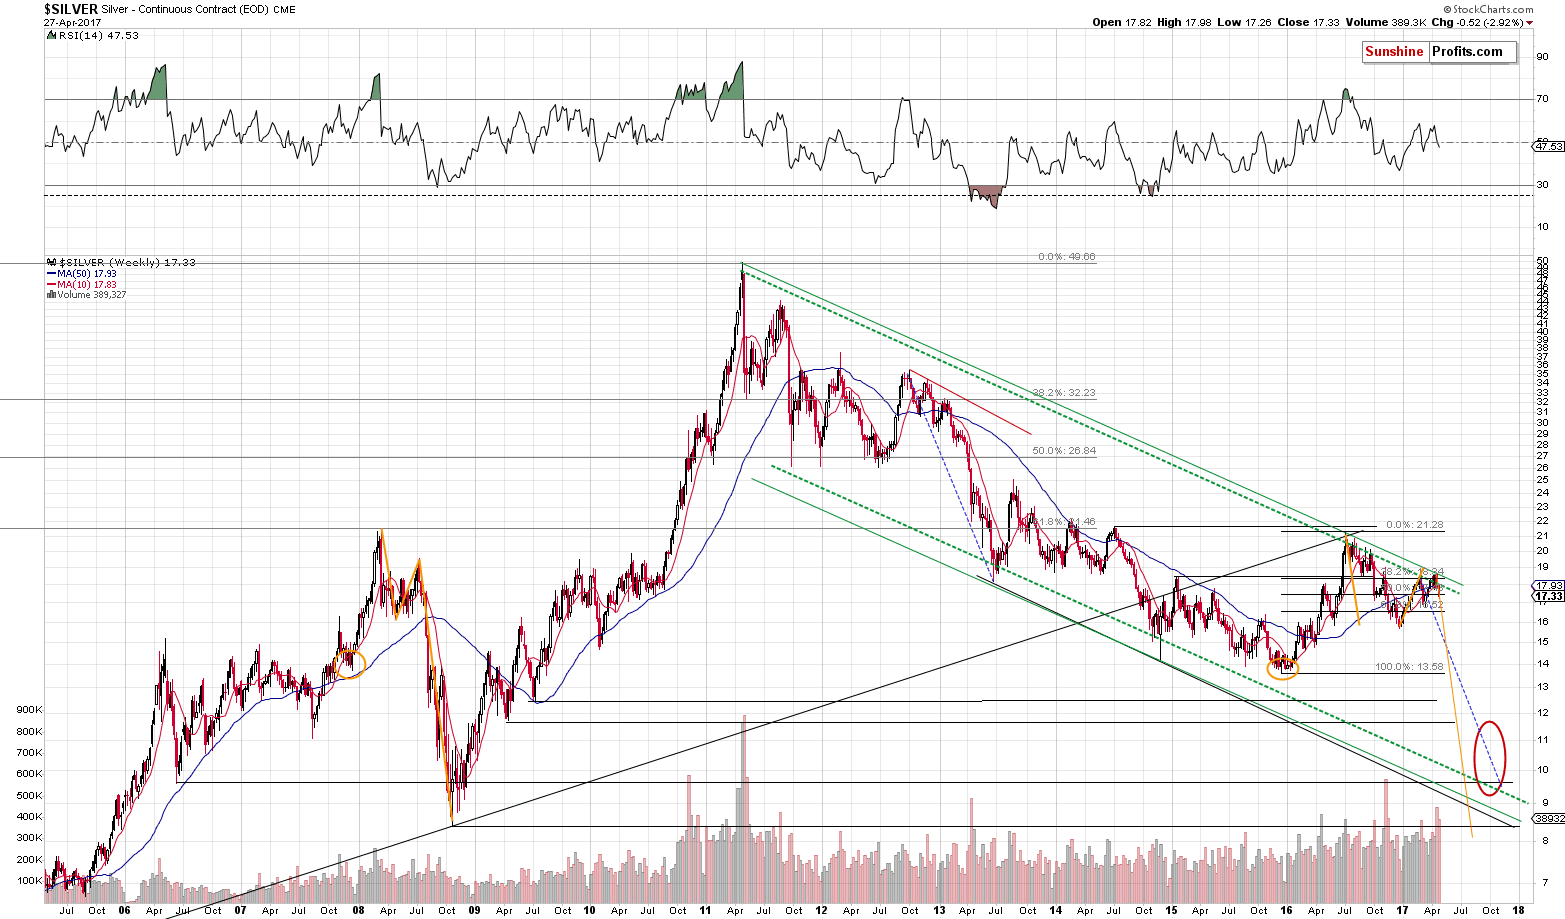
Please focus on the parts of the chart that we marked with orange (in 2016-2017 and in 2007-2008). At first sight there’s nothing similar between what had happened in late 2007 and the first half of 2008 and what’s been taking place since December 2015. However, the more one starts to compare them, the more amazing it becomes.
First, let’s discuss the price moves.
Silver’s early 2008 rally started a bit below the $14 level and took place until the white metal moved above $21 (below $22, though). Then silver declined about $5.50 and then it rallied (which turned out to be its final rally before the big plunge) about $3.
Silver’s early 2016 rally started a bit below the $14 level and took place until the white metal moved above $21 (below $22, though). Then silver declined about $5.50 and then it rallied (which turned out to be its final rally before the big plunge) about $3.
That’s right, the price swings are almost identical not only in relative terms, but also in terms of the (almost) exact prices. What does the above suggest? That silver is likely to decline below $9. Yes, that’s quite extreme, so let’s “conservatively” say that it’s likely to decline to or below $10.
“C’mon that’s only the price analogy – what about time?” one could ask, and they would be correct. At least initially, because it is the price analogy that makes the above even more remarkable. The analogy in terms of time is proportional instead of being exact, but it’s still present and so are the implications.
The time between silver’s bottom in late 2007 and the 2008 top is more or less the same as the time between the 2008 top and the July 2008 top, which is also more or less the same as the time between the July 2008 top and the 2008 bottom.
The time between silver’s bottom in late 2015 and the 2016 top is more or less the same as the time between the 2016 top and the 2017 top, which… Is likely to be more or less the same as the time between the 2017 top and the (upcoming) 2017 bottom.
The existence of the above analogy not only confirms that the price analogy that we discussed earlier is valid, but it also points to early November as the (more or less) time target for the final bottom in silver. Interestingly, the above is in perfect tune with the red target ellipse that we drew based on other factors (long-term support levels and the similarity to the 2012 – 2013 decline). The above makes this price / time target combination even more reliable.
Still, is the above imminent? Does silver have to slide to or below $10? Of course not – the world changes and we should take every silver and gold price prediction with a healthy dose of skepticism and review the estimations when new developments emerge. The above does, however, make a very strong case for much lower silver prices in the coming months, as it confirms multiple signals coming from other parts of the precious metals sector and other markets.
For now, it appears that we are still in the “pennies to the upside, dollars to the downside” territory and short positions seem to be well justified from the risk to reward point of view.
As always, we will keep you – our subscribers – informed.
To summarize:
Trading capital (supplementary part of the portfolio; our opinion): Short positions (150% of the full position) in gold, silver and mining stocks are justified from the risk/reward perspective with the following stop-loss orders and initial target price levels / profit-take orders:
- Gold: exit-profit-take level: $1,063; stop-loss: $1,317; initial target price for the DGLD ETN: $81.88; stop-loss for the DGLD ETN $44.57
- Silver: initial target price: $13.12; stop-loss: $19.22; initial target price for the DSLV ETN: $46.18; stop-loss for the DSLV ETN $17.93
- Mining stocks (price levels for the GDX ETF): initial target price: $9.34; stop-loss: $26.34; initial target price for the DUST ETF: $143.56; stop-loss for the DUST ETF $21.37
In case one wants to bet on junior mining stocks' prices (we do not suggest doing so – we think senior mining stocks are more predictable in the case of short-term trades – if one wants to do it anyway, we provide the details), here are the stop-loss details and initial target prices:
- GDXJ ETF: initial target price: $14.13; stop-loss: $45.31
- JDST ETF: initial target price: $104.26; stop-loss: $10.78
Long-term capital (core part of the portfolio; our opinion): No positions (in other words: cash)
Insurance capital (core part of the portfolio; our opinion): Full position
Please note that the in the trading section we describe the situation for the day that the alert is posted. In other words, it we are writing about a speculative position, it means that it is up-to-date on the day it was posted. We are also featuring the initial target prices, so that you can decide whether keeping a position on a given day is something that is in tune with your approach (some moves are too small for medium-term traders and some might appear too big for day-traders).
Plus, you might want to read why our stop-loss orders are usually relatively far from the current price.
Please note that a full position doesn’t mean using all of the capital for a given trade. You will find details on our thoughts on gold portfolio structuring in the Key Insights section on our website.
As a reminder – “initial target price” means exactly that – an “initial” one, it’s not a price level at which we suggest closing positions. If this becomes the case (like it did in the previous trade) we will refer to these levels as levels of exit orders (exactly as we’ve done previously). Stop-loss levels, however, are naturally not “initial”, but something that, in our opinion, might be entered as an order.
Since it is impossible to synchronize target prices and stop-loss levels for all the ETFs and ETNs with the main markets that we provide these levels for (gold, silver and mining stocks – the GDX ETF), the stop-loss levels and target prices for other ETNs and ETF (among other: UGLD, DGLD, USLV, DSLV, NUGT, DUST, JNUG, JDST) are provided as supplementary, and not as “final”. This means that if a stop-loss or a target level is reached for any of the “additional instruments” (DGLD for instance), but not for the “main instrument” (gold in this case), we will view positions in both gold and DGLD as still open and the stop-loss for DGLD would have to be moved lower. On the other hand, if gold moves to a stop-loss level but DGLD doesn’t, then we will view both positions (in gold and DGLD) as closed. In other words, since it’s not possible to be 100% certain that each related instrument moves to a given level when the underlying instrument does, we can’t provide levels that would be binding. The levels that we do provide are our best estimate of the levels that will correspond to the levels in the underlying assets, but it will be the underlying assets that one will need to focus on regarding the signs pointing to closing a given position or keeping it open. We might adjust the levels in the “additional instruments” without adjusting the levels in the “main instruments”, which will simply mean that we have improved our estimation of these levels, not that we changed our outlook on the markets. We are already working on a tool that would update these levels on a daily basis for the most popular ETFs, ETNs and individual mining stocks.
Our preferred ways to invest in and to trade gold along with the reasoning can be found in the how to buy gold section. Additionally, our preferred ETFs and ETNs can be found in our Gold & Silver ETF Ranking.
As always, we'll keep you - our subscribers - updated should our views on the market change. We will continue to send out Gold & Silver Trading Alerts on each trading day and we will send additional Alerts whenever appropriate.
The trading position presented above is the netted version of positions based on subjective signals (opinion) from your Editor, and the Tools and Indicators.
As a reminder, Gold & Silver Trading Alerts are posted before or on each trading day (we usually post them before the opening bell, but we don't promise doing that each day). If there's anything urgent, we will send you an additional small alert before posting the main one.
=====
Latest Free Trading Alerts:
On Wednesday, the White House unveiled Trump’s tax reform plan. What does it mean for the gold market?
Just three months after the hike in December, the Fed moved interest rates up again. Although higher interest rates are believed to be negative for gold prices, the price of gold jumped after the hike. Why did gold behave like in response to the U.S. central bank’s move? We invite you to read our today’s article about the Fed’s third hike and find out how it could affect the gold market.
=====
Hand-picked precious-metals-related links:
PRECIOUS-Gold set for worst week in seven as investors opt for riskier assets
CHART: Behavioural finance points to $1,050 gold price
This app will let Indians buy and sell gold on their smartphones
The 5 Top-Producing Gold Mines in the World
=====
In other news:
U.S. first-quarter growth weakest in three years as consumer spending falters
World stocks pause near record highs
Trump’s Tax Plan Hits Its First Land Mine: Blue-State Republicans
Euro zone inflation near 4-year high, adds to pressure on ECB
Congress Readies Votes Friday to Avert Government Shutdown
=====
Thank you.
Sincerely,
Przemyslaw Radomski, CFA
Founder, Editor-in-chief, Gold & Silver Fund Manager
Gold & Silver Trading Alerts
Forex Trading Alerts
Oil Investment Updates
Oil Trading Alerts

