
In short: In our opinion, small (half) short positions in gold, silver, and mining stocks are still justified (no changes since Friday).
Gold rallied on Friday and so did the rest of the precious metals sector. It seems to be a bullish fact at the first sight (and to some extent is), but taking a closer look reveals that actually all that we saw was a move close to the previous local high without a critical breakout.
The most important observation for one to make here is that gold didn’t move above the rising long-term resistance line. Please take a look below (charts courtesy of http://stockcharts.com.)
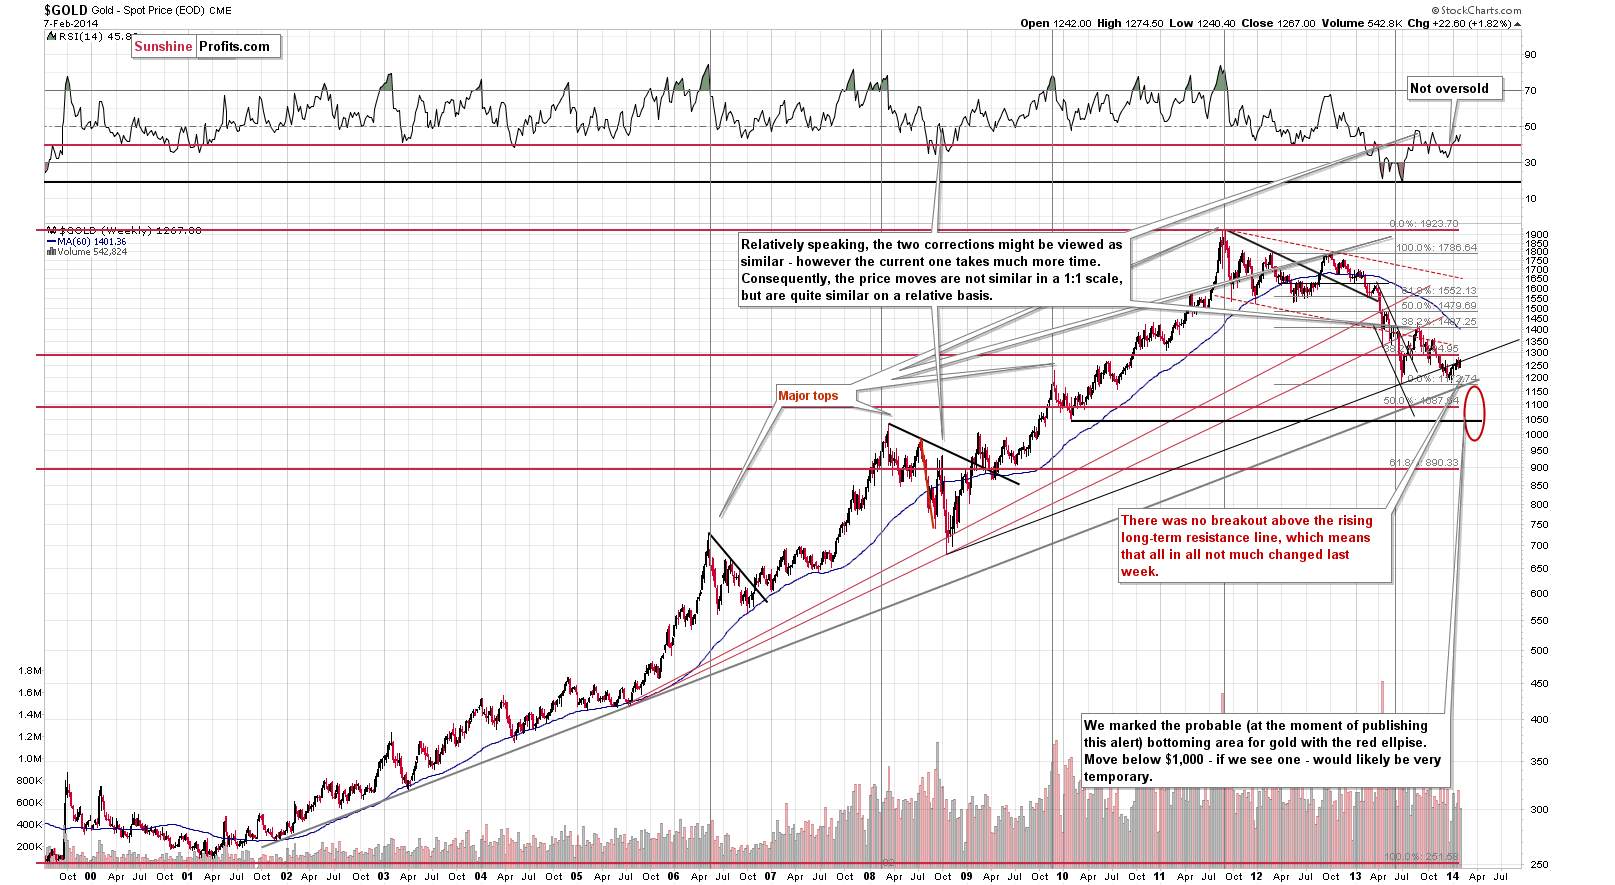
Friday’s move higher was very small from the long-term perspective, in fact, barely visible. As mentioned above, it didn’t take gold above the long-term resistance, which means that it didn’t change the medium-term outlook.
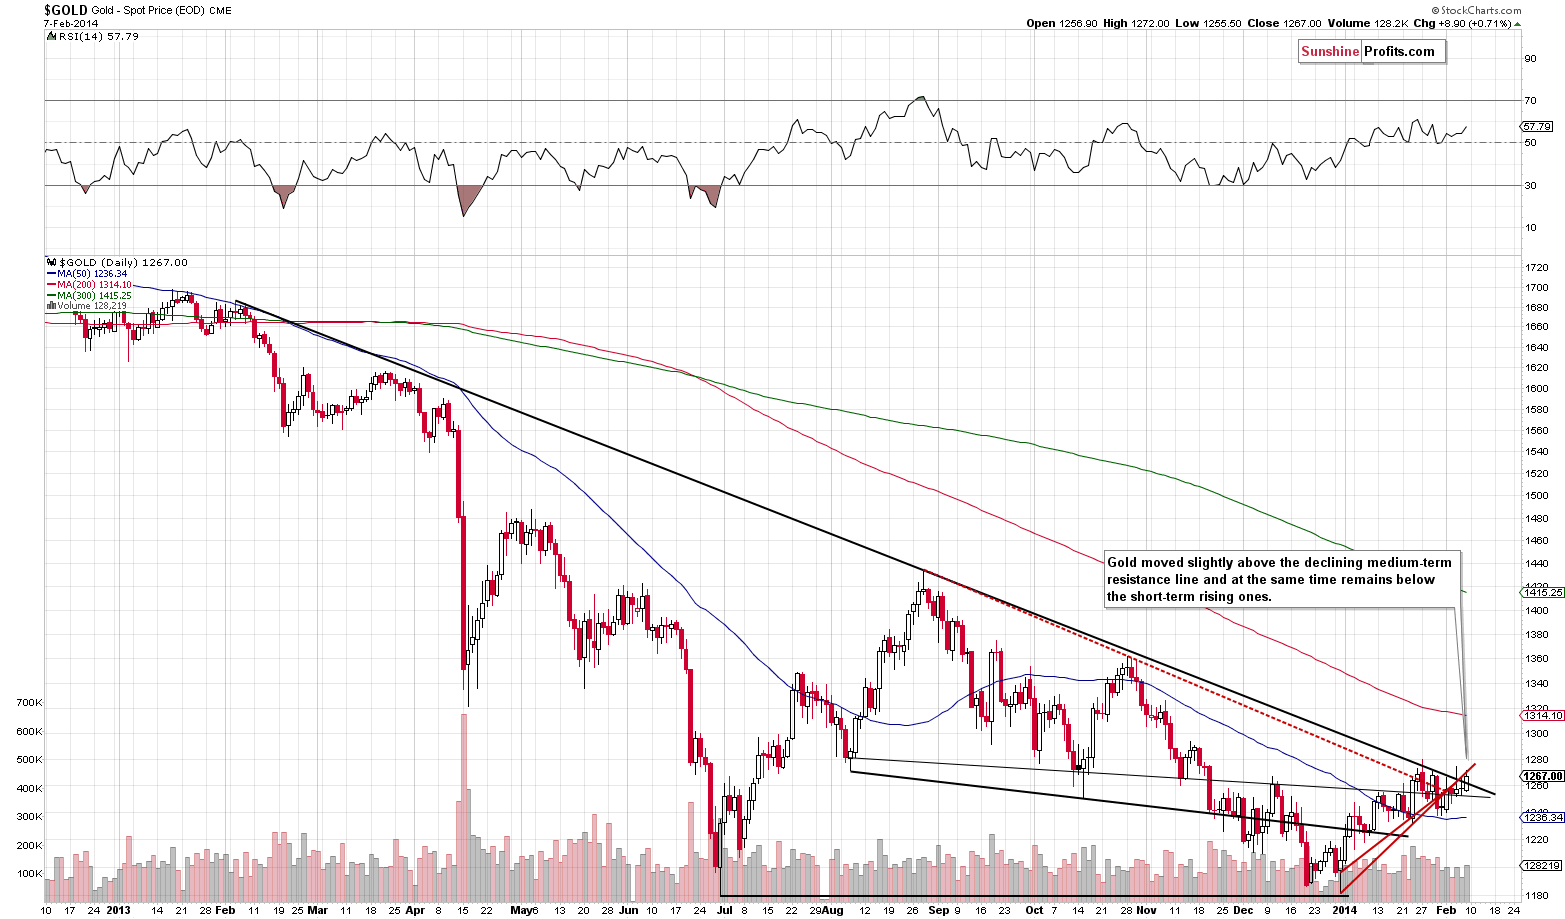
From the short-term perspective, we saw one change – there was a small breakout above the declining medium-term resistance line. How important it is? On its own, it’s somewhat important, because the resistance line is important, but at the same time it was not significant and we saw just one daily close above it. The long-term rising resistance line that was not broken, which is more important (as it’s based on a wider time frame). A small breakout from the medium-term perspective and no breakout from the long-term perspective together mean that not much changed.
There was no breakout back above the rising short-term support/resistance lines and the breakdown below them was confirmed.
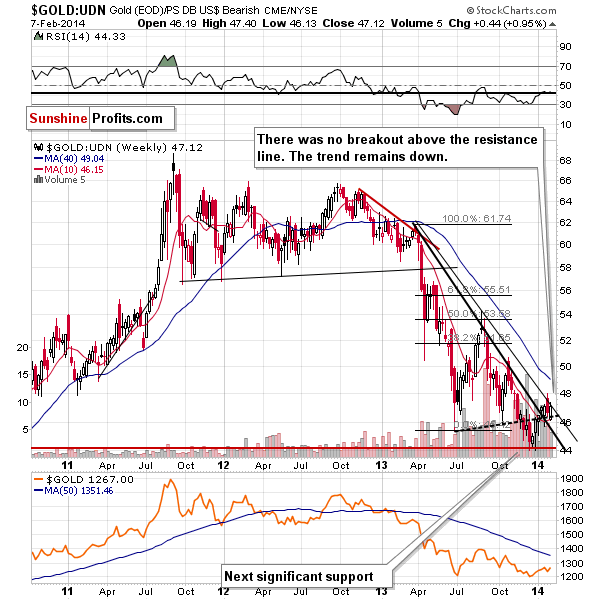
From the non-USD perspective, there was no breakout either. Gold moved to the declining resistance line, but didn’t rally above it. Without a breakout, the bearish trend remains in place.
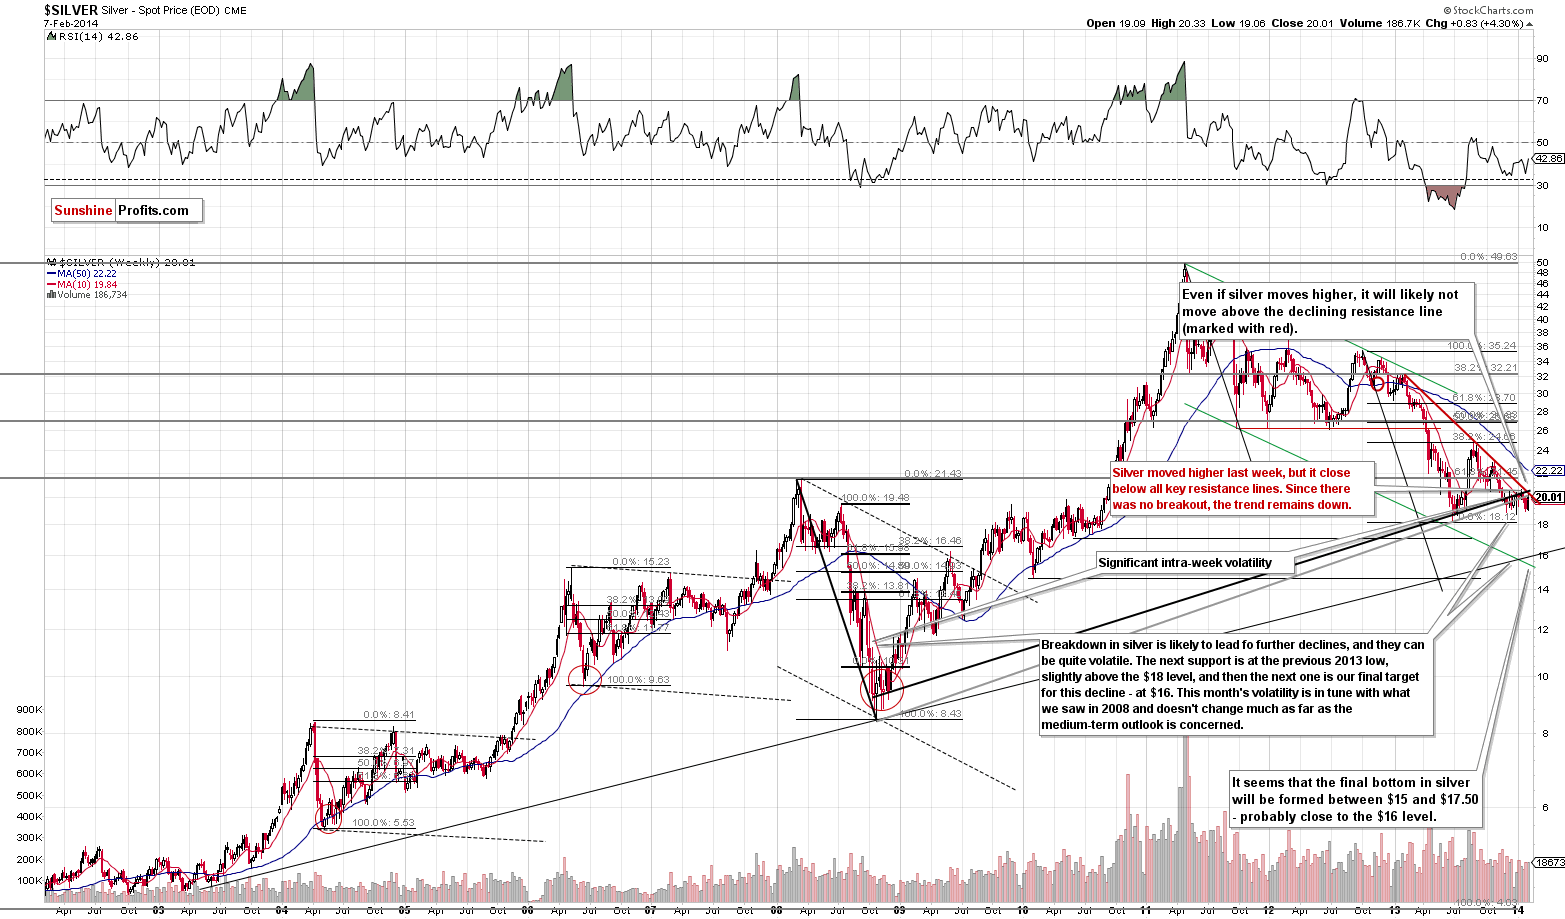
Silver moved higher as well, but no previous breakdown was invalidated. Therefore, the rally itself doesn’t have any consequences and the trend remains down.
Having said that, let’s take a look at the mining stocks sector.
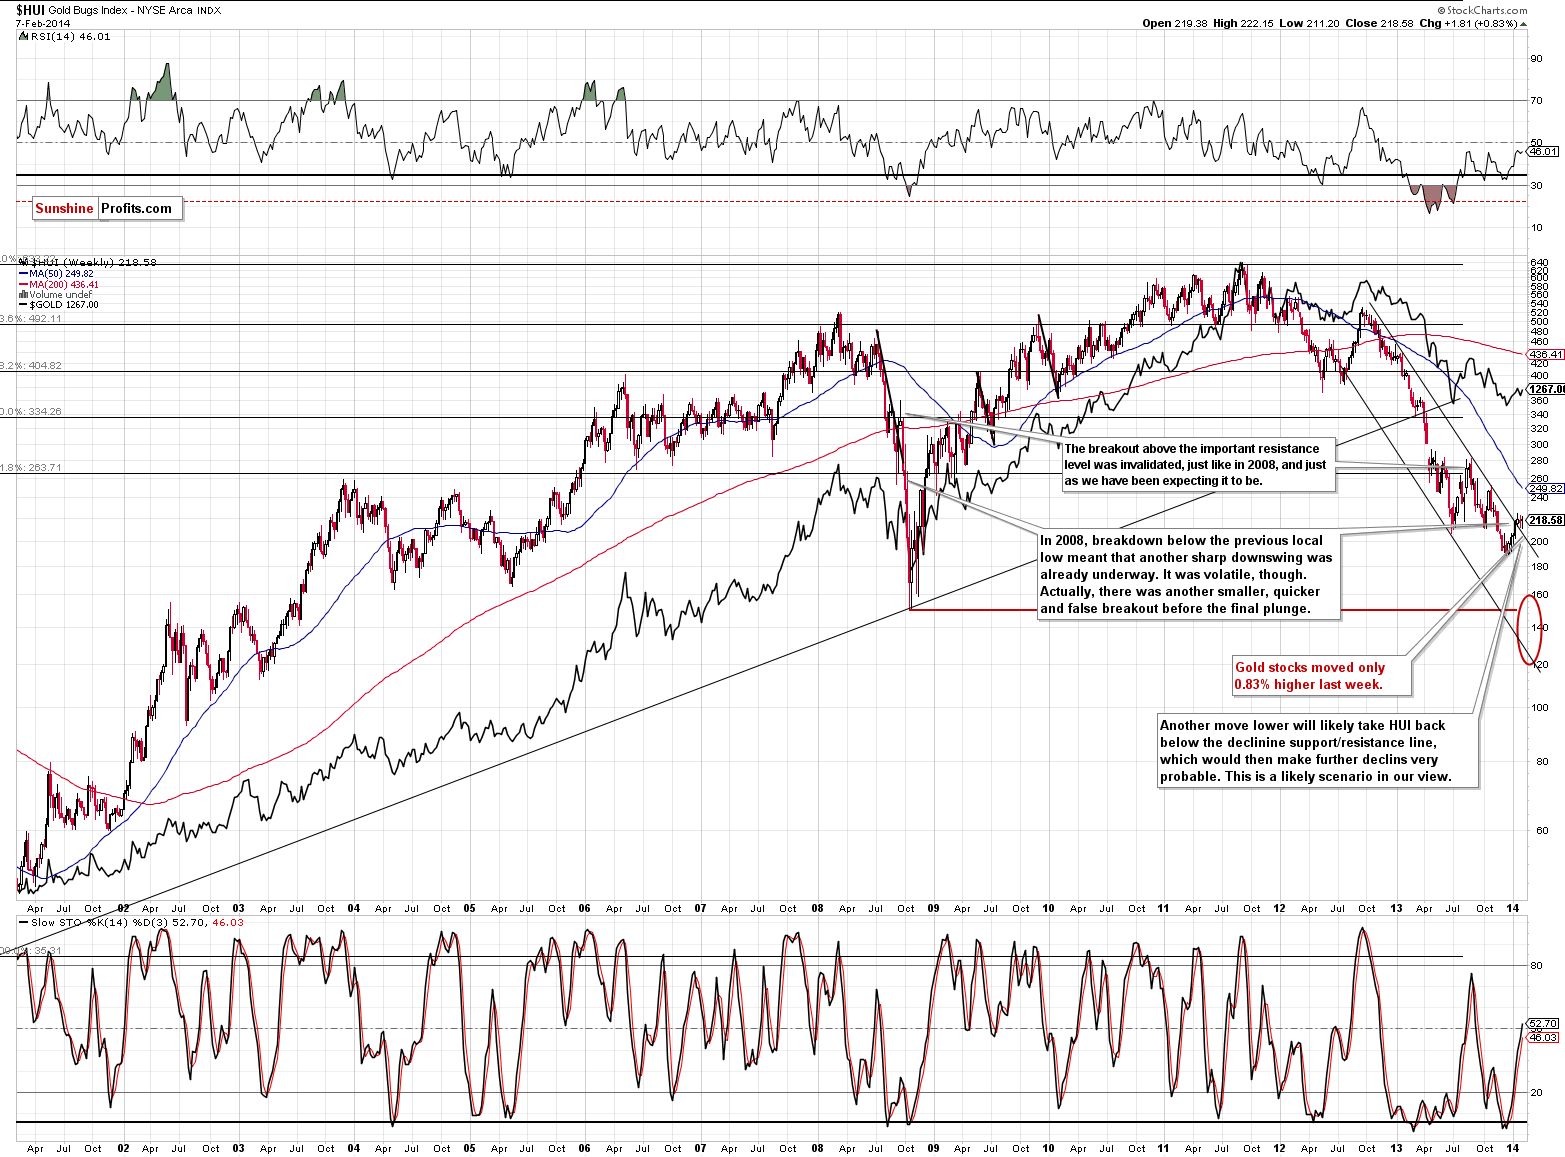
The first thing that we would like to stress is that the HUI Index – a proxy for gold stocks – moved higher by only 0.83% whereas gold moved 1.82% higher. The mining stocks underperformed gold, which is a bearish short-term sign.
Other than that, we would like to re-emphasize what we’ve been writing for some time regarding the miners’ breakout:
The current breakout is small and it’s questionable whether it has been confirmed or not. It was confirmed by 3 daily closes above the declining resistance line, but in terms of price, there has been no significant upswing. This, plus silver’s underperformance and the lack of a breakout in gold makes us want to re-examine the breakout in the HUI Index.
As we wrote previously, the current move higher is similar to what we saw in 2008 right before the final plunge of the entire precious metals sector. There was one more significant correction (like what we saw in July – October 2013) and now we see a small, barely visible one. If they history repeats or at least rhymes, then not only is the current move higher not bullish, but bearish and was to be expected to some extent.
Naturally, one analogy doesn’t entirely invalidate the bullish implication of a breakout, but it does make it much weaker. Consequently, we don’t think that one should view the gold stocks' breakout as very important.
Let’s examine how miners fared relative to gold.
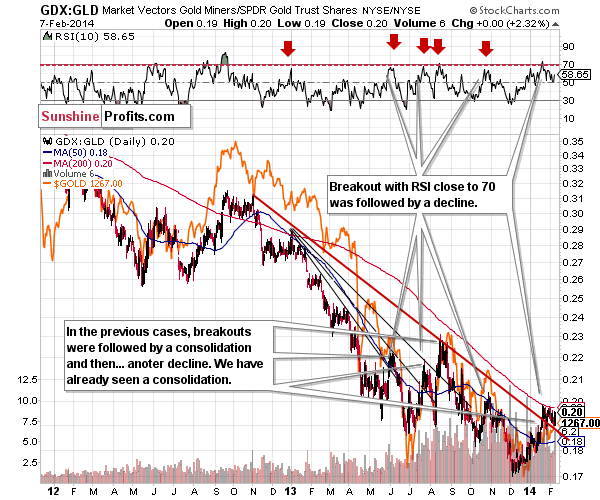
They were strong relative to gold on Friday, but overall they have been trading sideways for a few weeks now. This (consolidation after a breakout) would normally be a bullish fact, if it wasn’t for the fact that 3 out of 3 times when we previously saw such a pattern, a decline followed. Consequently, we don’t see the above as a bullish sign.
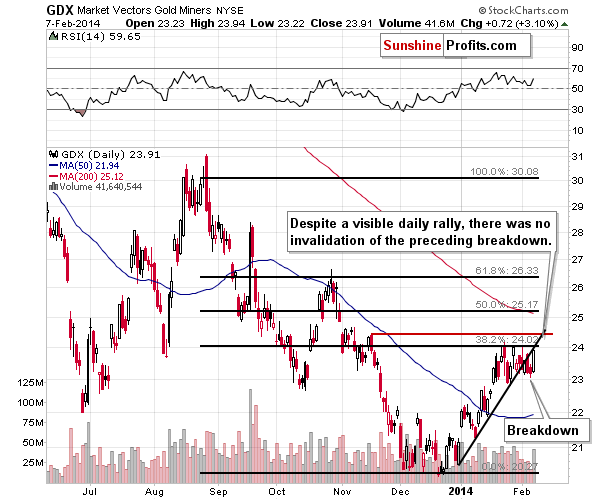
Moving back to mining stocks themselves, let’s take a look at the short-term picture.
Friday’s rally was quite significant on a daily basis, but it didn’t manage to take the GDX ETF back above the rising resistance line. Consequently, the breakdown was confirmed and the implications are bearish for the coming weeks. We could see some temporary strength, though, based on the relatively high volume that accompanied Friday’s rally.
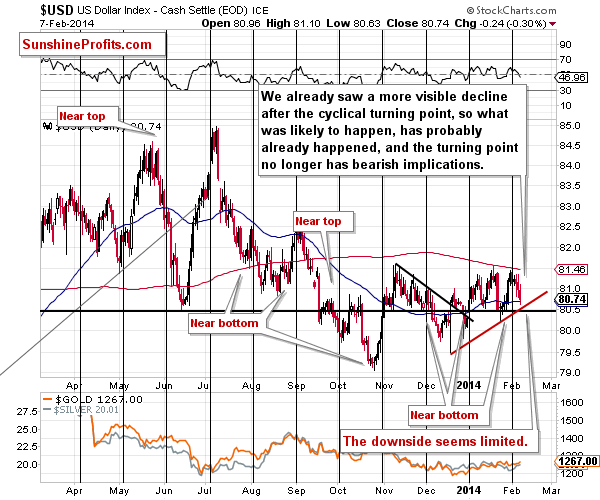
The USD Index declined on Friday, which was the likely reason for the upswing in the metals and miners. The thing that we would like to stress here is that the support line is very close to where USD Index closed on Friday, which means that the downside seems very limited.
Actually, this is what Nadia Simmons wrote in Thursday’s Forex Trading Alert:
(…) it seems that the EUR/USD pair will move higher, up to the declining blue resistance line, but this move seems too small for us to open a long position (however, it is something that day-traders might want to consider taking advantage of). We plan to position ourselves according to the trend channel (blue lines) - probably by opening a long position after the rally stops and confirms that it's once again about to decline more significantly.
Basically, this resistance line is the counterpart of the rising red support line on the above USD Index chart. We agree that while the move lower in the USD Index and higher in the EUR/USD pair has indeed materialized, it doesn’t seem to be a beginning of a greater move, but a small, counter-trend one.
Therefore, the USD Index is likely to rally quite soon, which will quite likely put negative pressure on the precious metals market.
Summing up, taking all of the above into account, we arrive at the same conclusion at which we arrived previously – namely, in our opinion it’s a good idea to use a small part of the speculative capital to trade the (likely) coming decline in precious metals. If we see a meaningful confirmation of the bearish case (for instance, a decline on strong volume or a breakdown in the HUI Index), we will likely think that increasing the size of the short position might be a good idea. Naturally, in case of an invalidation of the bearish outlook, we will keep you informed as well.
To summarize:
Trading capital: In our opinion a short position (half) in gold, silver and mining stocks is justified from the risk/reward point of view. We are planning to profit on a significant downswing, so the stop-loss orders that are appropriate in our opinion are not that close (however, if something invalidates the bearish outlook, we will let you know ASAP, even if stop-loss orders are not reached).
Stop-loss orders for the short position:
- Gold: $1,307
- Silver: $21.20
- GDX ETF: $27.20
Long-term capital: No positions.
As always, we'll keep you - our subscribers - updated should our views on the market change. We will continue to send out Gold & Silver Trading Alerts on each trading day and we will send additional Alerts whenever appropriate.
The trading position presented above is the netted version of positions based on subjective signals from your Editor, and the automated tools (SP Indicators and the upcoming self-similarity-based tool).
As a reminder, Gold & Silver Trading Alerts are posted before or on each trading day (we usually post them before the opening bell, but we don't promise doing that each day). If there's anything urgent, we will send you an additional small alert before posting the main one.
Thank you.
Sincerely,
Przemyslaw Radomski, CFA

