

Briefly: In our opinion speculative short positions (full) are currently justified from the risk/reward perspective.
Gold rallied on Friday by approximately as much as it had declined on Thursday and the same goes for mining stocks. Silver moved only a little higher. Is the decline over?
Not likely. The situation didn’t actually improve significantly. Let’s see why (charts courtesy of http://stockcharts.com).
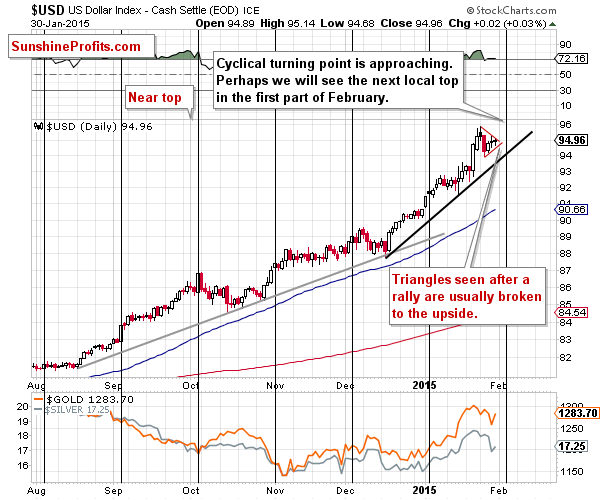
The USD Index has not reached its long-term resistance just yet (96.2), so the odds are that it will rally further (even if not right away), negatively influencing the precious metals prices.
It seems that the USD Index formed a short-term triangle pattern, which is usually followed by a continuation of the previous move, especially when this move was a rally.
In the past weeks gold and the USD have moved higher together, but taking the last week into account makes us view the likely move higher in the USD as a bearish factor for the precious metals market.
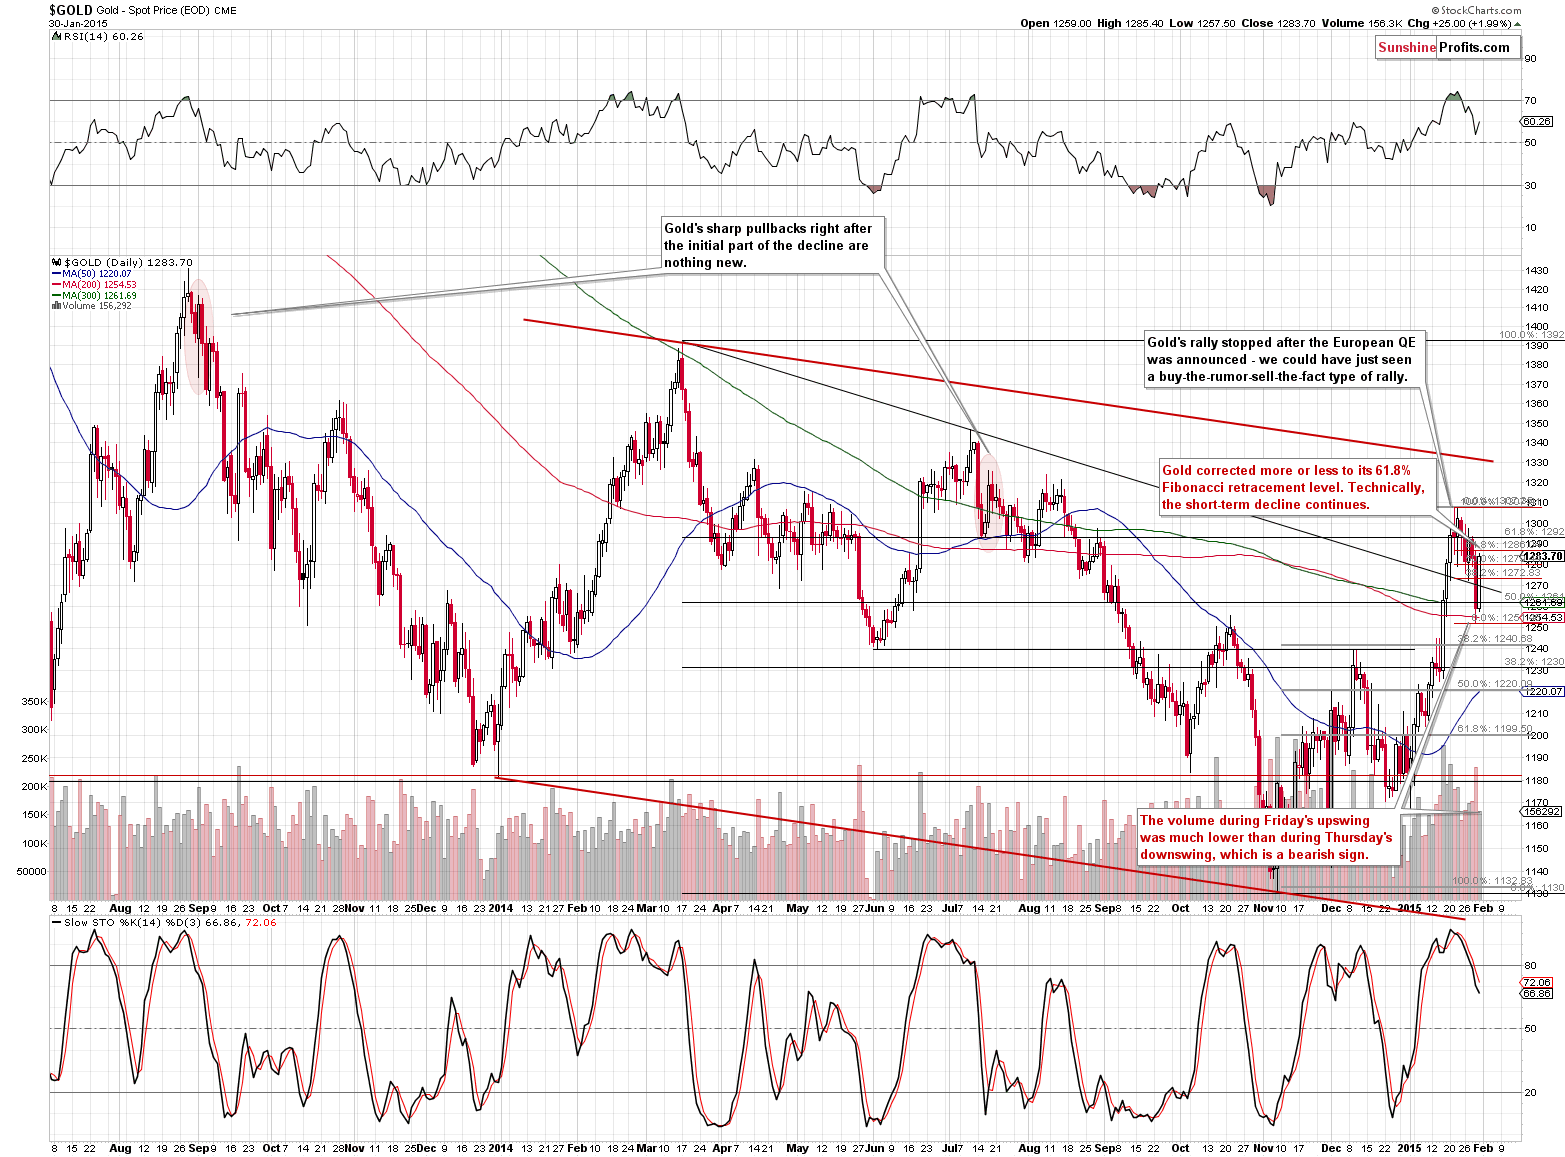
Gold is once again trying to break above the declining support line, but will it succeed? It rallied on relatively low volume on Friday, so it’s more likely that this move was just a corrective upswing, not a beginning of another rally. Gold didn’t move above the 61.8% retracement from the previous downswing, so the short-term decline remains in place also from this perspective.
Please note that it’s not uncommon for gold to correct sharply after the initial decline after an important local top. The same was the case in mid-2013 and mid-2014.
It seems that profits from the current short position were lowered only temporarily.
Our previous comments regarding the potential size of the decline remain up-to-date:
How low can it go? It might be best to keep the short position intact until we see bullish signs, but at this time the highest of the target prices is the first Fibonacci retracement level – close to $1,240. The $1,200 level, which is approximately the 61.8% retracement, is even more likely to stop the current decline. Still, it seems that we are not seeing a local top in the USD Index and gold keeps declining, so perhaps we will see a move even below the 2014 lows. We will be monitoring the market for signs of strength and report to you accordingly.
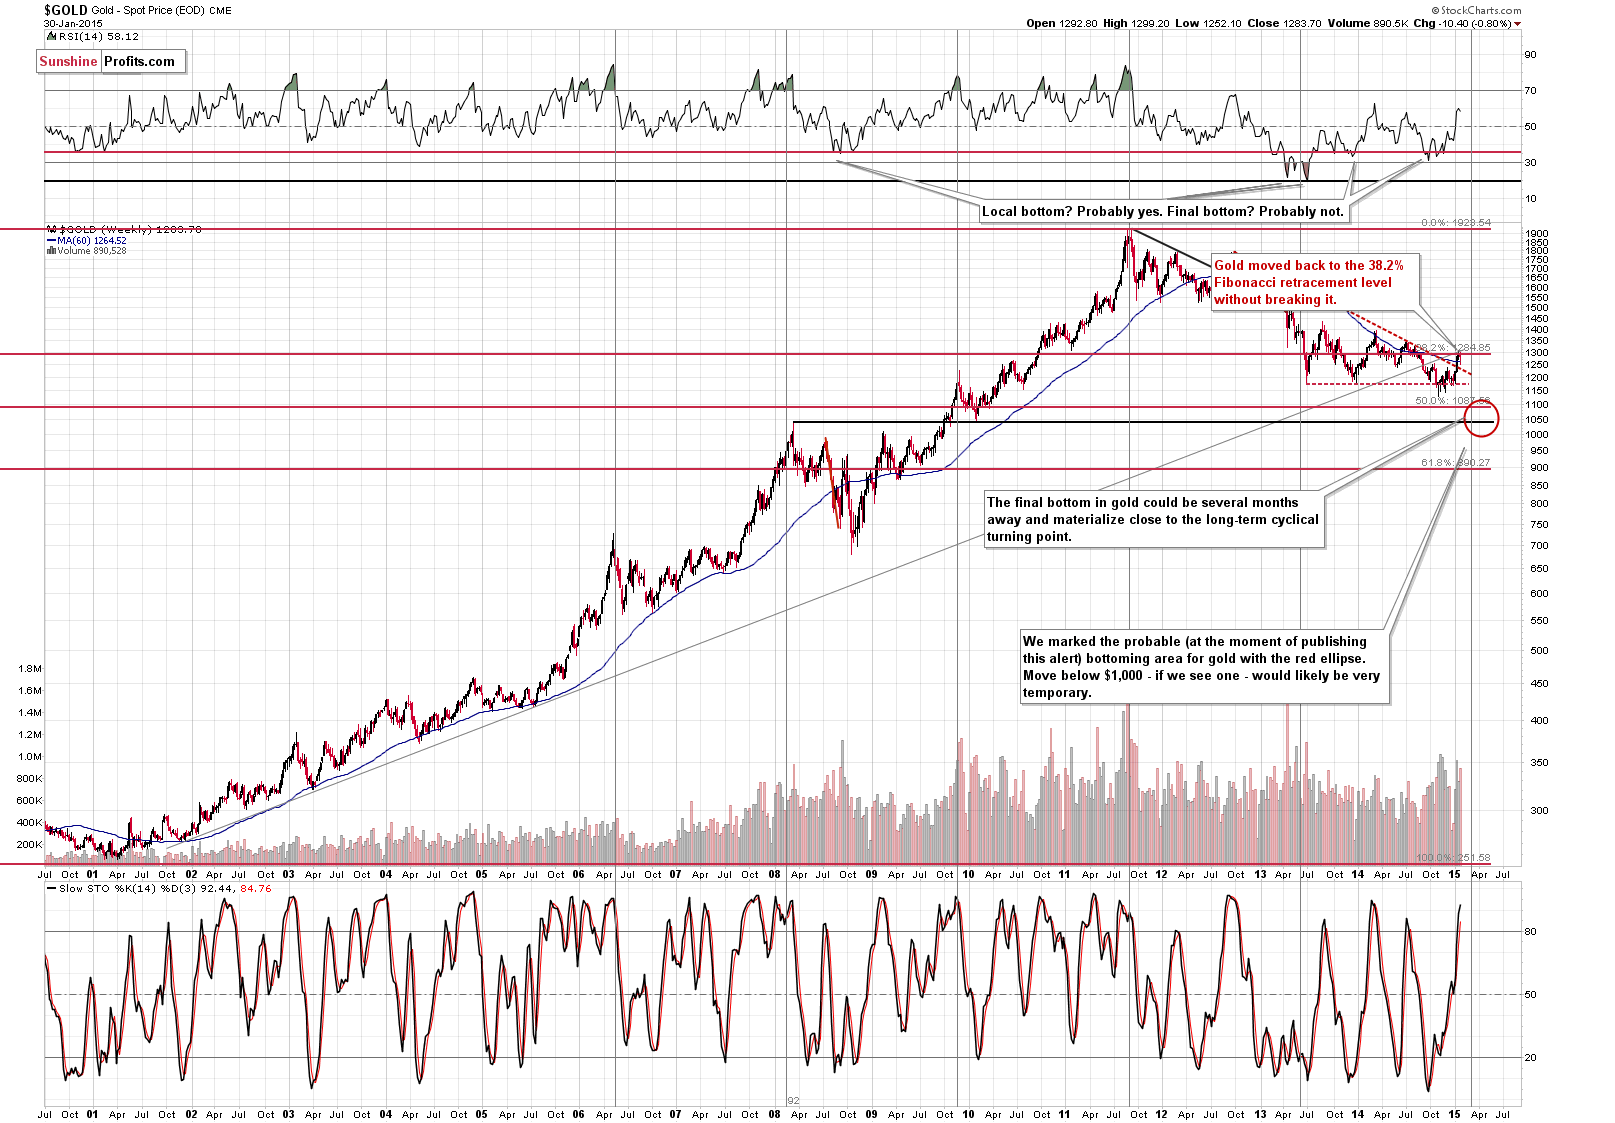
From the long-term perspective, we see that gold moved back to the 38.2% retracement based on the entire 2001-2011 rally but didn’t close above it. Consequently, there are no changes in the above picture and our previous comments on it remain up-to-date:
Let’s keep in mind that gold is quite likely to decline based on the long-term cyclical turning point. It seems probable that the next major bottom will be formed within the next several months – please see how effective these turning points were in the past cases.
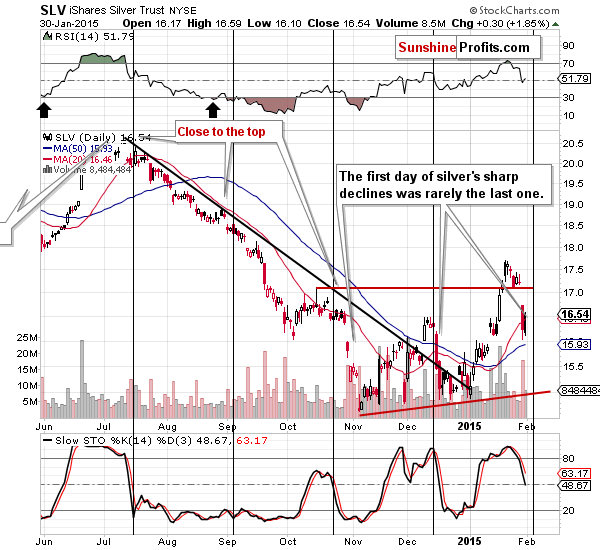
The size of the corrective upswing in silver was very small. No wonder – the CME increased margins for silver and in general margin hikes have negative impact on the prices of metals. The short-term outlook for silver remains bearish, even given the looming cyclical turning point, which would normally have bullish implications as the most recent short-term move has been down.
The small, daily upswing that we saw on Friday doesn’t change anything in our view and what we wrote previously remains up-to-date:
(…) given the size of yesterday’s decline in the white metal, it seems that it can quickly move even lower. Please note that in the past, when silver started to suddenly plunge (the pace of the decline increased dramatically) it was usually not a single-day decline. In the recent past we had 2 similar cases. In the first one (late October 2014) after the first day silver still had most of the decline ahead of it, and in the second case (mid-December 2014), silver declined more or less half in the first day.
If the history is to repeat itself to a considerable extent, then we might see another $1 decline in silver very soon – quite likely to the rising red support line.
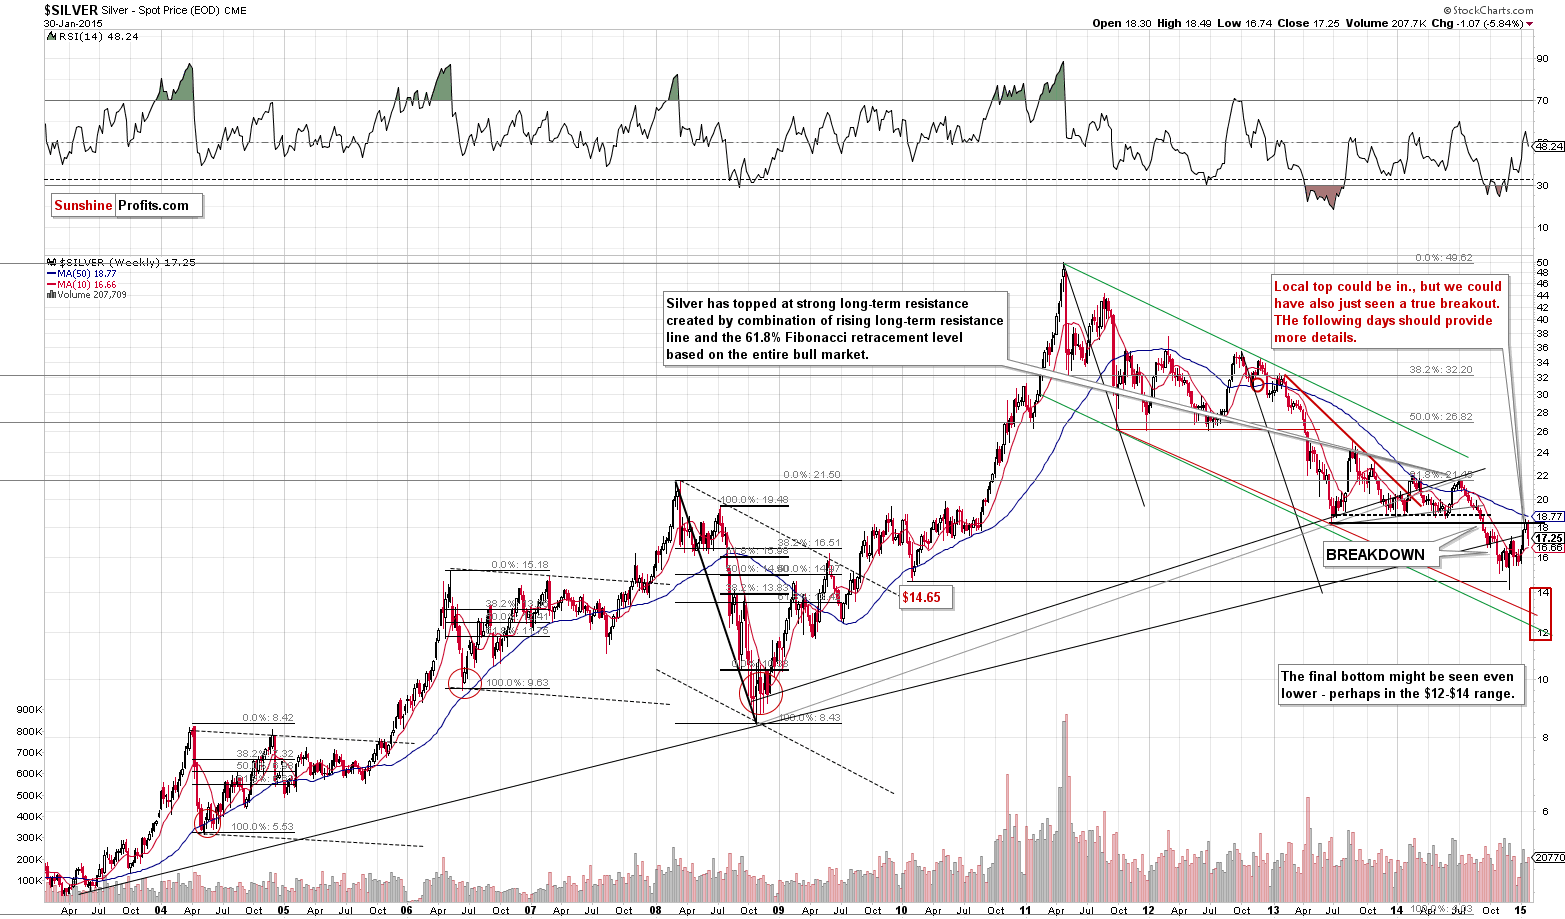
From the long-term perspective, things look bearish for silver as well. The white metal moved back below the rising long-term resistance/support line last week, thus invalidating the previous move above it.
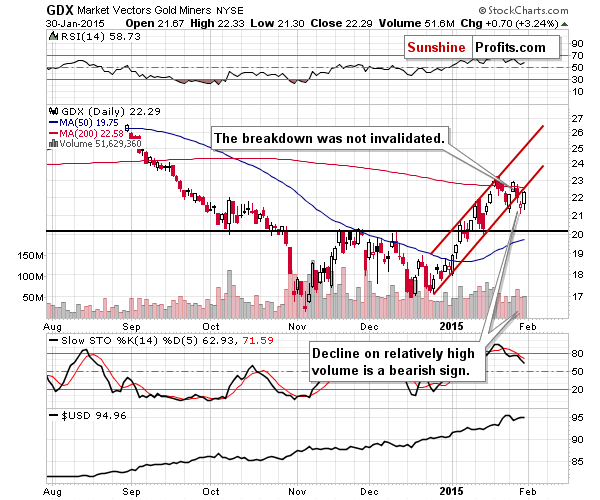
On Friday we wrote the following about the GDX ETF chart:
We have just seen this breakdown. The move was not as huge as it was in the case of gold, so we don’t view it as confirmed, but it’s still a bearish development. Let’s keep in mind that the general stock market rallied yesterday, which could have contributed to the miners’ strength. Perhaps this “strength” took the form of not declining as significantly as gold. All in all, the fact that miners closed below the support line is meaningful and bearish.
Mining stocks moved higher, but the volume was not huge, it doesn’t serve as a confirmation of the rally and – most importantly – the breakdown below the rising support line was not invalidated. Consequently, the bearish signal that we got when the breakout materialized remains in place.
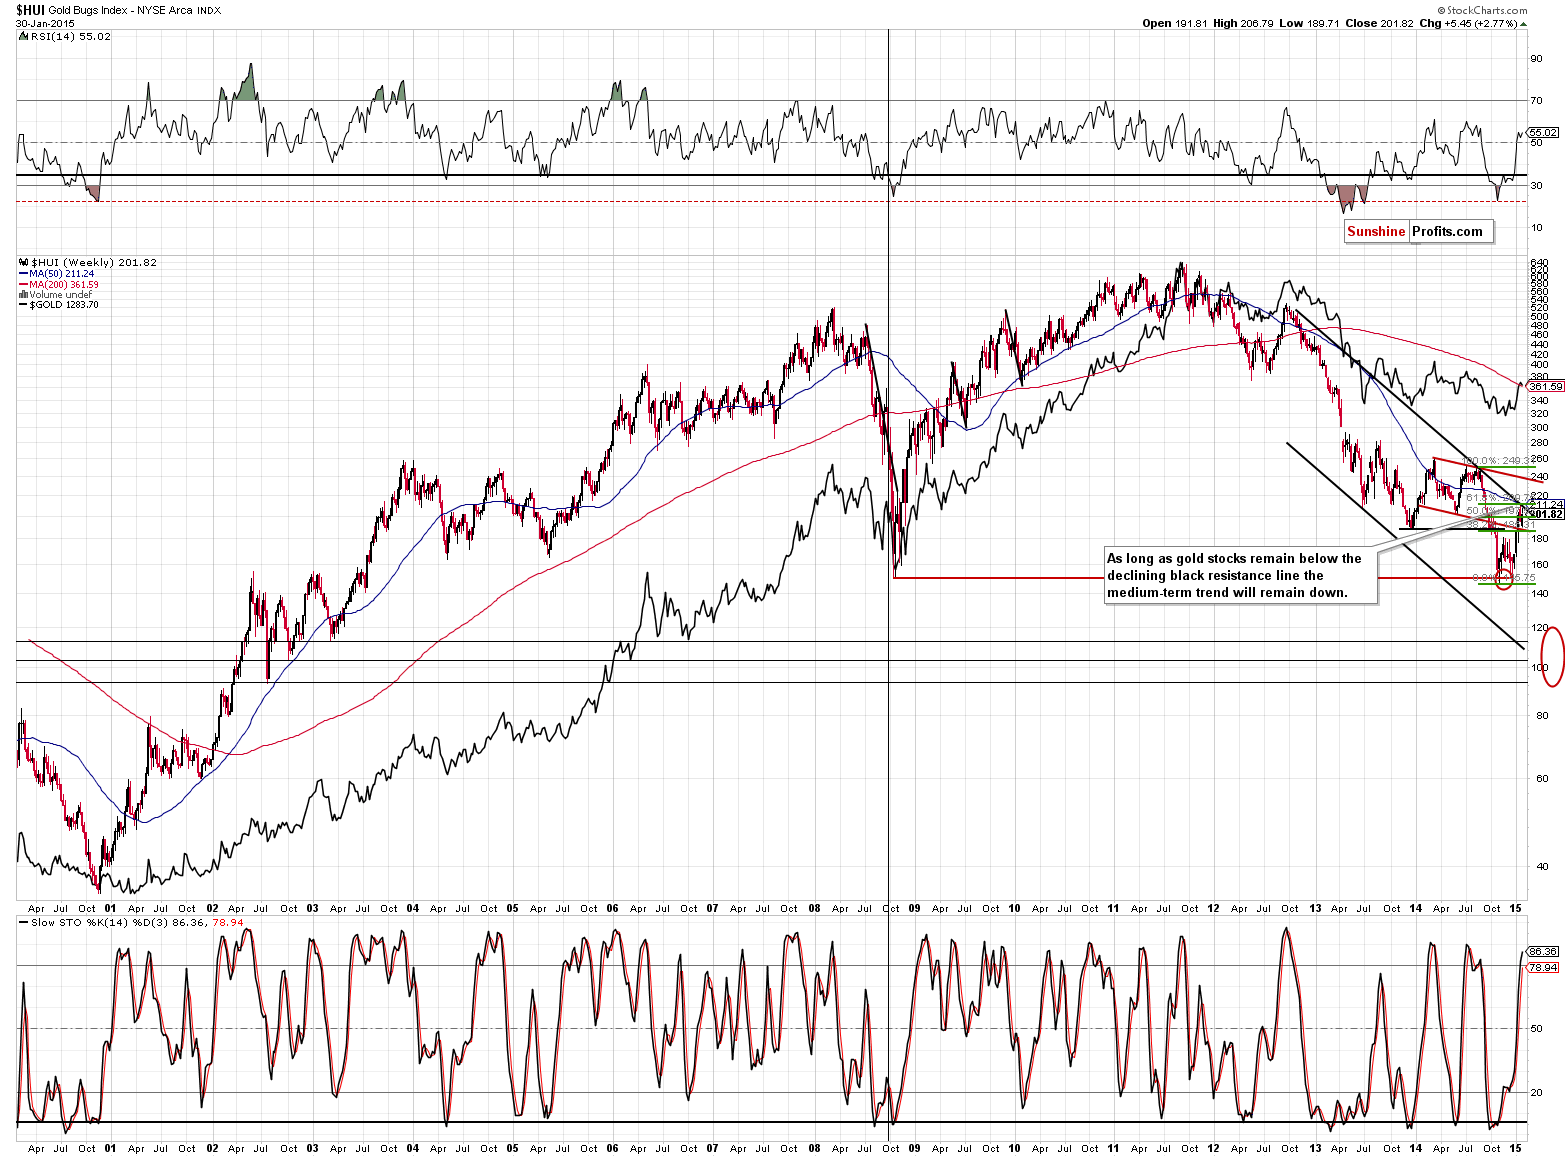
There are no changes from the long-term point of view – the medium-term trend remains down as the declining resistance line remains unbroken.
Summing up, much less changed on Friday than it seems at the first sight and the outlook for precious metals and mining stocks remains bearish.
We will be re-evaluating these positions on a daily basis and if we think that the situation no longer justifies keeping speculative short positions or that adjustments to the long-term investment capital are necessary, we’ll let you know. As always, we’ll keep you – our subscribers – informed.
To summarize:
Trading capital (our opinion): Short positions (full) in gold, silver and mining stocks with the following stop-loss orders and initial (!) target prices:
- Gold: initial target level: $1,245; stop-loss: $1,318, initial target level for the DGLD ETN: $64.60 ; stop loss for the DGLD ETN $55.00
- Silver: initial target level: $16.13 ; stop-loss: $18.63, initial target level for the DSLV ETN: $62.07 ; stop loss for DSLV ETN $41.94
- Mining stocks (price levels for the GDX ETN): initial target level: $20.40 ; stop-loss: $24.23, initial target level for the DUST ETN: $15.55 ; stop loss for the DUST ETN $9.28
In case one wants to bet on lower junior mining stocks' prices, here are the stop-loss details and initial target prices:
- GDXJ: initial target level: $25.43 ; stop-loss: $32.17
- JDST: initial target level: $10.50 ; stop-loss: $5.19
Long-term capital (our opinion): Half positions in gold, half positions in silver, half position in platinum and half position in mining stocks.
Insurance capital (our opinion): Full position
Please note that a full position doesn’t mean using all of the capital for a given trade. You will find details on our thoughts on gold portfolio structuring in the Key Insights section on our website.
As a reminder – “initial target price” means exactly that – an “initial” one, it’s not a price level at which we suggest closing positions. If this becomes the case (like it did in the previous trade) we will refer to these levels as levels of exit orders (exactly as we’ve done previously). Stop-loss levels, however, are naturally not “initial”, but something that, in our opinion, might be entered as an order.
Since it is impossible to synchronize target prices and stop-loss levels for all the ETFs and ETNs with the main markets that we provide these levels for (gold, silver and mining stocks – the GDX ETF), the stop-loss levels and target prices for other ETNs and ETF (among other: UGLD, DGLD, USLV, DSLV, NUGT, DUST, JNUG, JDST) are provided as supplementary, and not as “final”. This means that if a stop-loss or a target level is reached for any of the “additional instruments” (DGLD for instance), but not for the “main instrument” (gold in this case), we will view positions in both gold and DGLD as still open and the stop-loss for DGLD would have to be moved lower. On the other hand, if gold moves to a stop-loss level but DGLD doesn’t, then we will view both positions (in gold and DGLD) as closed. In other words, since it’s not possible to be 100% certain that each related instrument moves to a given level when the underlying instrument does, we can’t provide levels that would be binding. The levels that we do provide are our best estimate of the levels that will correspond to the levels in the underlying assets, but it will be the underlying assets that one will need to focus on regarding the sings pointing to closing a given position or keeping it open. We might adjust the levels in the “additional instruments” without adjusting the levels in the “main instruments”, which will simply mean that we have improved our estimation of these levels, not that we changed our outlook on the markets. We are already working on a tool that would update these levels on a daily basis for the most popular ETFs, ETNs and individual mining stocks.
Our preferred ways to invest in and to trade gold along with the reasoning can be found in the how to buy gold section. Additionally, our preferred ETFs and ETNs can be found in our Gold & Silver ETF Ranking.
As always, we'll keep you - our subscribers - updated should our views on the market change. We will continue to send out Gold & Silver Trading Alerts on each trading day and we will send additional Alerts whenever appropriate.
The trading position presented above is the netted version of positions based on subjective signals (opinion) from your Editor, and the automated tools (SP Indicators and the upcoming self-similarity-based tool).
As a reminder, Gold & Silver Trading Alerts are posted before or on each trading day (we usually post them before the opening bell, but we don't promise doing that each day). If there's anything urgent, we will send you an additional small alert before posting the main one.
=====
Latest Free Trading Alerts:
The situation in the Bitcoin market remains quite interesting and the current developments seem to point to a possible move in the cryptocurrency. Which way might Bitcoin move? Read to learn our opinion.
Bitcoin Trading Alert: Bitcoin Might Move Lower
=====
Hand-picked precious-metals-related links:
India reclaims top spot as No. 1 gold consumer
Weekend’s top story: Gold supply to continue in surplus this year – GFMS
US Mint gold coin sales weakest since 2008
China’s SGE Gold Withdrawals Already 202 Tonnes In Just 3 Weeks
Commodity prices tumble as gold rallies – Scotiabank
The Euro Tragedy & Its Consequences For Gold
=====
In other news:
Greece Asks ECB to Keep Banks Afloat, Tsipras Pitches Deal
Currency War Claims Another Casualty: Denmark
Which central bank will shock markets next?
RBA: The next central bank to ease?
=====
Thank you.
Sincerely,
Przemyslaw Radomski, CFA
Founder, Editor-in-chief
Gold & Silver Trading Alerts
Forex Trading Alerts
Oil Investment Updates
Oil Trading Alerts

