

Briefly: In our opinion, a speculative short position (full) in gold, silver and mining stocks is justified from the risk/reward point of view.
We previously wrote that gold hadn’t been doing much lately, but we can’t say the same about yesterday’s session as gold moved quite sharply higher – and so did silver. What changed?
Let’s take a look at the charts to see if yesterday’s rally was meaningful from the long-term perspective or if it was important only on a day-to-day basis (charts courtesy of http://stockcharts.com).
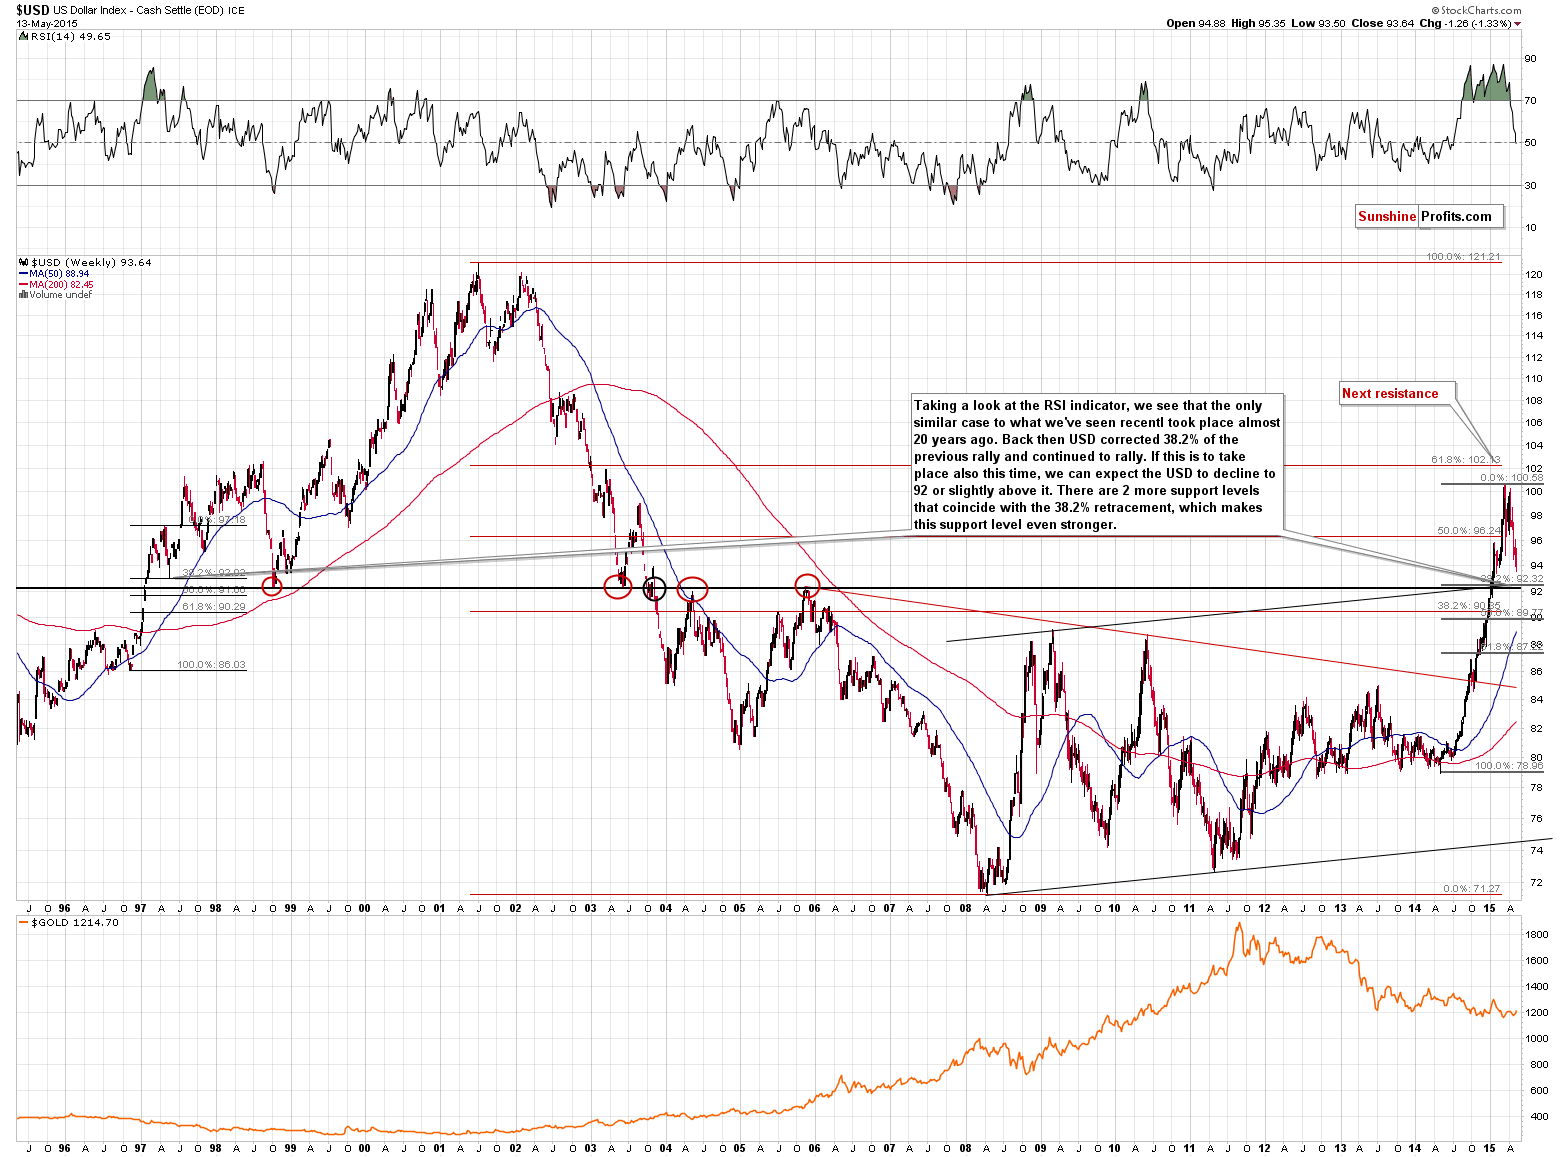
The USD Index is one of the most important charts to be discussing right now because of the factors that we discussed yesterday:
The USD Index was about 5 index points higher about a month ago, so it declined quite a lot. One could have expected precious metals to rally based on such a decline in the USD, but that didn’t happen. Instead gold and silver moved back and forth and gold is actually even lower than it was in the first half of April.
The above tells us 2 things:
- Precious metals are likely to decline as they are not responding to a major positive factor.
- Even if the USD Index moves lower – say to 92 or so – before moving back up, we don’t necessarily have to see higher gold and silver prices.
The above remains up-to-date – metals are still likely to decline based on the above relationship. The most interesting thing is that while yesterday gold moved along with the USD Index, it’s not doing that today – it’s Thursday morning and gold is up $2 while the USD Index is down 0.50, trading at 93.18. The situation is developing as it was previously – gold responded to the USD’s decline, now it’s ignoring it and it could decline (perhaps erasing yesterday’s rally) once the USD Index corrects a little (say, 38.2% of yesterday’s decline or so). This is the kind of pattern that made gold move back and forth while the USD declined – and it remains in place. The situation did not really change yesterday – it continued to develop in the way that it had been developing previously.
The thing that changed was the surprisingly bad data – and the key word here is “surprisingly”. Markets were surprised and investors rushed to buy based on the sudden thought that the Fed will not raise interest rates. A single data point is not likely to change a trend (it could if it made gold plummet instead of rallying, thus taking gold to the extremely oversold levels earlier) – it simply delayed the decline. As the data was surprising it was not to be foreseen – but our approach takes such “surprises” and markets’ less-than-perfect predictability into account – that’s why we focus on the longer time-frames first (which are generally not affected by such “surprises”) and that’s why we placed the stop-loss orders for the current trade at relatively high levels – not to be shaken out of the market right before it plunges (and you saw just how quickly and sharply these surprising rallies can turn into declines on April 30).
Now, with the USD at 93.18 it’s just 1 index point above the combination of very strong support levels. Consequently, if the USD Index simply declines again, twice as much as it has declined so far today, we will be very likely seeing a major bottom, and a top in the precious metals prices. Can the USD rally sooner? Yes, the RSI indicator based on the daily USD closing prices is almost at the 30 level, which corresponded to local bottoms in the past. The implications for the precious metals are bearish for the medium term and short term but a bit unclear for the very short term (the next few days).
Having said that, let’s take a look at the charts and see what changed.
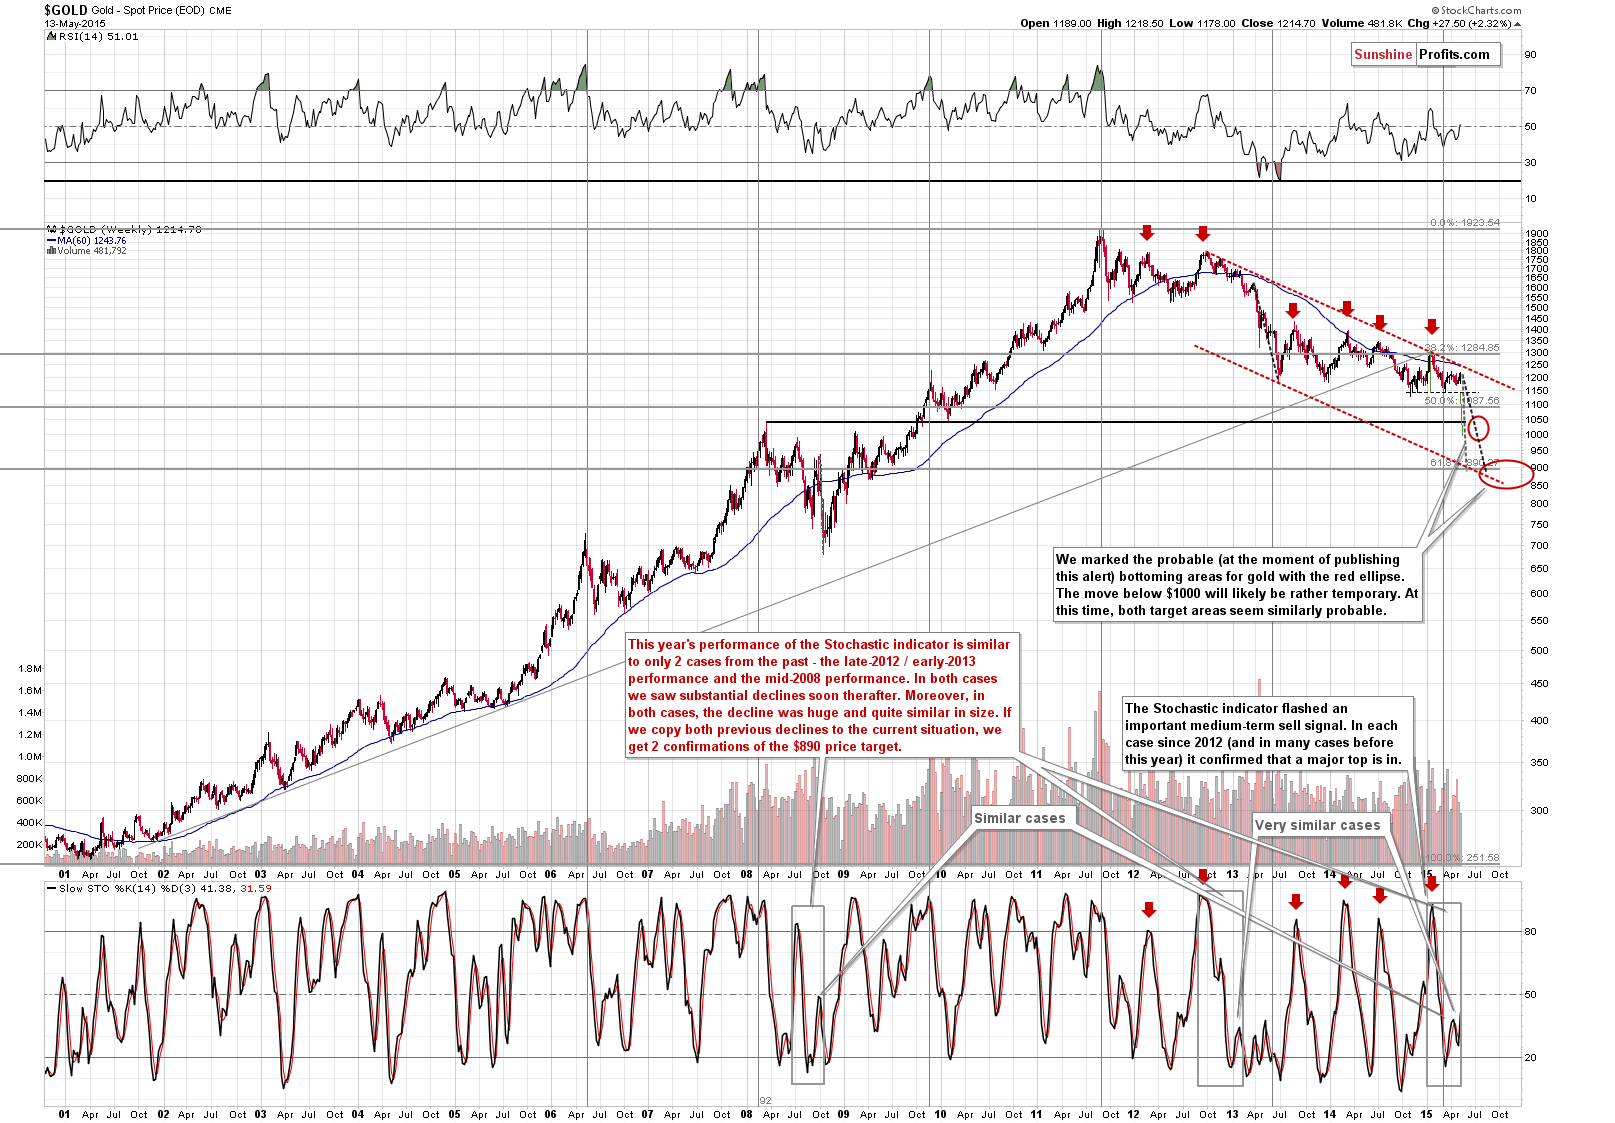
Nothing changed on gold’s long-term chart – gold remains within its medium-term downtrend and yesterday’s rally is not even visible from this perspective.
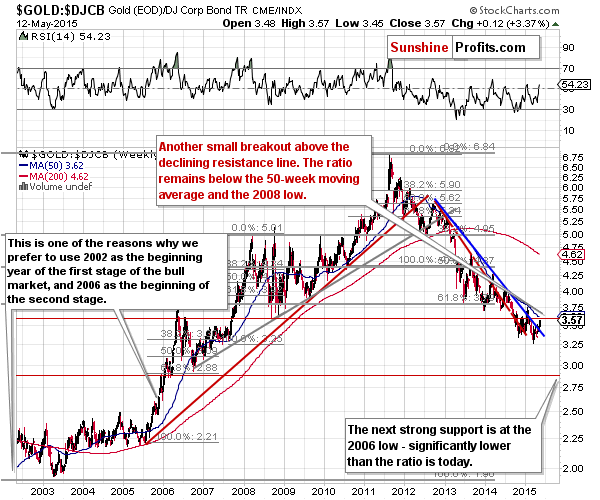
Comparing gold to bonds (both assets are perceived to be the “safe ones” relative to stocks, so the way gold performs relative to bonds can tell us how it would perform if we took out some of its safe-haven appeal) provides us with the same outcome. We saw a small breakout – very similar to the one that we saw at the beginning of this year (and the RSI is at a similar level) and at that time gold was at an important top. This time, the ratio has one additional reason to decline – the 2008 low that was broken to the downside. We simply saw a move back to it – which will quite likely become a verification of this breakdown.
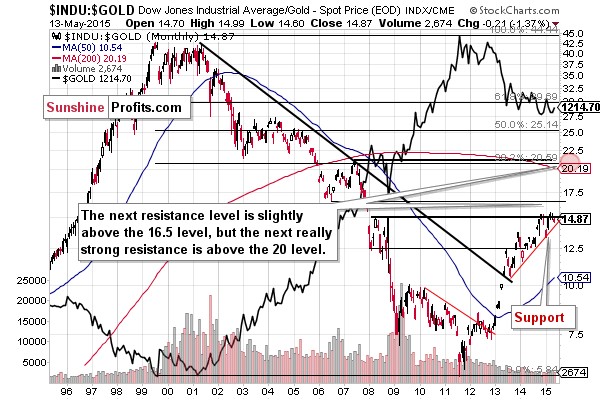
The Dow to gold ratio is close to the rising support line, which implies that even if the ratio hasn’t bottomed yet, it’s likely to form a bottom relatively soon. Naturally, a bottom in this ratio would very likely correspond to a top in the price of gold and the rest of the precious metals sector.
Yesterday we wrote the following about silver:
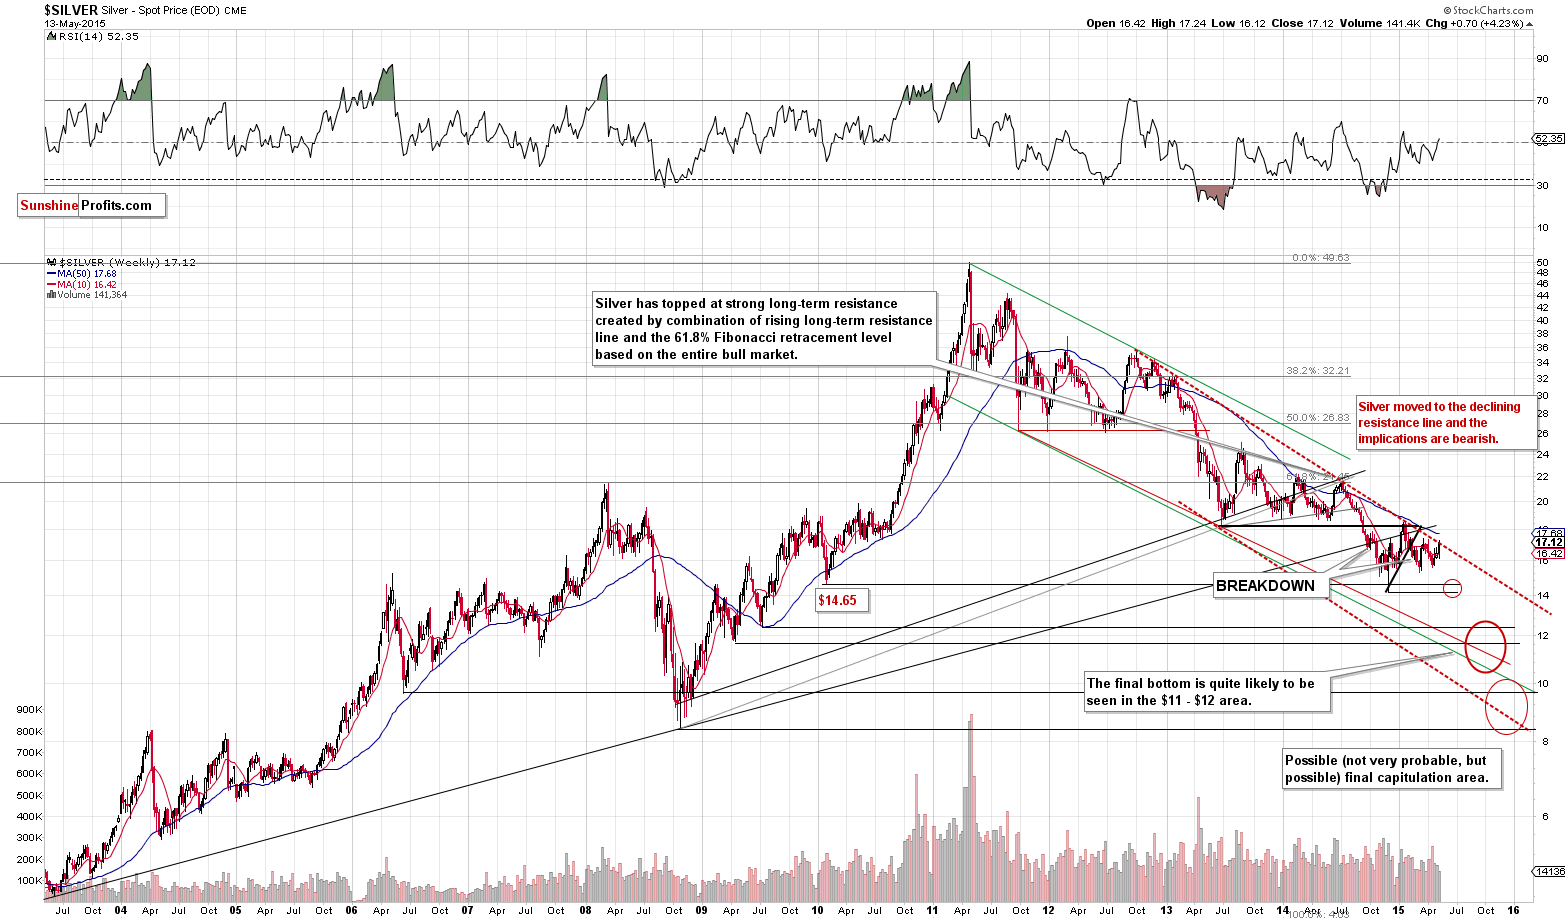
With regard to silver, there’s also not much that we can say except emphasizing once again that silver doesn’t have much room to rally as the very strong resistance line is very close. On the other hand, there is a lot of room for declines from the current levels.
Silver moved right to the declining resistance line. Now silver has no room to rally. Please keep in mind that it doesn’t mean that it will not move temporarily higher – it could do so, but it’s very unlikely to move visibly higher (by doubling or tripling yesterday’s rally, for instance) and if any move above this line is seen, then it’s likely to be very temporary. Based on the above chart, it seems that adding to short positions should be considered.
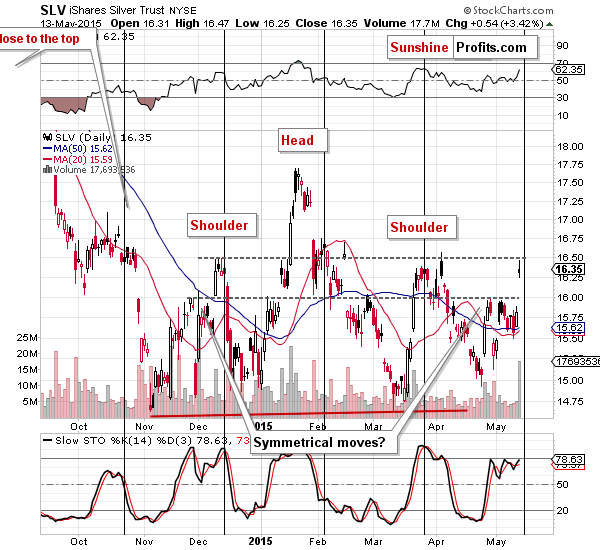
Yesterday we wrote the following about silver’s short-term chart:
There is a short-term reason for the decline in the form of the cyclical turning point. If silver moves even higher temporarily, this will not be really bullish as it will only make it clear that the turning point will have bearish consequences. Moreover, as it is the case with gold, silver didn’t move higher based on the USD’s decline, which can be seen as bearish.
We already commented on the USD’s link to the precious metals sector, so let’s focus on the upcoming turning point. It’s very likely to have a negative effect on the prices of precious metals, especially that we saw a visible rally yesterday. Please note that this is the outcome that we saw as possible (not imminent, though) and we had already commented on its implications – that they would not be really bullish – and we don’t view them as such.
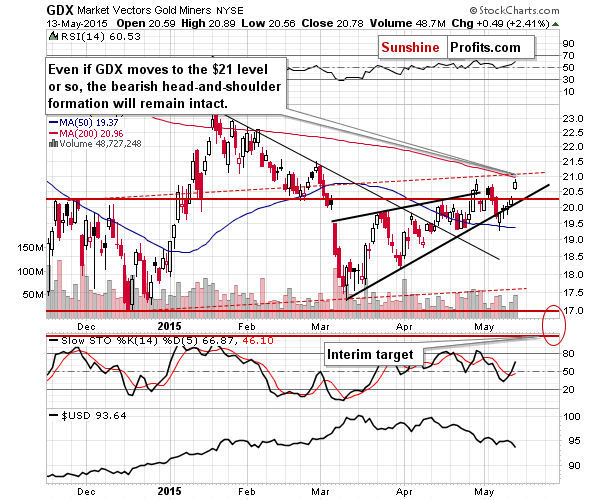
Mining stocks moved higher yesterday, but the GDX ETF didn’t move above the rising dashed line (currently slightly above the $21 level), so (as we have been writing for the GDX chart for the past several days) this move doesn’t change much. It looks encouraging for gold bulls, but it doesn’t change much.
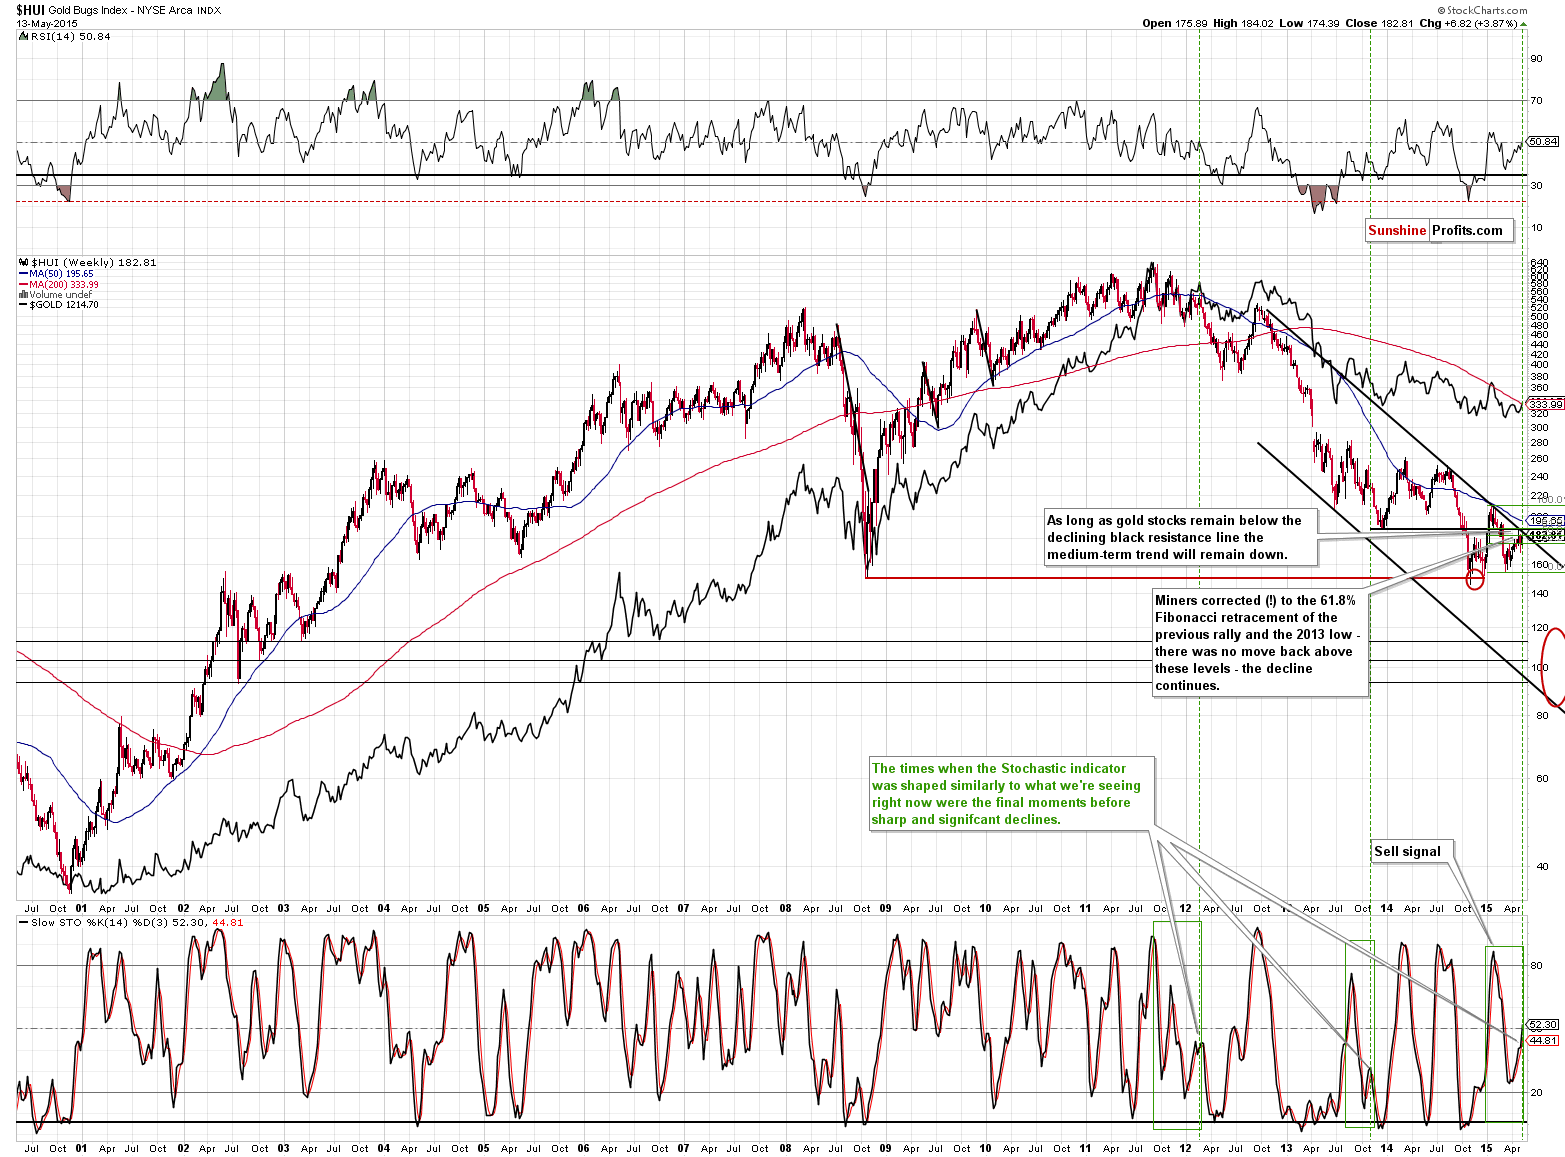
The most important reason for which not much changed is the long-term chart featuring gold stocks.
Yesterday, we commented on the above chart in the following way:
The potential size of the decline is huge, while the potential size of another move higher is very limited. The implications are bearish and will remain bearish unless we see a confirmed breakout above the declining long-term resistance line.
The above is very up-to-date today. The HUI Index is almost right at the declining resistance line, so it’s very likely to move lower without an additional significant rally. Just like for the long-term chart of silver: based on the above chart, it seems that adding to short positions should be considered.
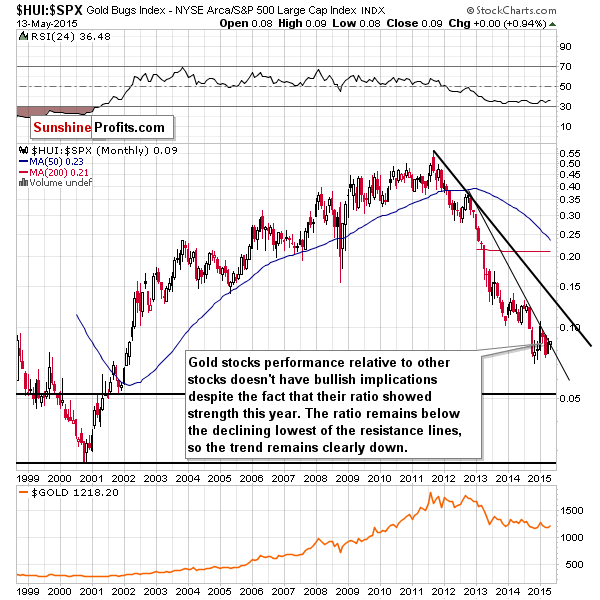
Moreover, if we compare the performance of gold stocks to the one of the general stock market, we’ll see that the trend clearly remains down – there was no breakout in the HUI to S&P 500 ratio.
Summing up, quite a lot seems to have happened yesterday, but actually not much really changed. There were no changes in the long-term pictures although the day-to-day price action seems to have been significant. Once again it seems that the major decline in the precious metals sector was simply delayed. It’s likely that it was not delayed by much, as silver and the HUI Index reached (almost reached in case of the latter) their respective resistance levels and a turnaround is likely just around the corner, especially given silver’s cyclical turning points and the proximity of the combination of very strong support levels in the USD Index. We are moving the stop-loss for silver a little higher due to its recent volatility and its current price.
We will keep you – our subscribers – updated.
To summarize:
Trading capital (our opinion): Short (full position) position in gold, silver and mining stocks is justified from the risk/reward perspective with the following stop-loss orders and initial (!) target prices:
- Gold: initial target price: $1,115; stop-loss: $1,253, initial target price for the DGLD ETN: $87.00; stop loss for the DGLD ETN $63.78
- Silver: initial target price: $15.10; stop-loss: $18.13, initial target price for the DSLV ETN: $67.81; stop loss for DSLV ETN $38.44
- Mining stocks (price levels for the GDX ETN): initial target price: $16.63; stop-loss: $21.83, initial target price for the DUST ETN: $23.59; stop loss for the DUST ETN $10.37
In case one wants to bet on lower junior mining stocks' prices, here are the stop-loss details and initial target prices:
- GDXJ: initial target price: $21.17; stop-loss: $27.31
- JDST: initial target price: $14.35; stop-loss: $6.18
Long-term capital (our opinion): No positions
Insurance capital (our opinion): Full position
Please note that a full position doesn’t mean using all of the capital for a given trade. You will find details on our thoughts on gold portfolio structuring in the Key Insights section on our website.
As a reminder – “initial target price” means exactly that – an “initial” one, it’s not a price level at which we suggest closing positions. If this becomes the case (like it did in the previous trade) we will refer to these levels as levels of exit orders (exactly as we’ve done previously). Stop-loss levels, however, are naturally not “initial”, but something that, in our opinion, might be entered as an order.
Since it is impossible to synchronize target prices and stop-loss levels for all the ETFs and ETNs with the main markets that we provide these levels for (gold, silver and mining stocks – the GDX ETF), the stop-loss levels and target prices for other ETNs and ETF (among other: UGLD, DGLD, USLV, DSLV, NUGT, DUST, JNUG, JDST) are provided as supplementary, and not as “final”. This means that if a stop-loss or a target level is reached for any of the “additional instruments” (DGLD for instance), but not for the “main instrument” (gold in this case), we will view positions in both gold and DGLD as still open and the stop-loss for DGLD would have to be moved lower. On the other hand, if gold moves to a stop-loss level but DGLD doesn’t, then we will view both positions (in gold and DGLD) as closed. In other words, since it’s not possible to be 100% certain that each related instrument moves to a given level when the underlying instrument does, we can’t provide levels that would be binding. The levels that we do provide are our best estimate of the levels that will correspond to the levels in the underlying assets, but it will be the underlying assets that one will need to focus on regarding the sings pointing to closing a given position or keeping it open. We might adjust the levels in the “additional instruments” without adjusting the levels in the “main instruments”, which will simply mean that we have improved our estimation of these levels, not that we changed our outlook on the markets. We are already working on a tool that would update these levels on a daily basis for the most popular ETFs, ETNs and individual mining stocks.
Our preferred ways to invest in and to trade gold along with the reasoning can be found in the how to buy gold section. Additionally, our preferred ETFs and ETNs can be found in our Gold & Silver ETF Ranking.
As always, we'll keep you - our subscribers - updated should our views on the market change. We will continue to send out Gold & Silver Trading Alerts on each trading day and we will send additional Alerts whenever appropriate.
The trading position presented above is the netted version of positions based on subjective signals (opinion) from your Editor, and the Tools and Indicators.
As a reminder, Gold & Silver Trading Alerts are posted before or on each trading day (we usually post them before the opening bell, but we don't promise doing that each day). If there's anything urgent, we will send you an additional small alert before posting the main one.
=====
Latest Free Trading Alerts:
On Monday, Greece repaid a €750 million loan installment to the IMF. How does it affect the Greek debt crisis and what does it mean for the gold market?
Gold News Monitor: Greece repays €750 million loan to IMF
On Tuesday, crude oil gained 3.15% as a weaker greenback and the EIA short-term energy outlook supported the price. In this way, light crude closed the day above $61, approaching the recent high, but did this one-day rally change the short-term picture of the commodity?
Oil Trading Alert: The Moment of Truth for Crude Oil Is Coming
=====
Hand-picked precious-metals-related links:
S.Africa's AMCU union wants gold mining firms to double minimum pay
Platinum price could test $1,000 in 2015 – GFMS
Germans pile into gold amid Greek eurozone default fears
Why China Is Taking Control of Physical Gold Pricing
Roaring Bull Market in Stocks Means Shoppers Want Less Gold
=====
In other news:
Dollar Bulls Wonder What Went Wrong
=====
Thank you.
Sincerely,
Przemyslaw Radomski, CFA
Founder, Editor-in-chief
Gold & Silver Trading Alerts
Forex Trading Alerts
Oil Investment Updates
Oil Trading Alerts

