
Briefly: In our opinion no speculative short positions in gold, silver and mining stocks are currently justified from the risk/reward perspective.
Gold, silver and mining stocks declined on Friday and… The situation actually improved. This might be surprising, because declines are usually a bearish development. However, in this case, the context is particularly important.
The thing that changes a lot regarding the metals’ and miners’ decline is the size of the rally in the USD Index and the level at which it currently trades. Let’s jump right to the charts (charts courtesy of http://stockcharts.com).
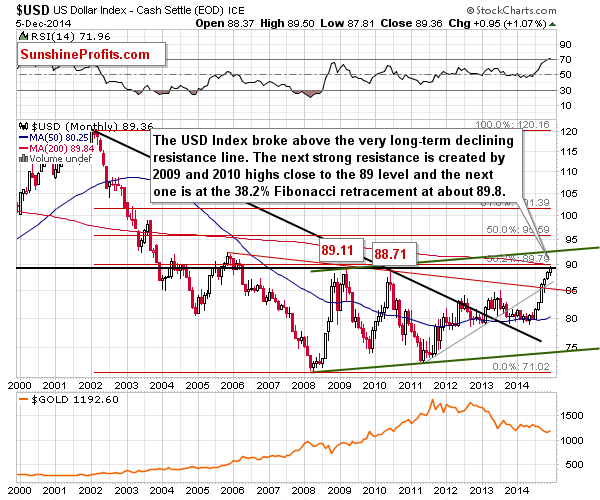
Our previous comments on the above chart remain up-to-date:
The long-term picture is the key thing to keep in mind at this time, as it is the long-term resistance level that was just reached. This week, the USD Index moved above both the 2010 high and the 2009 high, which means that there are good reasons for the index to decline sooner rather than later. We saw a decline just yesterday, but at this time it’s not completely clear that the top is already in. We could still see a move to the 38.2% Fibonacci retracement level based on the entire 2002 – 2008 decline [at about 89.80]. This means that we are likely to see a corrective downswing relatively soon, but not necessarily right away.
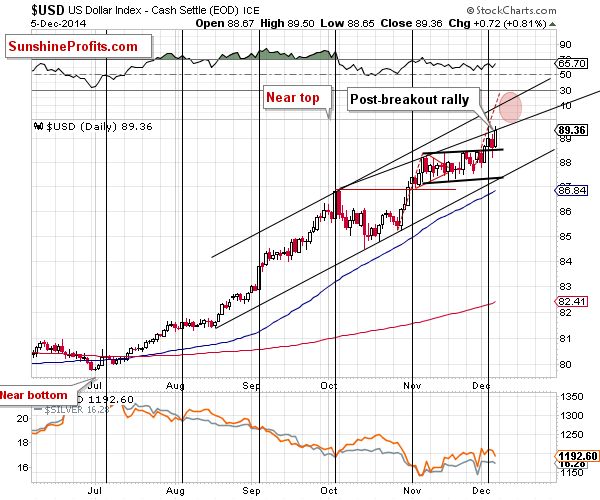
The USD Index moved higher on Friday (the intra-day high was 89.50), so it’s now very close to the resistance. The potential for a further rally is limited at this time.
More importantly, even though the USD Index rallied significantly, the precious metals sector didn’t decline significantly. There was a decline, but it was rather small and on limited volume.
Here’s what we wrote about the USD Index’s short-term picture on Friday:
The reason for which we think that the short-term rally might not be over yet is that we have just seen a confirmation of the breakout from the flag pattern. The USD Index closed for a third consecutive day above the upper border of the pattern, which means that the move higher has just become much more probable. Please note that the cyclical turning point has indeed generated a short-term (a daily one so far) decline, but overall the USD closed above the flag pattern. Consequently (given the 3rd close and the ability to hold above the pattern even taking into account the bearish influence of the turning point), the breakout seems to be verified.
(…)
At this time, it seems that the scenario in which the USD Index moves even higher in the short run is more probable.
We indeed saw a move higher in the USD. Again, the potential for further rally is present but it doesn’t seem that USD Index can move much higher in the short term.
Gold has held up relatively strong in the recent weeks, which makes it even more likely to move higher if the USD Index declines – and the latter is likely to decline relatively soon.
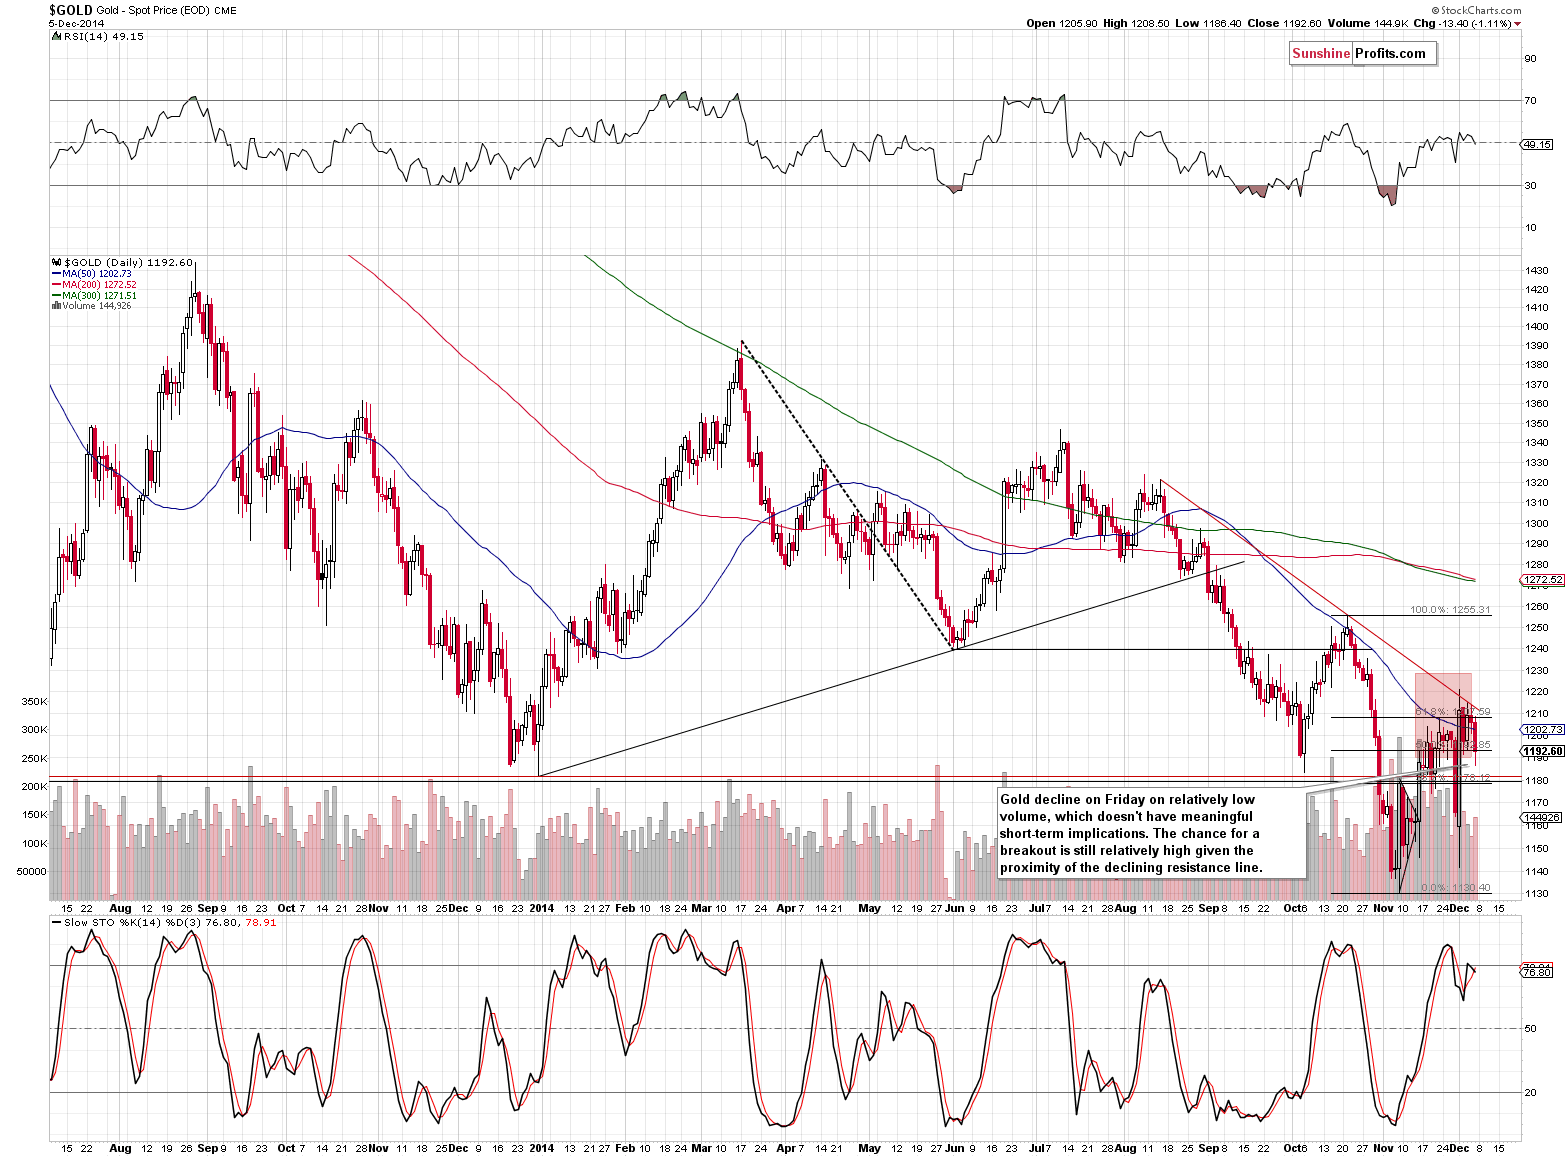
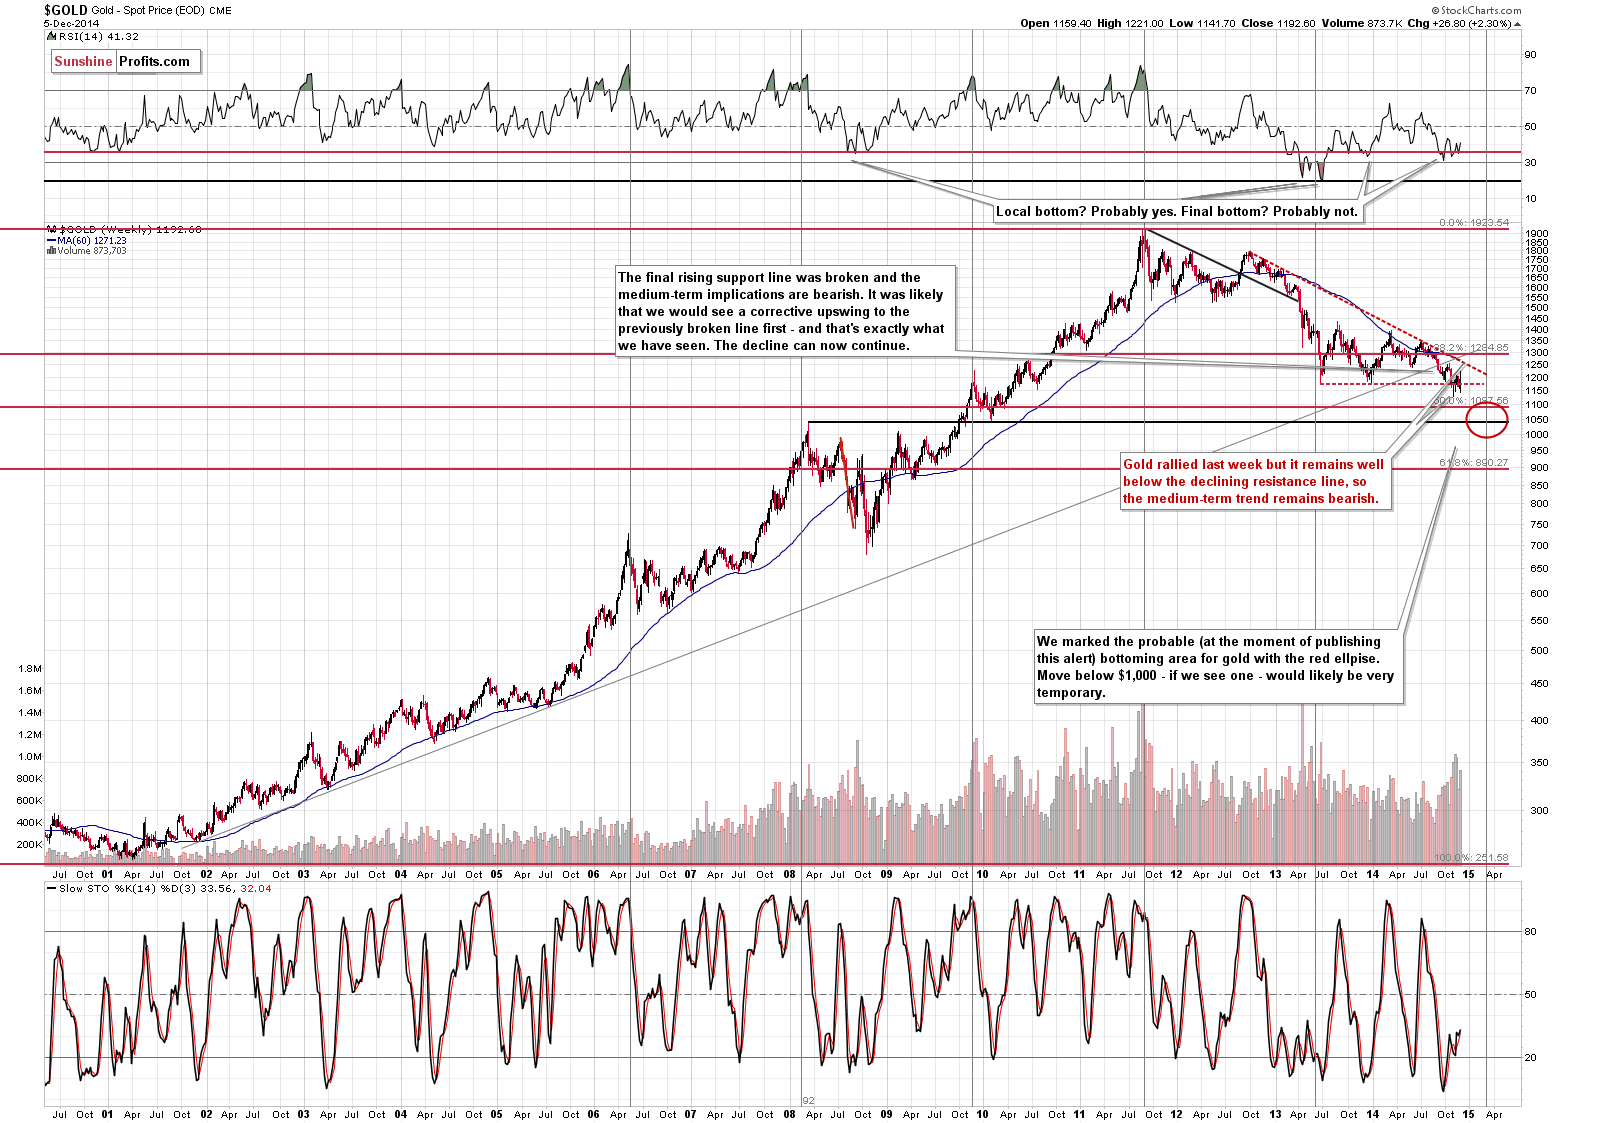
The medium-term trend for gold remains down and it is below the declining short-term resistance line and the 61.8% Fibonacci retracement level, so it could still be the case the final part of U.S. dollar’s rally will generate a substantial decline in the price of the yellow metal. However, this is less and less likely with each day of strength shown while the USD continues to rally.
If the USD Index rallies again and the decline in gold is shallow (or nonexistent), the odds will be that a breakout and a more sizable move (say, to $1,250 or so) will be to the upside. We just saw a similar situation – on Friday – which is why we view the decline in gold as a bullish development.
At this time we don’t think that the situation is clear enough to open speculative long positions, but if we once again see gold’s limited reaction to the dollar’s move higher and the latter moves close to the 90 level, we will consider opening speculative long positions.
From the medium-term perspective, the trend remains down (and the savings made by staying on the sidelines with one’s long-term investment capital in the previous months are likely to become even bigger in the coming weeks or months), but as far as the next very short-term move is concerned, the outlook is unclear (with a bullish bias) at this time.
The situation in mining stocks and their performance relative to oil stocks also provide contradictory signals.
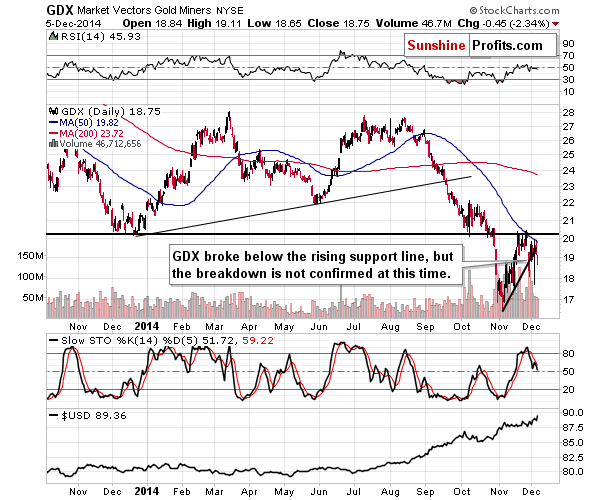
The GDX ETF broke below the rising support line, which is a bearish development, but the volume was rather small, so it’s far from certain if the move will be confirmed.
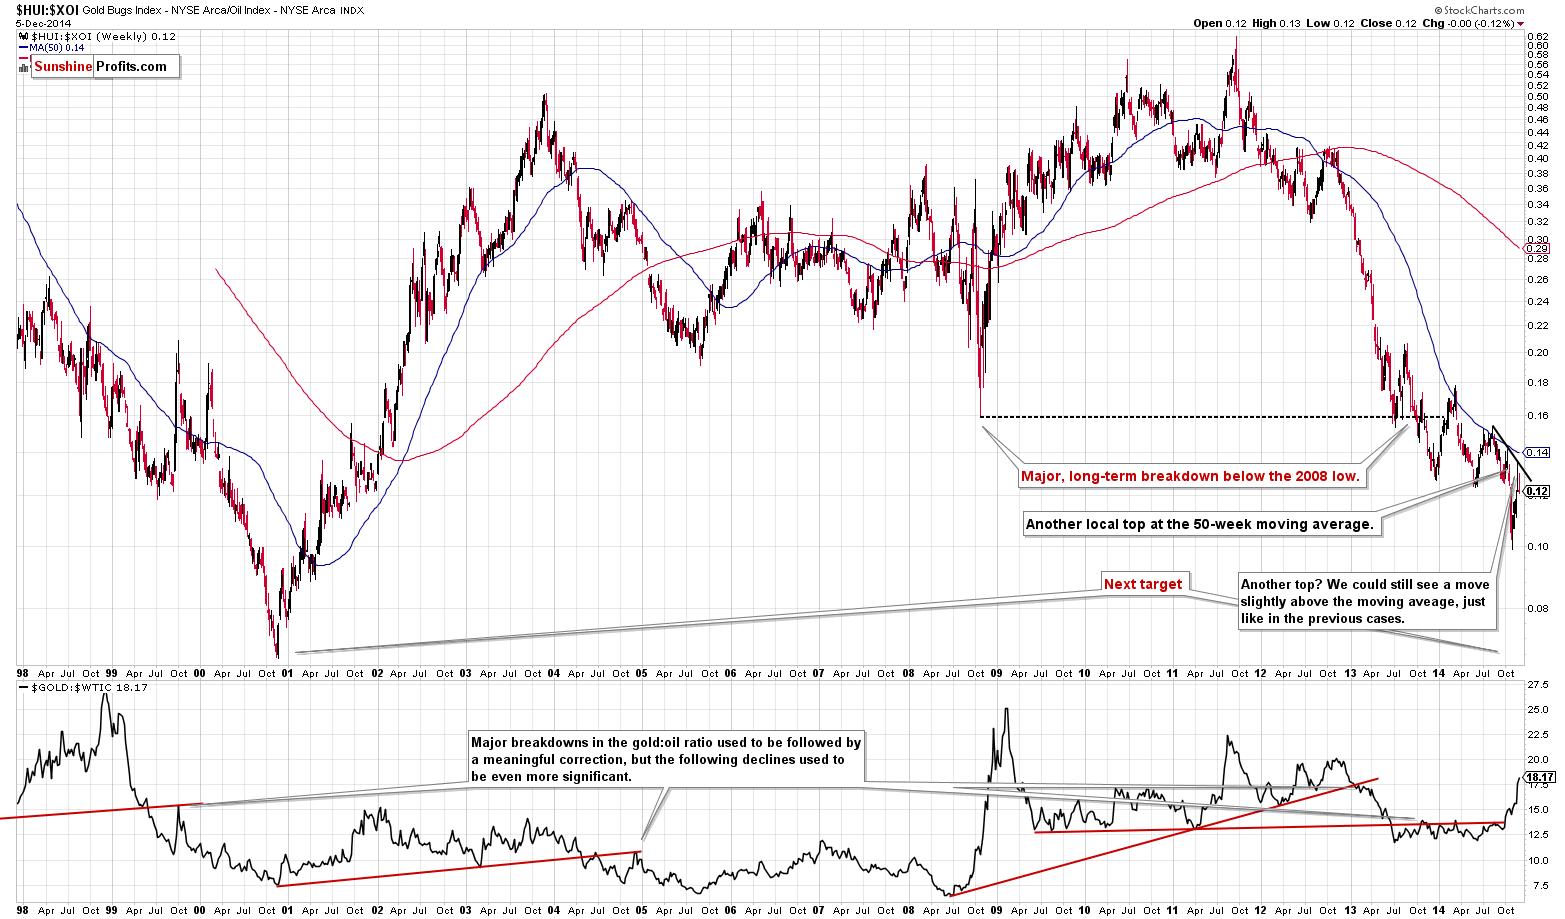
The ratio between mining stocks and oil stocks moved to the very short-term declining resistance line (so a local top in the ratio and in mining stocks could already be in), but it didn’t move to the 50-week moving average, which is what preceded previous local tops, so the local top might not be in just yet.
Overall, we can summarize the situation in the precious metals marker similarly to the previous alert’s summary. The difference is that at this time the short-term outlook for the precious metals sector is a bit more bullish.
Summing up, the medium-term outlook for gold remains bearish, but we have indications that the next short-term move might be up. At this time, however, the indications are not very strong (there was not breakout in gold and silver and mining stocks are at their rising support line and are vulnerable to a breakdown) and there are also signs pointing to lower prices in the short term (the miners’ recent underperformance). Gold’s ability to hold strongly despite the rallying USD Index is a very bullish factor, though.
We will be looking for confirmations of both the bullish and bearish case for the short term and when one of them becomes much more likely we will let you – our subscribers – know. One of the things that could change is that miners could start to outperform gold again, or we could see gold starting to react to the dollar’s strength once again. There could also be other signs, but it’s not possible to list all of them here. Overall, it seems that the next short-term move in the precious metals sector will be to the upside, but, in our opinion, it’s not likely enough to justify opening a speculative long position from the risk/reward perspective. We’ll keep you informed.
To summarize:
Trading capital (our opinion): No positions
Long-term capital (our opinion): No positions
Insurance capital (our opinion): Full position
Please note that a full position doesn’t mean using all of the capital for a given trade. You will find details on our thoughts on gold portfolio structuring in the Key Insights section on our website.
As a reminder – “initial target price” means exactly that – an “initial” one, it’s not a price level at which we suggest closing positions. If this becomes the case (like it did in the previous trade) we will refer to these levels as levels of exit orders (exactly as we’ve done previously). Stop-loss levels, however, are naturally not “initial”, but something that, in our opinion, might be entered as an order.
Since it is impossible to synchronize target prices and stop-loss levels for all the ETFs and ETNs with the main markets that we provide these levels for (gold, silver and mining stocks – the GDX ETF), the stop-loss levels and target prices for other ETNs and ETF (among other: UGLD, DGLD, USLV, DSLV, NUGT, DUST, JNUG, JDST) are provided as supplementary, and not as “final”. This means that if a stop-loss or a target level is reached for any of the “additional instruments” (DGLD for instance), but not for the “main instrument” (gold in this case), we will view positions in both gold and DGLD as still open and the stop-loss for DGLD would have to be moved lower. On the other hand, if gold moves to a stop-loss level but DGLD doesn’t, then we will view both positions (in gold and DGLD) as closed. In other words, since it’s not possible to be 100% certain that each related instrument moves to a given level when the underlying instrument does, we can’t provide levels that would be binding. The levels that we do provide are our best estimate of the levels that will correspond to the levels in the underlying assets, but it will be the underlying assets that one will need to focus on regarding the sings pointing to closing a given position or keeping it open. We might adjust the levels in the “additional instruments” without adjusting the levels in the “main instruments”, which will simply mean that we have improved our estimation of these levels, not that we changed our outlook on the markets. We are already working on a tool that would update these levels on a daily basis for the most popular ETFs, ETNs and individual mining stocks.
Our preferred ways to invest in and to trade gold along with the reasoning can be found in the how to buy gold section. Additionally, our preferred ETFs and ETNs can be found in our Gold & Silver ETF Ranking.
As always, we'll keep you - our subscribers - updated should our views on the market change. We will continue to send out Gold & Silver Trading Alerts on each trading day and we will send additional Alerts whenever appropriate.
The trading position presented above is the netted version of positions based on subjective signals (opinion) from your Editor, and the automated tools (SP Indicators and the upcoming self-similarity-based tool).
As a reminder, Gold & Silver Trading Alerts are posted before or on each trading day (we usually post them before the opening bell, but we don't promise doing that each day). If there's anything urgent, we will send you an additional small alert before posting the main one.
=====
Latest Free Trading Alerts:
S&P 500 index reached new all-time high on Friday, as it slightly extended its long-term uptrend. Is this a topping consolidation or just a flat correction preceding another leg up?
Stock Trading Alert: Still No Short-Term Direction As Stocks Fluctuate Along Record Levels
Yesterday, we finally saw some action. Not very surprisingly, it was to the downside. Today, however, we've seen some appreciation. Which of these moves might be more important at this time?
Bitcoin Trading Alert: Bitcoin Slipping into Bearish Territory
=====
Hand-picked precious-metals-related links:
CME Group Raising Margins For Silver, Copper, Platinum, Palladium
Gold Speculators bullish positions advanced to highest level in six weeks
Belgium Looking to Repatriate its Gold Reserves
Is Indian gold turnaround a game changer for prices?
Gold Bulls Return as Wagers on Stimulus Accumulate: Commodities
=====
In other news:
2015 to be toughest year since recession: Minton Beddoes
Keep an eye on the Fed's accelerating asset sales
Barclays: Slumping Commodities May Be Negative Signal for Stocks
ECB Loans Seen as Underwhelming in Acid Test for Draghi
This rare indicator is pointing to disaster
=====
Thank you.
Sincerely,
Przemyslaw Radomski, CFA
Founder, Editor-in-chief
Gold & Silver Trading Alerts
Forex Trading Alerts
Oil Investment Updates
Oil Trading Alerts

