
Briefly: In our opinion short speculative positions (half) in gold, silver and mining stocks are justified from the risk/reward perspective.
In the previous Gold & Silver Trading Alert we outlined multiple reasons which made us think that we were very close to the next local top in the precious metals. In today’s we will provide a follow-up on the points that we made and feature a few additional phenomena. In short, even though gold, silver, and mining stocks moved a bit higher on Friday, the way they moved made the situation a bit more bearish, not bullish.
Let’s start with the GLD ETF chart (charts courtesy of http://stockcharts.com.)
Let’s quote what we wrote on Friday:
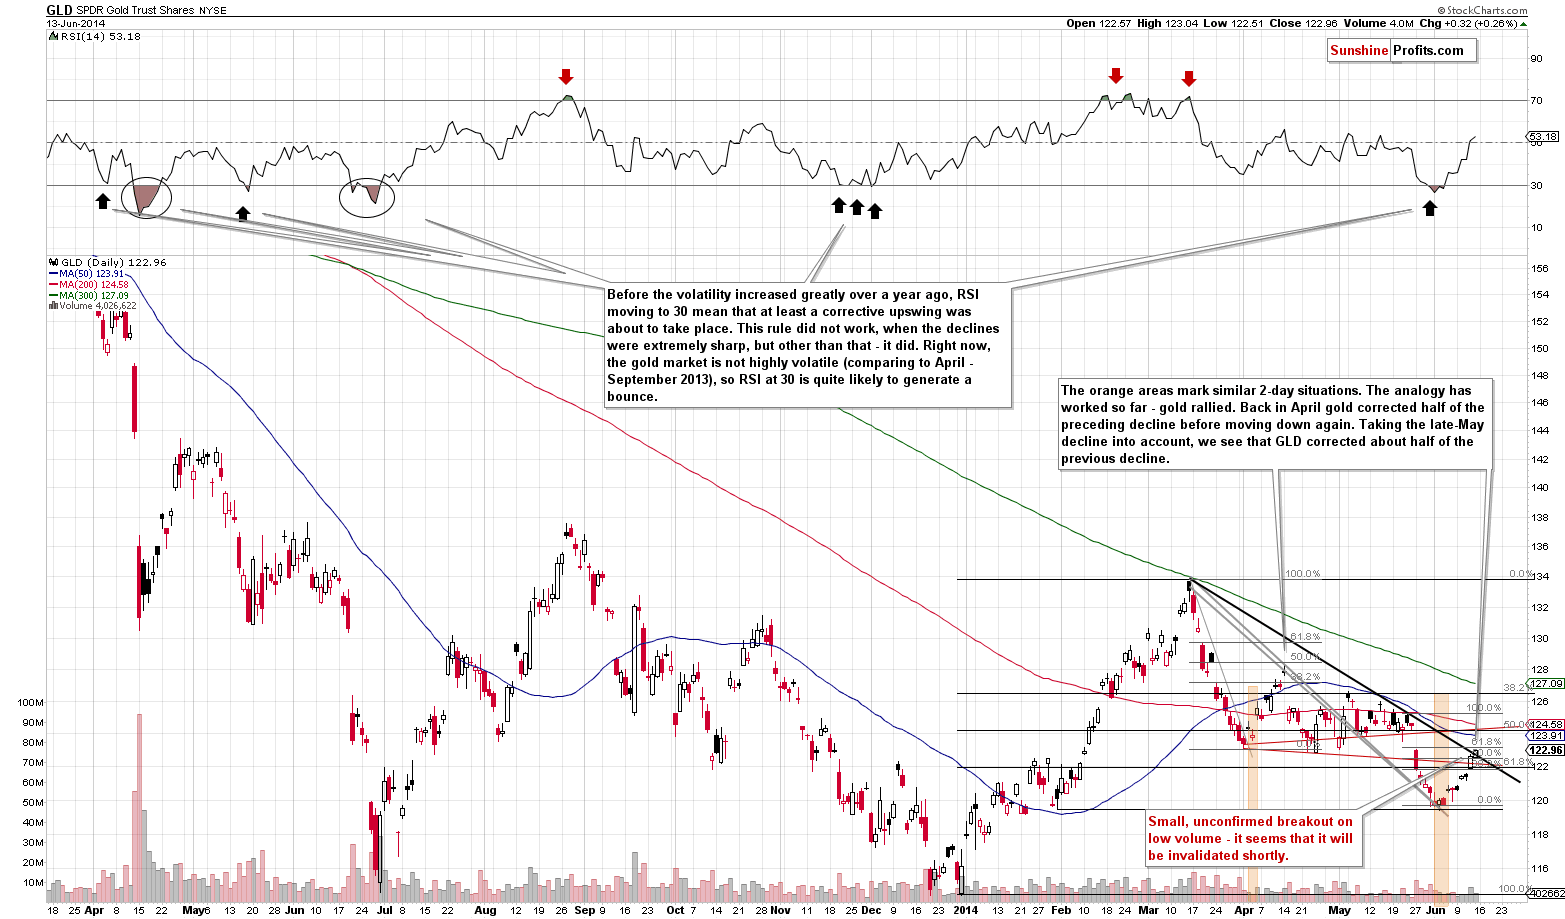
Gold rallied visibly and the move materialized on significant volume. In general – with no other important factors present - such sessions are a bullish sign. At this time, however, we need to take into account the declining resistance line that was just reached, the analogy to the April rally and the medium-term trend (which remains down).
The analogy to the April rally remains in place. We previously commented on it by marking the 2-day session with orange rectangles and writing that we were likely to see a bigger rally once again. The similarity continued and we saw a visible move higher. Now, if the similarity is to continue, then we have probably just seen another local top or we will see one today. The reason is that back in April gold corrected about half of the preceding decline before moving lower once again, and that’s approximately how much of the previous decline gold has just corrected. Please note that at this time it’s less clear what point should we use as the start of the decline as there were a few local tops in May. If we used a higher high, the 50% retracement would be slightly higher as well, but all that it changes is that gold could move just a little higher before forming a top.
The GLD ETF moved slightly (0.26%) higher on Friday and the move materialized on relatively low volume. The price closed a bit above the declining black resistance line, but the size of the move and the accompanying volume suggests that this “breakout” will be invalidated shortly. We have previously written about the small divergence between GLD and spot gold in terms of the declining resistance line:
The declining resistance line marked in black seems to be enough to stop this rally. An analogous line in spot gold was not reached yesterday, but it was reached in pre-market trading today (at approximately $1,277), so the bearish implications are present also from this perspective.
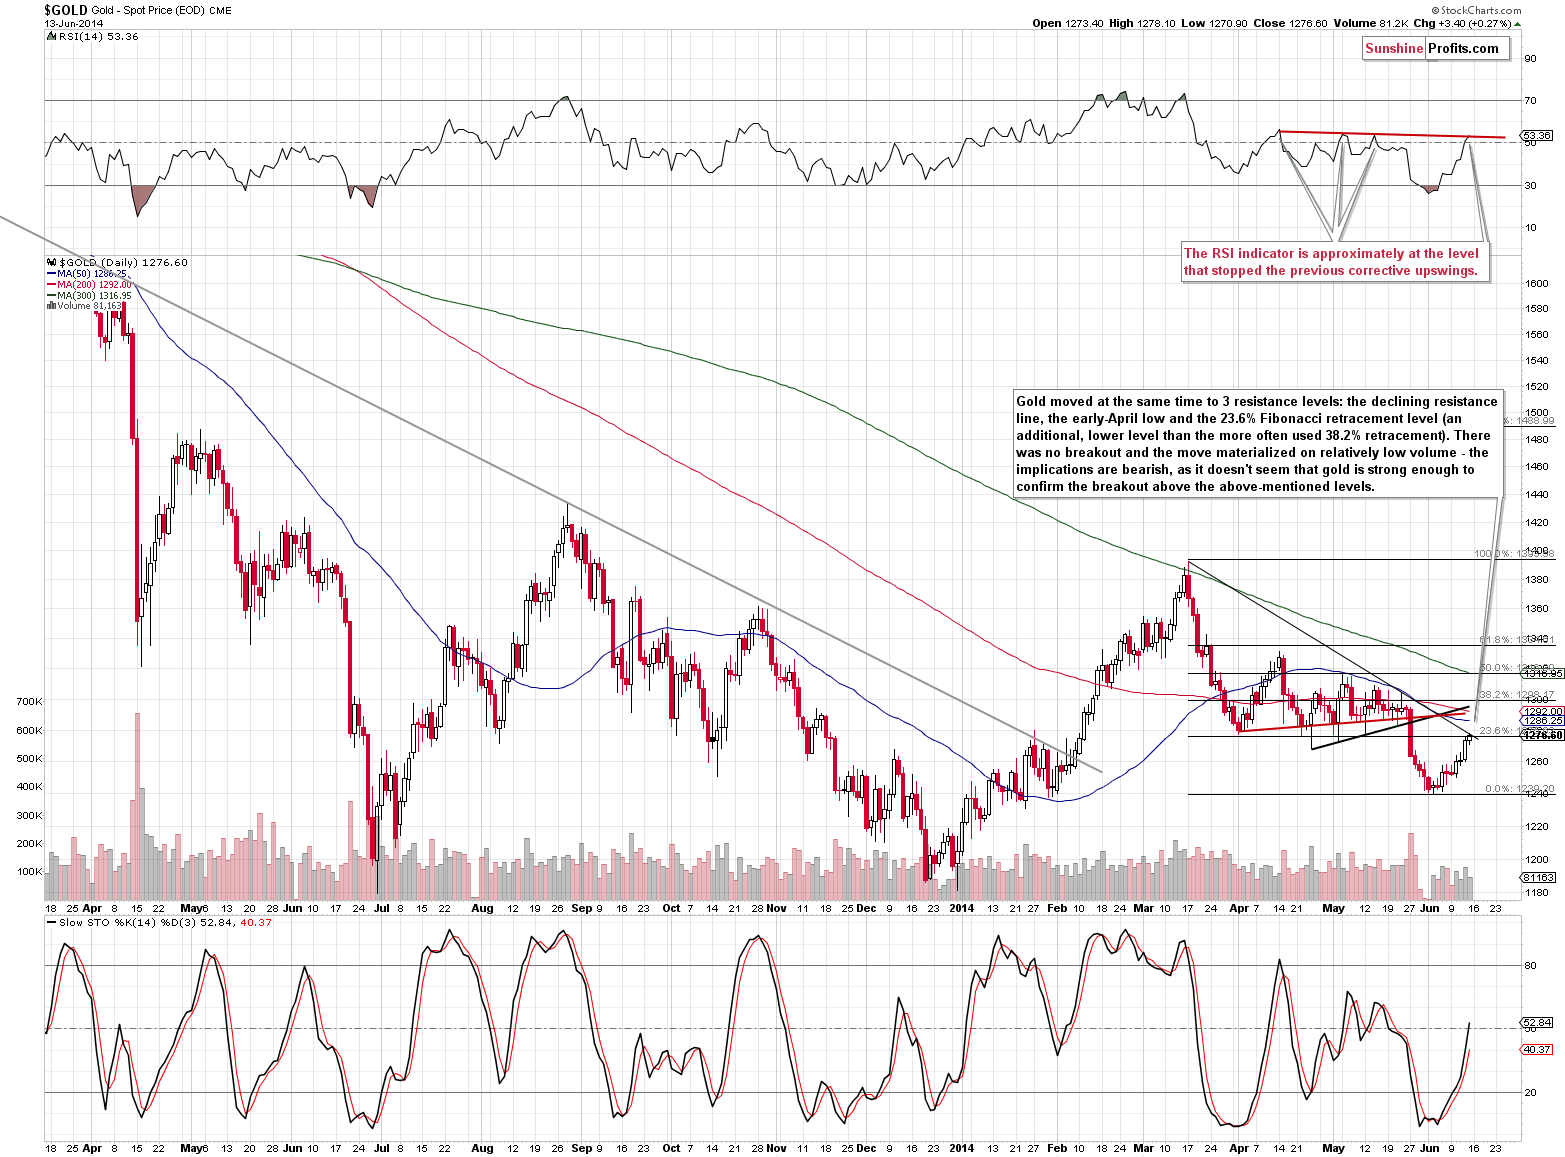
Gold moved a bit lower after we posted the previous alert and in the following hours closed at the above-mentioned declining resistance line. From this perspective there was no breakout and the situation remains unchanged. Please note that gold also reached 2 additional resistance levels at the same time – the 23.6% Fibonacci resistance level and the early April low. At this time it still looks like we’re seeing a corrective upswing, not a beginning of a real really.
We have an additional confirmation of the above from the chart featuring gold priced in the Australian dollar.
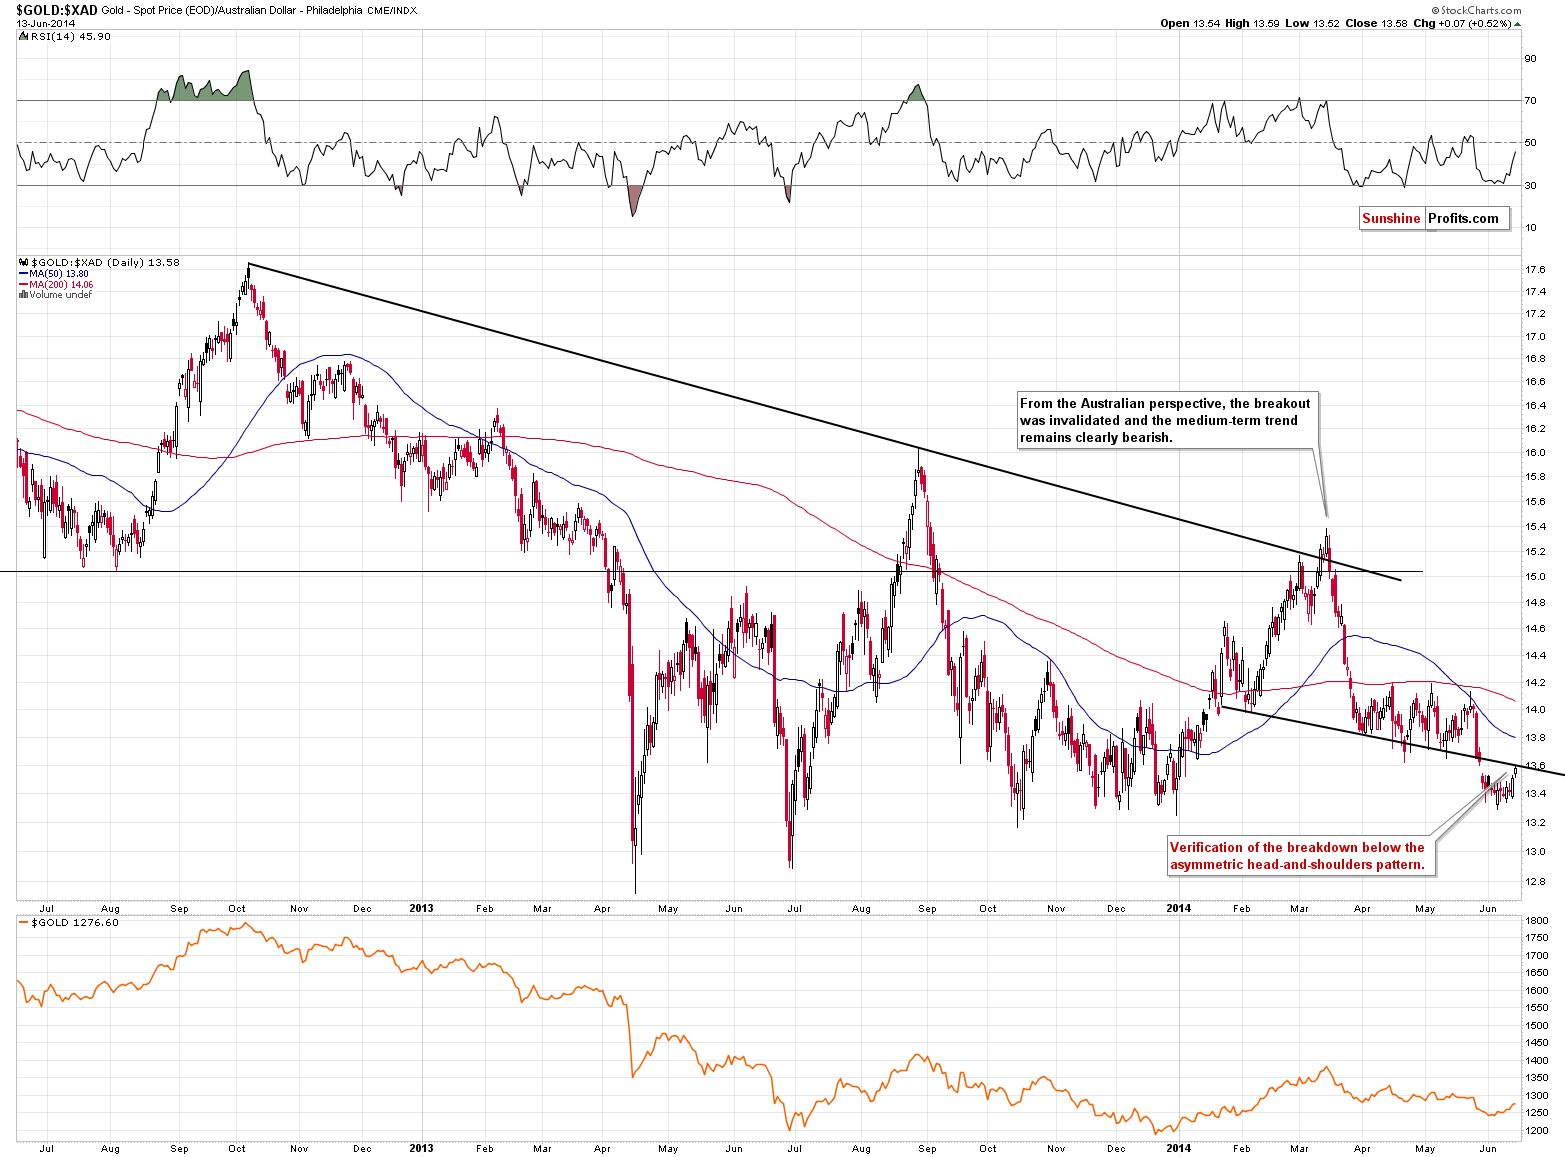
From this perspective, we simply see gold moving back to the previously broken support line, which is also the neck level of the asymmetric head-and-shoulders pattern. There was no invalidation of the breakdown and the implications remain bearish.
All in all, the situation in gold deteriorated slightly because we saw a move higher on relatively low volume, which serves as an indication that the rally is running out of steam.
What about silver?
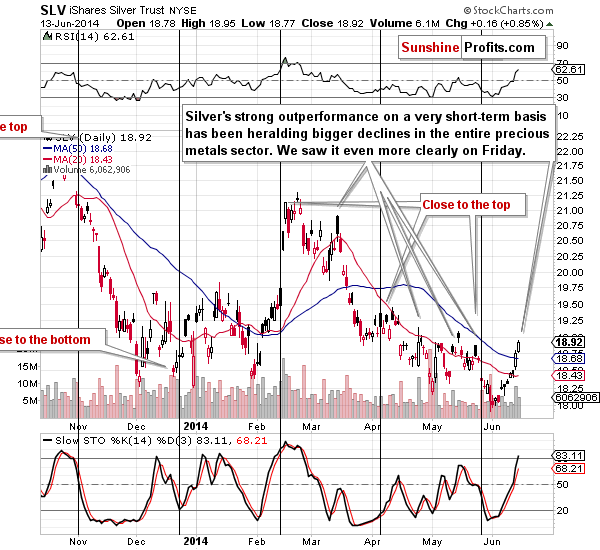
Silver outperformed gold much more visibly than it had during the previous days. At this point quoting Friday’s alert seems appropriate:
Those, who have been following our analysis for some time, know that it’s usually best not to take silver’s strength at face value. In the early years of the current great bull market in the precious metals sector one could say that the “whites lead the yellow” meaning that silver and platinum were showing strength before gold and they indicated another rally (and the same went for mining stocks).
However, that’s not how things have worked in the past months. There has been a different and quite strong short-term relationship in place between silver and gold and its implications are the opposite to these mentioned above. In the past months silver has been outperforming gold on a very short-term basis right before taking another dive. We marked some cases on the above chart – please note that silver usually rallied quickly right before a big decline. These fake moves caught many long-term investors by surprise as that’s exactly the opposite of what one might have expected. Anyway, we definitely saw significant price/volume action yesterday and it’s either a sign of a bigger rally or – as it worked in the vast majority of cases – another fake move that will be followed by declines. We think the latter is much more probable, but we will monitor the market to see any bullish confirmations or something that could invalidate the bearish outlook.
Basically, we once again saw the same signal that we commented on above – only this time the bearish implications are stronger as the short-term outperformance is stronger as well.
Even though we check their performance on daily basis, it’s been some time since we commented on the performance of the silver stocks. Today we will discuss their performance, as it seems they provide some important details.
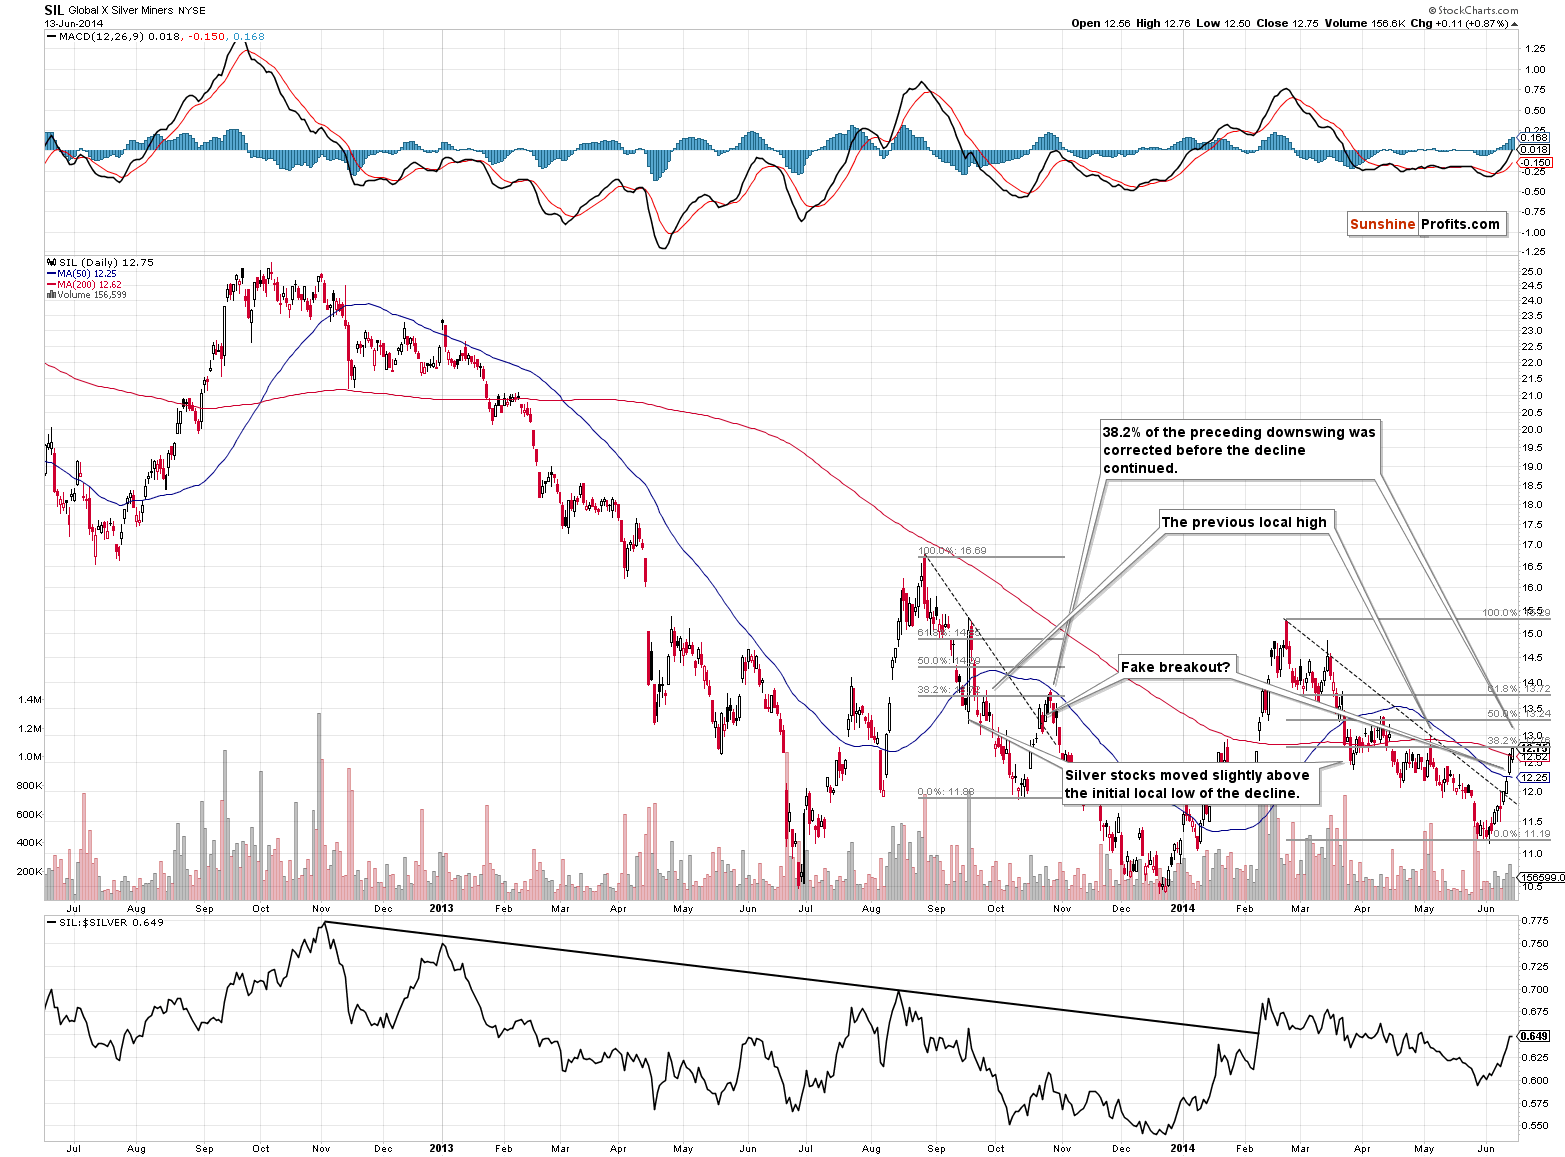
The particularly interesting thing that we can see on the above chart is the similarity between two sizable declines: the August – October one and the February – May one. The size of both declines is similar, as is the fact that both declines were comprised of two smaller declines (the initial ones ended in mid-September, and late March, respectively). In both cases the initial declines took silver stocks a bit below the final Fibonacci retracement based on the entire decline.
The subsequent correction seen in late October took silver miners above the declining resistance line (making investors and traders believe that they had just seen a real breakout), slightly above the initial low and almost right at the 38.2% retracement. The volume was relatively high right after the “breakout” but then declined at the local top.
We can see the things described in the previous paragraph also in case of the current move higher. The “breakout” took place on relatively high volume, which has just declined. We saw a move slightly above the previous local low (seen in late March) and right at the 38.2% retracement. In fact, if the situation really is similar, then we might have just seen a local top or we are very close to one.
All in all, the analysis of silver stocks provides us with bearish implications at this time based on the above-mentioned similarities.
Having said that, let’s turn to mining stocks.
We will once again start by quoting our previous comments:
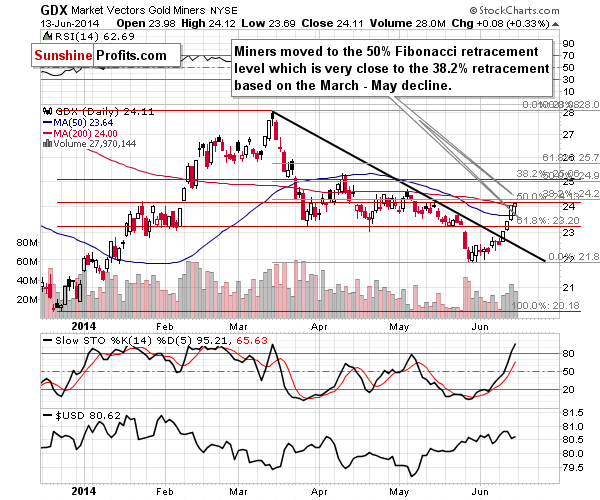
At the first sight the mining stocks’ chart is very bullish. They rallied in the last 3 days and the accompanying volume was relatively high and rising. That’s a bullish combination. However, the rally was likely to take place, based on gold’s previous oversold status, so the fact that we indeed saw a rally, is not necessarily a sign of strength.
We have previously written about the possibility of mining stocks reaching the 50% Fibonacci retracement level and that’s what happened on Friday – nothing unexpected here. We have added an additional retracement (marked in grey) that’s based on the March – May decline – and in this case we saw a move to almost the 38.2% retracement. Still, the most recent rally in mining stocks seems to be a correction, not a new rally just yet – at least the size of the move doesn’t suggest anything more than that. Miners did not outperform gold on Friday. That could have been the reason for some analysts to become bearish or less bullish – remember that you had read about the bearish implications earlier – before the Friday’s session, not after it.
What’s so significant about the last days’ performance is the mining stocks’ strength relative to gold. Let’s examine it more closely starting with the long-term chart.
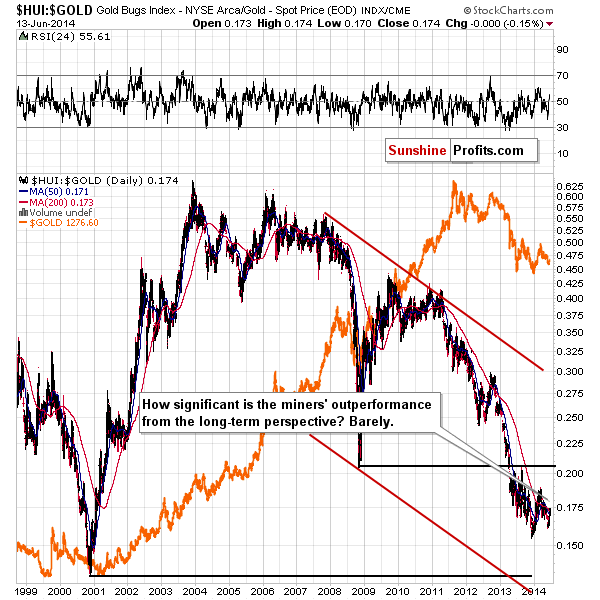
There were basically no changes on the above chart, but it’s so important to keep it in mind that we decided to feature it again also today. Our previous comments remain up-to-date:
What did you see when you looked at the above chart just a second ago? You saw a huge decline with a pause. You might have also seen a decline that doesn’t look like it’s over as it hasn’t stopped at a significant support. That’s exactly what it is. The significant thing is what happened in the second half of 2013 – there was a pullback to the 2008 low and then further declines. The breakdown was verified and the odds for the continuation of the downtrend increased. What happened this week in the HUI to gold ratio – meaning the gold stocks’ performance relative to gold – is not even visible on the above chart. That tells you how much it changes as far as the main trend is concerned – nothing, at least not yet.
The situation hasn’t changed from the short-term point of view, either. What we wrote on Friday remains up-to-date:
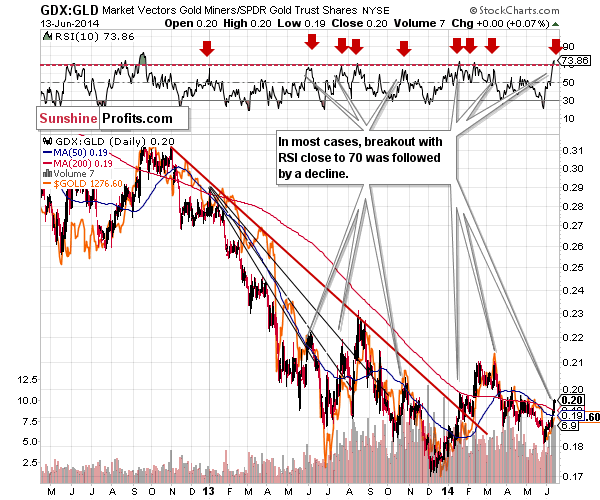
On a short-term basis (we used the GDX ETF as a proxy for the mining stocks this time) the miners’ outperformance is clearly visible, but the implications don’t have to be bullish just yet. The RSI indicator based on the ratio suggests a significantly overbought condition and in fact we just saw a sell signal as the indicator moved above the 70 level.
The way the mining stocks performed relative to gold is very significant. The rally in the GDX to GLD ratio was strong and sharp. With something as visible as that, one might expect it to mean something. We think it does. While in the past, strong performance of the mining stocks relative to gold used to herald more gains, it doesn’t seem to be the case at this time anymore. In most cases, in the past months, the times when the miners to gold ratio rallied particularly strongly – and by that we mean when the RSI indicator moved close to the 70 level – heralded either a consolidation in the precious metals sector, or a decline.
What do we make of all the above? It seems to us that the days of the rally in the precious metals market are numbered. The resistance in case of the GLD ETF is very close, and even though miners rallied quite strongly, they too have a resistance level (50% retracement) that can prevent further gains. Additionally, the extent of the miners’ outperformance suggests that at least a pause is likely.
There are 2 more charts that we would like to comment on before summarizing. The first one features the GDXJ:SPY ratio meaning the juniors’ performance relative to other stocks.
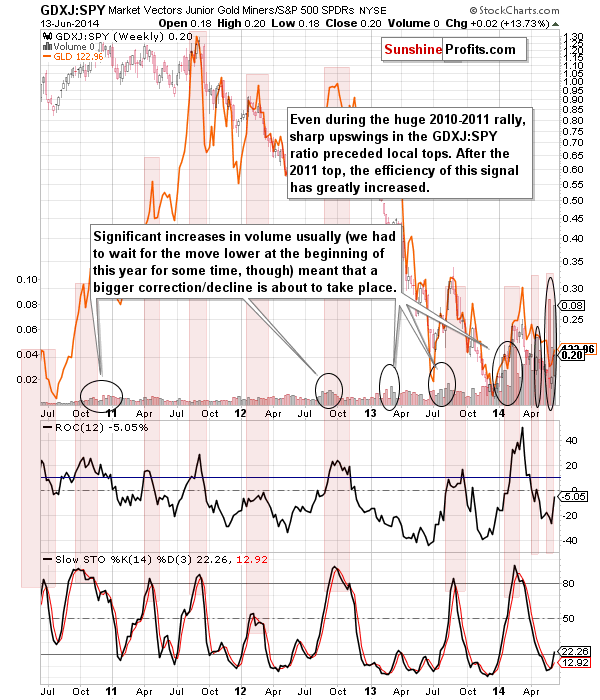
We described the way we look at the above ratio and why we monitor it on a regular basis in the Feb 24 Gold & Silver Trading Alert, so if you haven’t had the chance to read it, we encourage you to do so. The bottom line is that it was very often the case in the past few years that a bigger decline followed after juniors outperformed the general stock market and the ratio of volumes suddenly became huge (we saw a spike). This is not a very short-term sign, so its implications could be delayed – even by a week or so – but still, it was quite reliable many times in the past.
We just saw this bearish signal once again – based on last week’s price/volume action.
The final chart for today features the Euro Index.
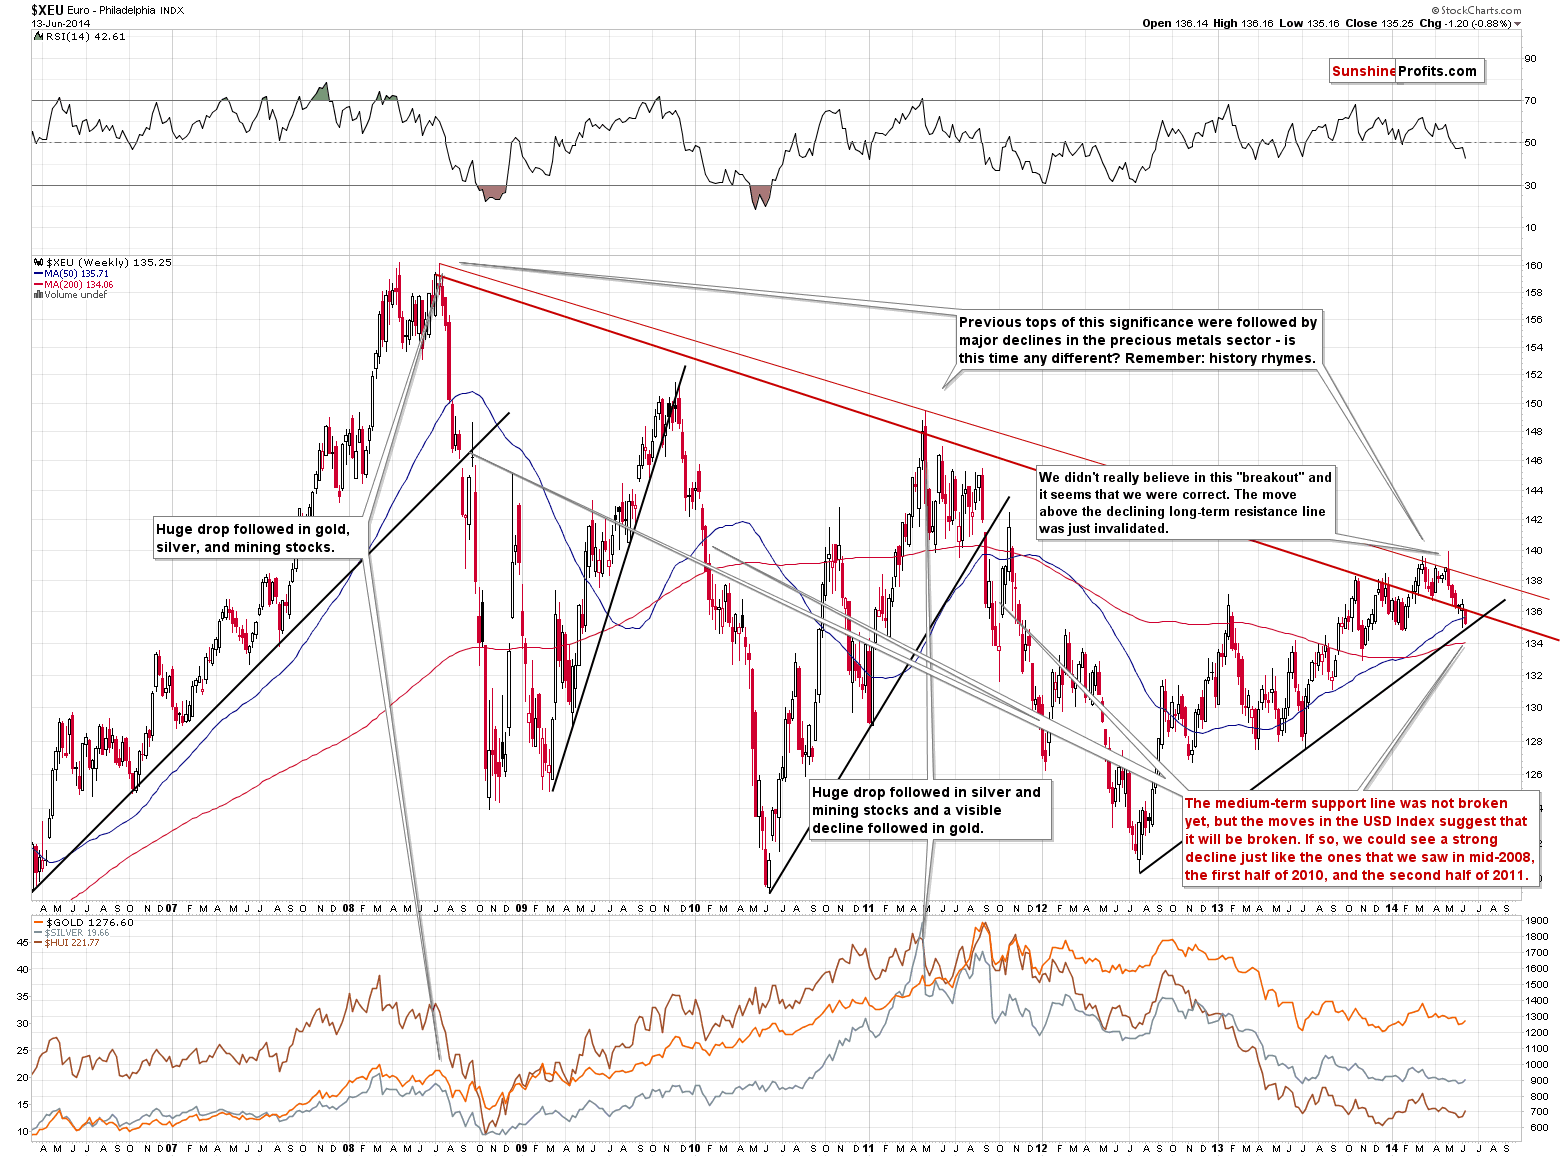
The European currency is at the critical juncture as it’s been declining for several weeks and it’s now very close to the rising medium-term support line. It seems to us that the invalidation of the breakout above the declining very long-term resistance lines was bearish enough to trigger a breakdown below the support line, but we’ll know (almost) for sure once we see the breakdown and it is confirmed.
Once the Euro Index breaks below the rising support line (which seems likely, but not inevitable), we could see a significant and sharp decline similar to the ones we saw in mid-2008, the first half of 2010, and the second half of 2011. Naturally, the implications for the precious metals market of such a significant decline in the Euro Index would be bearish. If the Euro Index does the unlikely thing – shows strength and rallies – precious metals could move higher as well. However, please keep in mind that the outlook for the USD Index is bullish for the medium term, so the odds are that the move in the Euro Index (which tends to move in the opposite direction at almost all times) will indeed be to the downside.
The above chart suggests most of all that we’re likely to see increased volatility in gold in the coming weeks. The second implication is that gold is likely to decline, but that will become much more probable once we see a breakdown in the Euro Index below the rising medium-term support line.
We have previously discussed the “headline factor” and since it continues to impact the precious metals sector, we will quote our comments below:
(…) gold made headlines on finance.yahoo.com yesterday and today and they were positive. The one that we saw previously said “Gundlach: Gold could go to $1,500”, “Gold Set for First Back-to-Back Weekly Gain Since April” and the one that we’re seeing now says “Will gold regain its safe haven status?”. It is usually the case that such headlines attract a lot of people who don’t really believe in the gold market, but are buying it without giving it a second though just to make a quick profit. It has proven to be profitable to generally do the opposite – when everyone thinks that a certain move is going to happen, to do exactly the opposite. At this time it could be the case that everyone who were at least considering buying gold, have already done so and there’s no more buying power left to push prices even higher in the short term.
Summing up, it seems that we are at or quite close to a local top in the precious metals sector. While the medium-term trend in the precious metals market is down, we were likely to see a corrective upswing – and we have. While in the past days it seemed that the corrective upswing was not over yet, we have some signs that it is over now. We have gold at a significant resistance line, we have short-term outperformance in silver, and gold had made the headlines. Miners moved higher relative to gold but after examining the situation more closely it turns out that it’s much less bullish than it seems at first sight.
To summarize:
Trading capital (our opinion): Short positions (half) in gold, silver and mining stocks with the following stop loss orders:
- Gold: $1,306
- Silver: $20.20
- GDX ETF: $25.6
Long-term capital: No positions
Insurance capital: Full position
Please note that a full position doesn’t mean using all of the capital for a given trade. You will find details on our thoughts on gold portfolio structuring in the Key Insights section on our website.
As always, we'll keep you - our subscribers - updated should our views on the market change. We will continue to send out Gold & Silver Trading Alerts on each trading day and we will send additional Alerts whenever appropriate.
The trading position presented above is the netted version of positions based on subjective signals (opinion) from your Editor, and the automated tools (SP Indicators and the upcoming self-similarity-based tool).
As a reminder, Gold & Silver Trading Alerts are posted before or on each trading day (we usually post them before the opening bell, but we don't promise doing that each day). If there's anything urgent, we will send you an additional small alert before posting the main one.
Thank you.
Sincerely,
Przemyslaw Radomski, CFA
Founder, Editor-in-chief
Gold & Silver Trading Alerts
Forex Trading Alerts
Oil Investment Updates
Oil Trading Alerts

