
Briefly: In our opinion no speculative short positions in gold, silver and mining stocks are currently justified from the risk/reward perspective.
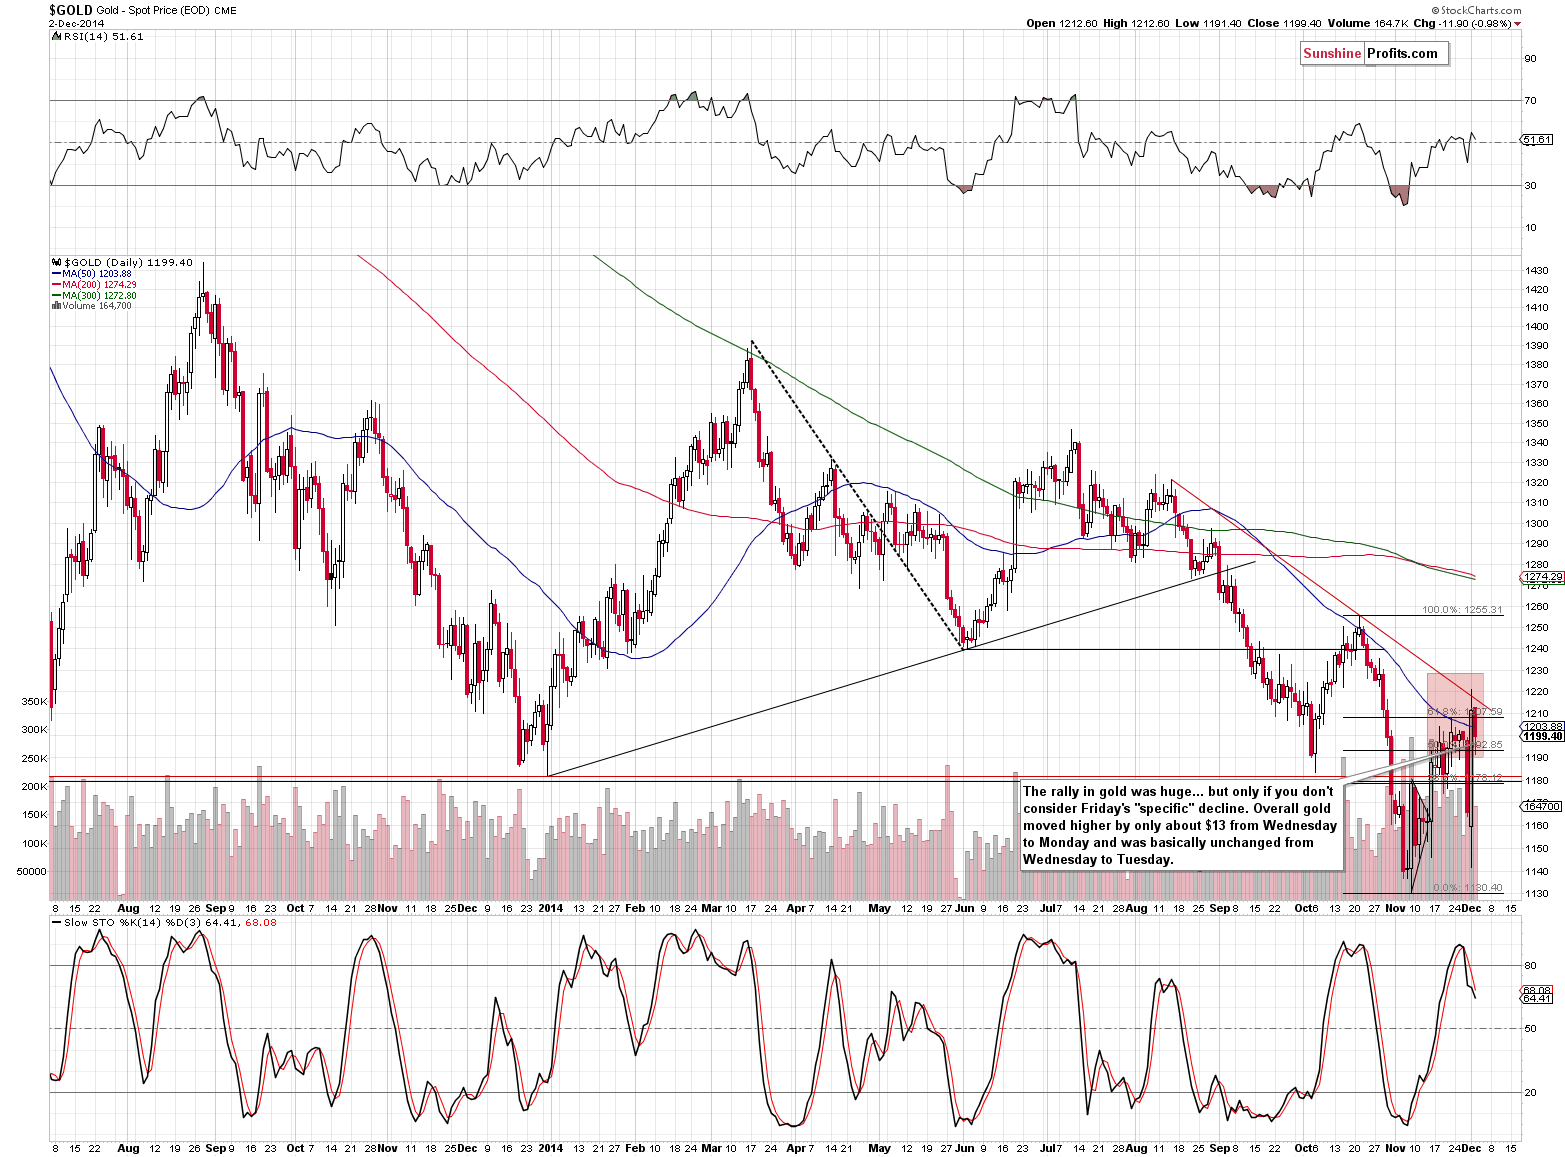
Yesterday, gold closed more or less where it had closed on Wednesday and consequently, the post-Thanksgiving decline-and-comeback action was basically nullified in terms of price. We could see increased volatility in the coming days, though.
If you’ve read yesterday’s update you can safely skip the following quote and move to the charts section, but we invite new subscribers to read our take on what happened on Friday, Monday and yesterday.
In short, it seems that much less changed than it seems at the first sight. Based on Monday’s session and what was happening in yesterday’s trading, it seems that there is a holiday-related explanation that really puts these moves into perspective.
Friday’s session turned out to be less representative of the market participants’ approach toward precious metals than it had seemed based on Friday’s price action alone. Of course, it was not possible to know it before we actually saw the rally on Monday. Based on Friday’s actions we only had breakdowns on huge volume. However, now we have seen a rally on big volume that erased the previous day’s declines – at least in the case of gold. Was there anything specific regarding Friday that could have influenced the trading? Yes. That was the session right after Thanksgiving that was shorter than usually and many market participants were away from their trading desks due to the long weekend.
While we almost never resort to manipulative theories when explaining price moves, it seems that at this time there might have been someone or more traders that pushed the price lower on Friday, knowing that the decline would trigger stop-loss orders in long positions and take the price even lower – which would allow these traders to get back in at lower prices and secure a profit at the expense of those who were long on Friday. We have no proof of this taking place, but that is something that was more likely to happen on Friday than on the previous trading days because this Friday was a part of the long weekend.
The size of the volume that we saw on Friday didn’t suggest the above (it suggested the opposite – served as a confirmation of the bearish move), but taking it into account together with Monday’s big rally makes the above quite probable.
What are the direct implications? There are actually little implications as far as the direction of the next move is concerned. If the above was really behind Friday’s “anomaly”, then we shouldn’t consider the volatile comeback as something really bullish. It was simply something that might happen from time to time and something with which not much can be effectively done (naturally, there are institutions monitoring the market for signs of manipulation, but it’s not an easy thing to prove anything). Please note that these things emerge relatively rarely – the techniques such as breakdowns / breakdowns or watching volume for confirmation are very useful for the vast majority of time.
The thing that has already changed because of that and what may persist for some time is increased volatility. The wide price swings that we saw on Friday and on Monday have probably already attracted many new day-traders to enter the gold market and as they will aim to profit from the volatility, they will also contribute to it. The volatility might wear off if there are no significant moves in the USD Index, but it might take some time. Yesterday’s $10+ decline seems to confirm the above.
What are the indirect implications? It seems that since Friday’s decline was not a “true” move and Monday’s big comeback was not as significant, it will be best to focus on their net effect without considering the extreme low. In other words, instead of thinking about gold’s last 2 trading days as a breakdown and invalidation thereof, we might consider them as… a $13 rally that was more or less canceled on Tuesday). This changes a lot from the technical perspective in many charts. We will keep the above in mind when commenting on the charts in the following part of today’s essay.
Let’s start with the USD Index (charts courtesy of http://stockcharts.com).
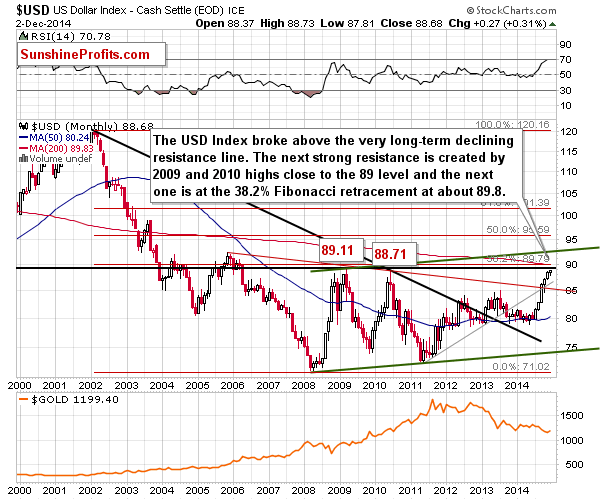
Our previous comments on the long-term USD chart remain up-to-date:
(…) the USD Index could rally to 90 or so before the rally ends or pauses for longer. There are a few resistance levels ahead: the 2010 and 2009 highs at 88.71 and 89.11, and there’s also the 38.2% Fibonacci retracement level right below the 90 level. This means that we could see another over-one-index-point rally in the USD Index shortly.
This means that gold and the rest of the precious metals sector could have another big reason to decline very soon.
The USD Index has moved a bit higher since we wrote the above and at the moment of writing these words it is trading at 88.83, so it’s already above these resistance levels and at this time the potential for a further rally is lower. The USD Index could still rally to 90 or almost to it, but it’s not likely that it would visibly move above it without taking a breather or correcting first.
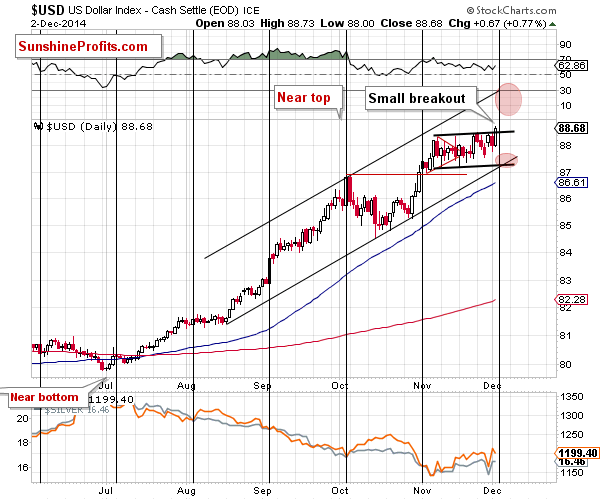
The short-term USD picture is a bit unclear at this time because of yesterday’s small breakout above the flag pattern, which has been followed by another move higher today. Since the turning point is upon us, it could be the case that we will see a reversal and a move lower, to our downside target level, slightly above the 87 level. However, it could also be the case (which is more likely than yesterday, because of the breakout) that USD Index will rally sharply today or in the following days and form a top at or very close to the long-term resistance lines.
Overall, it seems likely that we will see high volatility, but (unfortunately, there’s not much that can be done about it) it’s not clear which short-term direction is more likely. If we see a continuation of the rally here then we will likely see a corrective downswing sooner, and if USD Index corrects to 87 or so before moving higher, then the corrective downswing (from the long-term resistance line) will be seen later on, but not much later.
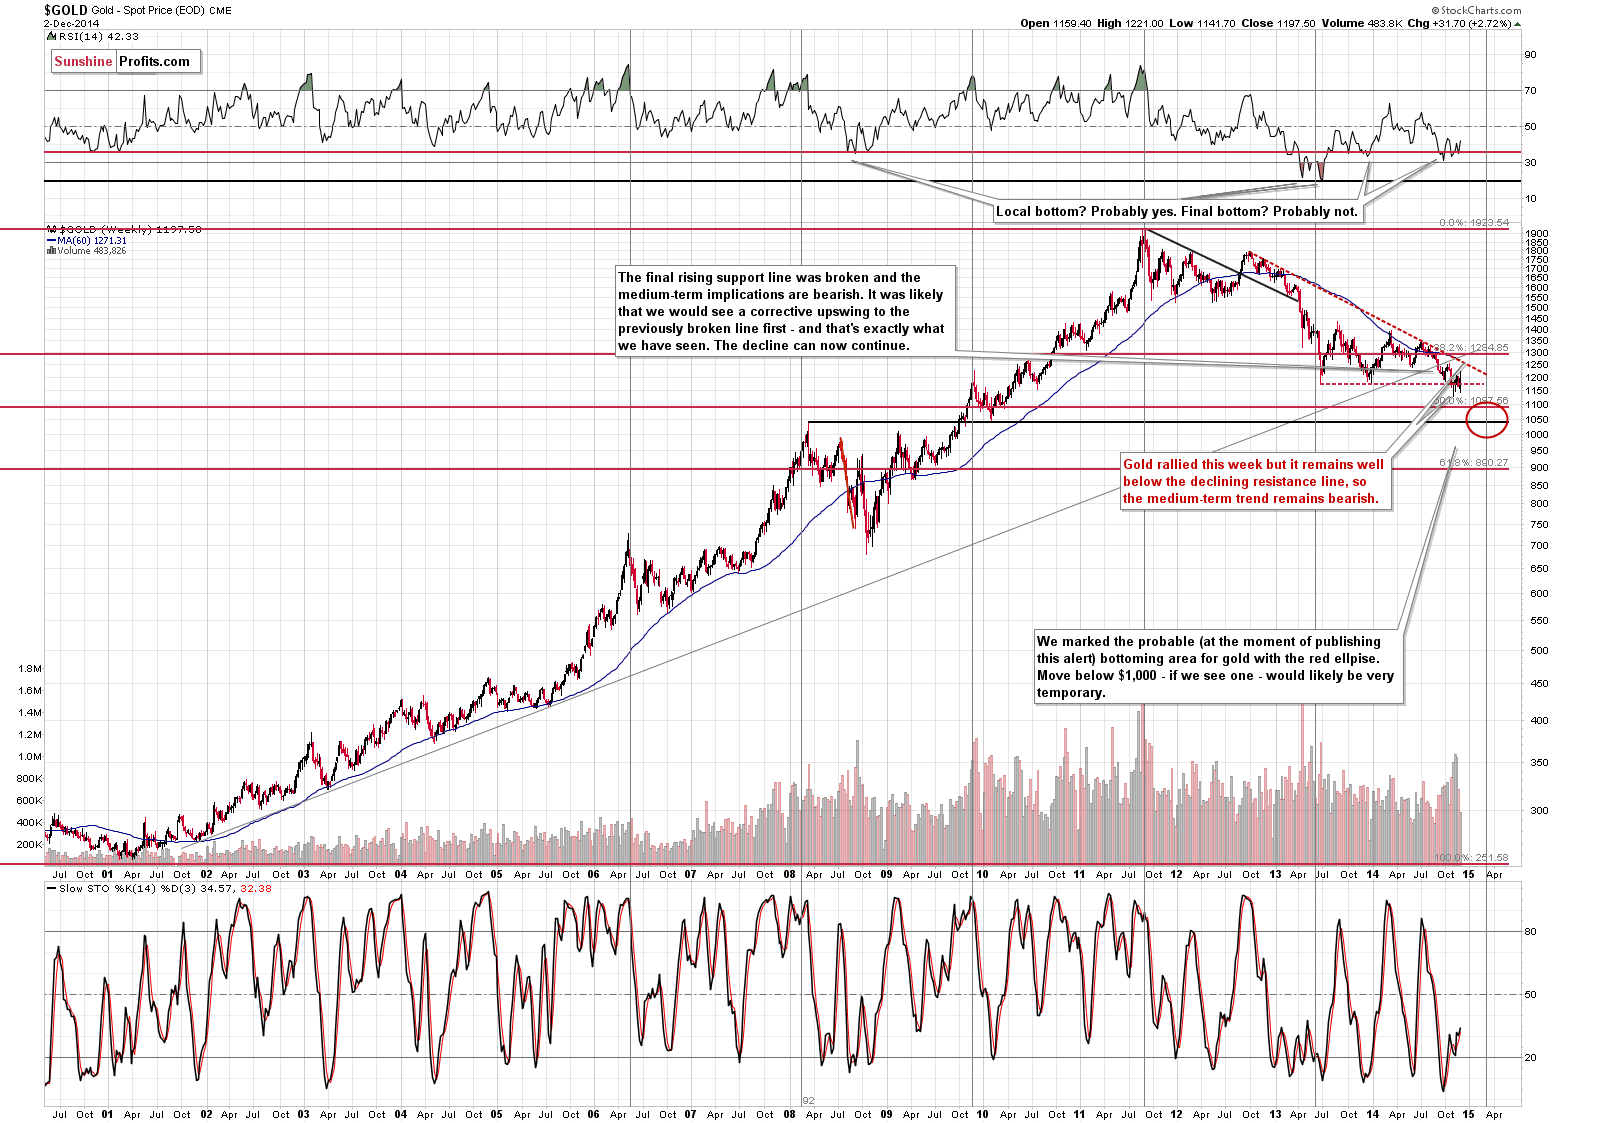
The situation on the long-term chart remains unchanged based on yesterday’s decline:
On the long-term chart, we see that the declining resistance line is well above the current price, so the medium term trend is definitely down. The next big [medium-term] move is still likely to be to the downside.
The above chart emphasizes what we wrote yesterday and quoted earlier today – that the Friday-Tuesday price action overall didn’t change anything. The move above the declining resistance line and the 61.8% Fibonacci retracement level were both invalidated. However, let’s not forget that the USD Index has moved higher since last Wednesday. This means that, on average, gold is not responding to the dollar’s move higher, which is a bullish indication for the short term.
The above is particularly important given the fact that USD Index is likely to move visibly lower either sooner (if we see an additional very short-term rally to the long-term resistance) or later (if we see a small decline and then a rally to the long-term resistance).
Taking both into account, we need to consider the possibility that the next short-term and tradable move in the precious metals sector might be to the upside – once the USD Index reaches the long-term resistance. As always, there are also other factors that will come into play, but based on the USD picture and gold-USD link, we simply need to take the above into account even if the medium-term trend remains down.
The situation in silver doesn’t provide us with additional signs at this time, so we’ll move on to the mining stocks.
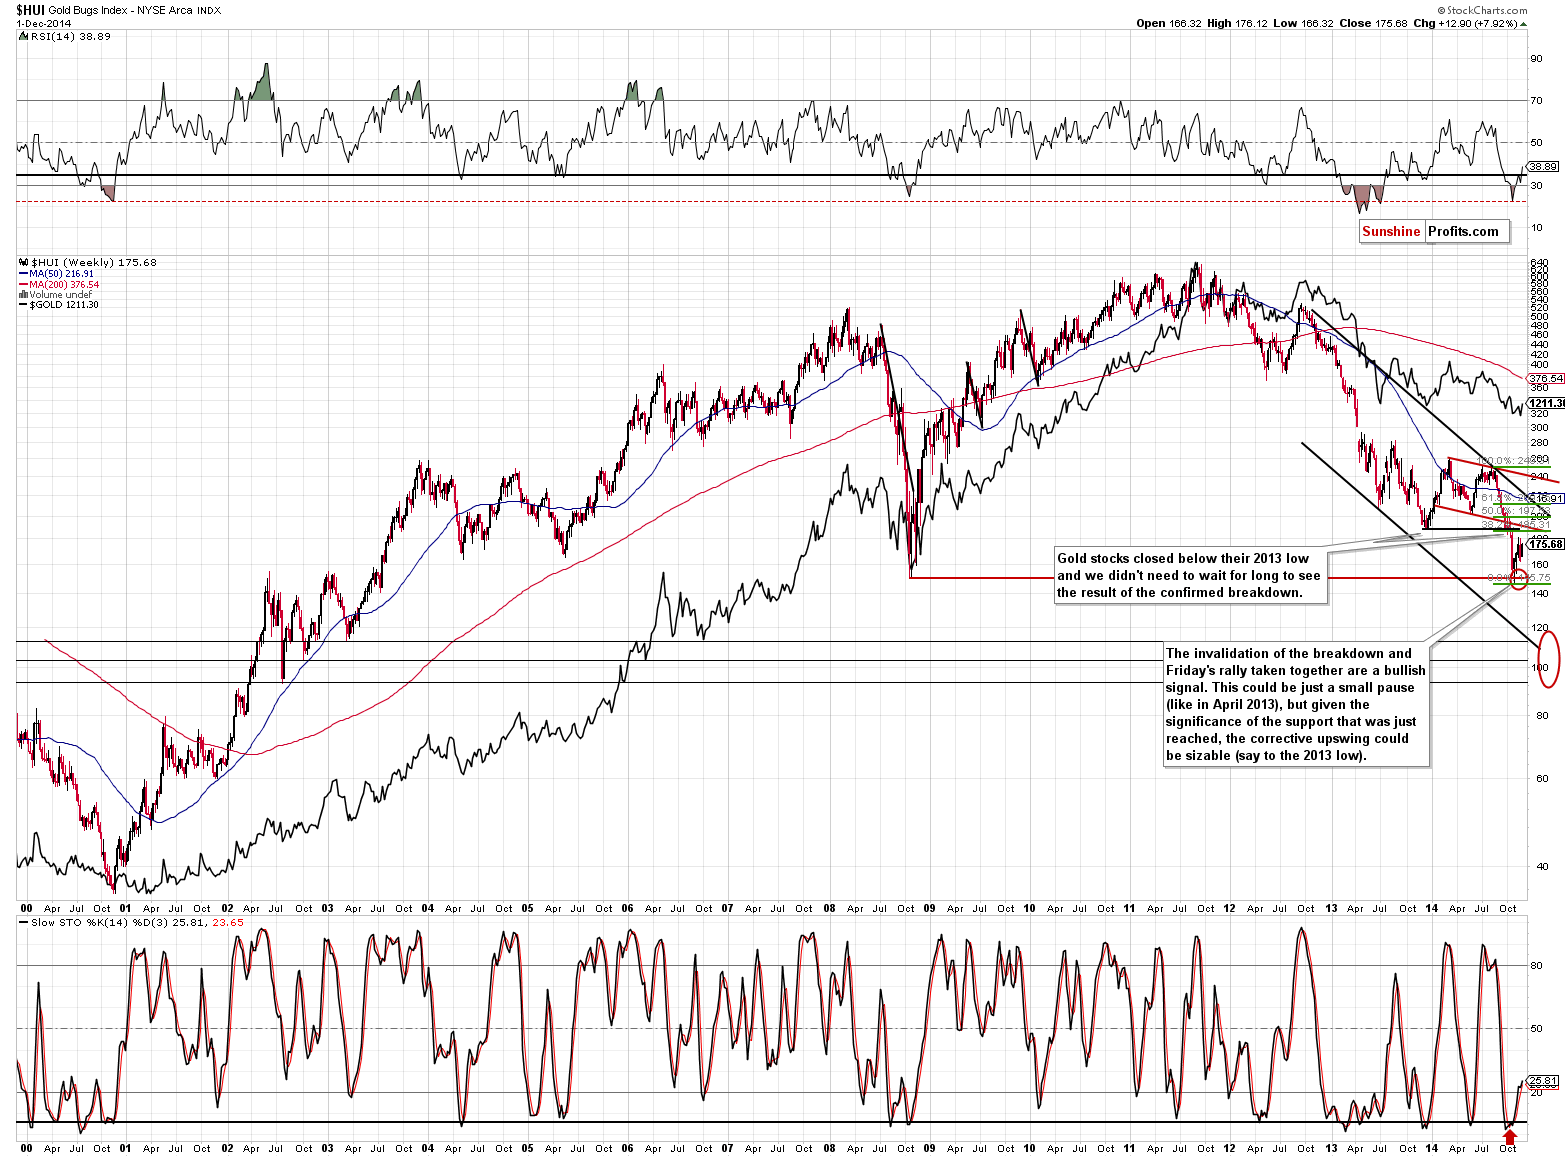
Just as it was the case yesterday, the analysis of gold stocks provides us with a bearish sign. While gold moved higher from Wednesday to Monday by about $13 and it was more or less flat from Wednesday to Tuesday, gold stocks declined by about 1% and 4%, respectively. Gold stocks have underperformed gold, which is a bearish sign.
The resistance level of the 2013 low has not been reached so far, so we could see an additional rally without any change in the medium-term outlook, which remains bearish.
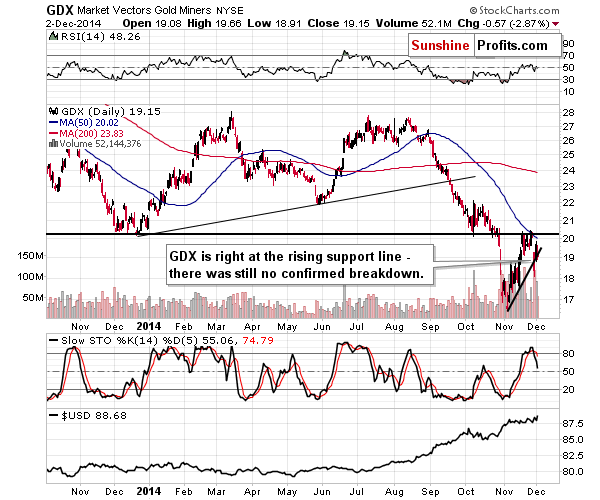
From the short-term point of view, the situation is also unclear as the GDX ETF is right at the rising support line. There was no confirmed breakdown, but a move lower would result in one and have bearish implications.
Summing up, the situation in the precious metals market is unclear at this time. Gold is showing strength (also today) by refusing to decline despite the U.S. dollar’s rally (taking the last week into account), but at the same time gold stocks are underperforming gold, which is a bearish sign for the sector.
With both bullish and bearish signs it seems a good idea to wait for the situation to become clearer before opening any trading position. At this time, we are not ruling out a situation in which the next trade would be to go long, even though the medium-term remains down – but, as mentioned above, it’s not the case at this time. We will be looking for confirmations of both the bullish and bearish case for the short term and when one of them becomes much more likely we will let you – our subscribers – know. One of the things that could change is that miners could start to outperform gold again, or we could see gold starting to react to the dollar’s strength once again. There could be also be other signs, but it’s not possible to list all of them here. We’ll keep you informed.
To summarize:
Trading capital (our opinion): No positions
Long-term capital (our opinion): No positions
Insurance capital (our opinion): Full position
Please note that a full position doesn’t mean using all of the capital for a given trade. You will find details on our thoughts on gold portfolio structuring in the Key Insights section on our website.
As a reminder – “initial target price” means exactly that – an “initial” one, it’s not a price level at which we suggest closing positions. If this becomes the case (like it did in the previous trade) we will refer to these levels as levels of exit orders (exactly as we’ve done previously). Stop-loss levels, however, are naturally not “initial”, but something that, in our opinion, might be entered as an order.
Since it is impossible to synchronize target prices and stop-loss levels for all the ETFs and ETNs with the main markets that we provide these levels for (gold, silver and mining stocks – the GDX ETF), the stop-loss levels and target prices for other ETNs and ETF (among other: UGLD, DGLD, USLV, DSLV, NUGT, DUST, JNUG, JDST) are provided as supplementary, and not as “final”. This means that if a stop-loss or a target level is reached for any of the “additional instruments” (DGLD for instance), but not for the “main instrument” (gold in this case), we will view positions in both gold and DGLD as still open and the stop-loss for DGLD would have to be moved lower. On the other hand, if gold moves to a stop-loss level but DGLD doesn’t, then we will view both positions (in gold and DGLD) as closed. In other words, since it’s not possible to be 100% certain that each related instrument moves to a given level when the underlying instrument does, we can’t provide levels that would be binding. The levels that we do provide are our best estimate of the levels that will correspond to the levels in the underlying assets, but it will be the underlying assets that one will need to focus on regarding the sings pointing to closing a given position or keeping it open. We might adjust the levels in the “additional instruments” without adjusting the levels in the “main instruments”, which will simply mean that we have improved our estimation of these levels, not that we changed our outlook on the markets. We are already working on a tool that would update these levels on a daily basis for the most popular ETFs, ETNs and individual mining stocks.
Our preferred ways to invest in and to trade gold along with the reasoning can be found in the how to buy gold section. Additionally, our preferred ETFs and ETNs can be found in our Gold & Silver ETF Ranking.
As always, we'll keep you - our subscribers - updated should our views on the market change. We will continue to send out Gold & Silver Trading Alerts on each trading day and we will send additional Alerts whenever appropriate.
The trading position presented above is the netted version of positions based on subjective signals (opinion) from your Editor, and the automated tools (SP Indicators and the upcoming self-similarity-based tool).
As a reminder, Gold & Silver Trading Alerts are posted before or on each trading day (we usually post them before the opening bell, but we don't promise doing that each day). If there's anything urgent, we will send you an additional small alert before posting the main one.
=====
Latest Free Trading Alerts:
Bitcoin has gone up in the last couple of days. Is this enough to consider opening longs at this time? Or, maybe there's something different to focus on?
Bitcoin Trading Alert: Is There a Strong Move Around the Corner?
The Reserve Bank of Australia left its benchmark interest rate at a record-low of 2.50%, which pushed the Australian dollar higher against the greenback. As a result, AUD/USD bounced off yesterday’s fresh 2014 low, but will we see further rally?
Forex Trading Alert: AUD/USD Approaches Solid Support
=====
Hand-picked precious-metals-related links:
Harsh words on Swiss gold referendum from von Greyerz
Shanghai Gold Trade Passes Record as China Seeks More Sway
ICE to launch 5 futures contracts for Singapore bourse
Traders fear fresh restrictions on gold imports after government withdraws 80:20 scheme
Platinum market deficit seen at 885,000 oz in 2014 - WPIC
Harmony Gold cutting jobs at S. African mine to turn around operation
10% mining royalty is Guatemala’s stealth solution to budget crisis
=====
In other news:
Fed says 'no inflation' but middle class reality says otherwise
Fall of the Bond King: How Gross Lost Empire as Pimco Cracked
The great distortion? Draghi's options on QE
Czech central banker: We need ECB easing
Is Moldova the next Crimea? Russia is worried
=====
Thank you.
Sincerely,
Przemyslaw Radomski, CFA
Founder, Editor-in-chief
Gold & Silver Trading Alerts
Forex Trading Alerts
Oil Investment Updates
Oil Trading Alerts

