

Briefly: In our opinion, a speculative short position (full) in gold, silver and mining stocks is justified from the risk/reward point of view.
The previous week was quite rich in various developments. They didn’t emerge all at once – instead, the market provided us with additional signals and confirmations each day. The most recent one is the breakdown in the HUI Index. What are the implications of this important development?
In short, it further confirms the bearish outlook for the precious metals sector. Before we move on to the HUI Index and explain below what it just broke, let’s once again discuss the signal coming from the ratio between juniors and the general stock market. Let’s take a look at the chart (charts courtesy of http://stockcharts.com).
The reason that we’re featuring the above signal once again is that it is now even more significant as we’ve seen it also based on the weekly closing prices. Our previous comments remain up-to-date:
There was a signal that was followed by the same thing in each case since 2012 and we have just seen it once again.
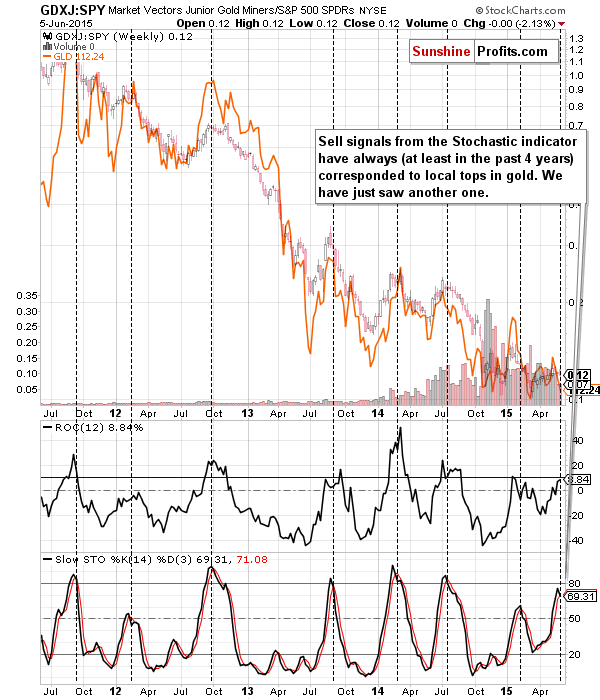
The above chart features junior mining stocks’ performance relative to the performance of the general stock market. This ratio moves quite in tune with gold, as when we take out the link between juniors and other stocks, the main driver of their prices is the underlying metal (either gold or another metal that moves in tune with gold anyway). The bottom line is that since this ratio moves in line with gold (but slightly differently) it can be used as a confirmation of gold’s moves.
The way that we can use the above knowledge is to apply the Stochastic indicator to the ratio. In each (!) case when the Stochastic indicator flashed a sell signal it was either at or close to a major top. If gold was moving higher before this signal it suggested that the top is about to be formed and if gold was moving lower before the signal, it confirmed that the top was indeed formed. We have just seen this little-known but very accurate signal and the implications are very bearish.
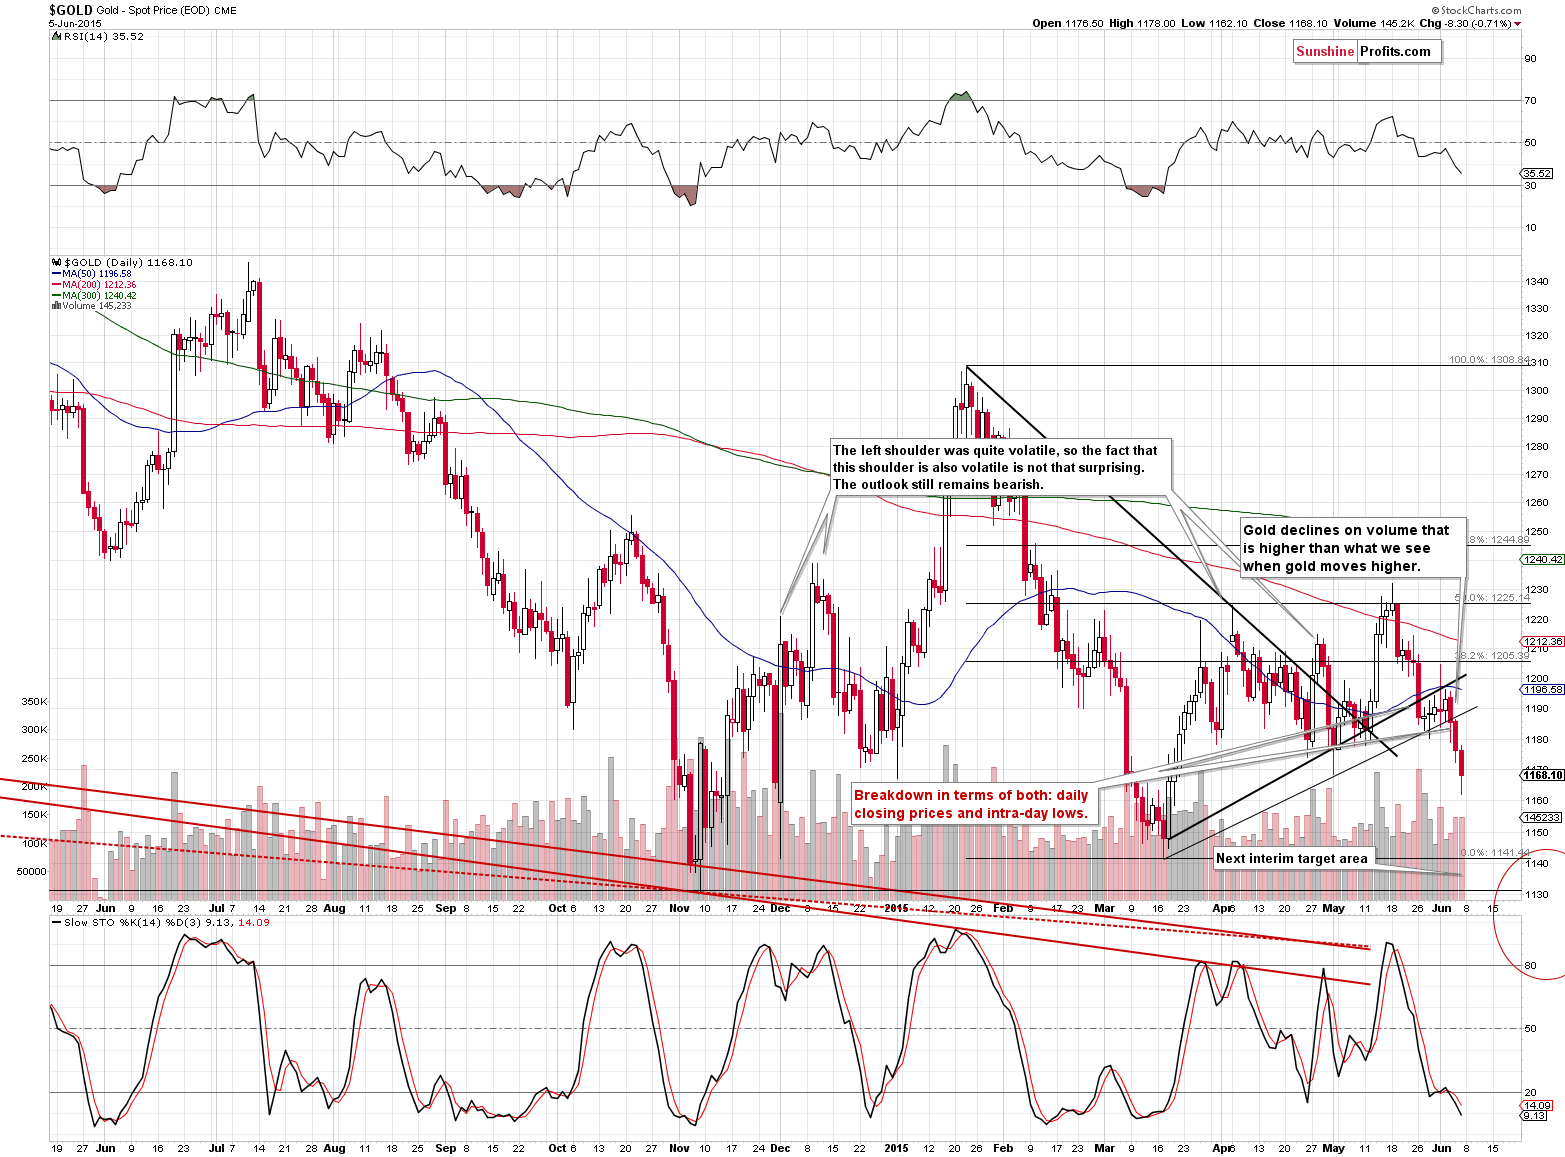
Gold declined once again and moved even further below the rising support line based on the intra-day lows. We haven’t seen a third close below this line, but we saw a second one, which was also the weekly close, and we think that’s enough to view the breakdown as confirmed. The implications are bearish – more bearish than they were before the breakdown’s confirmation.
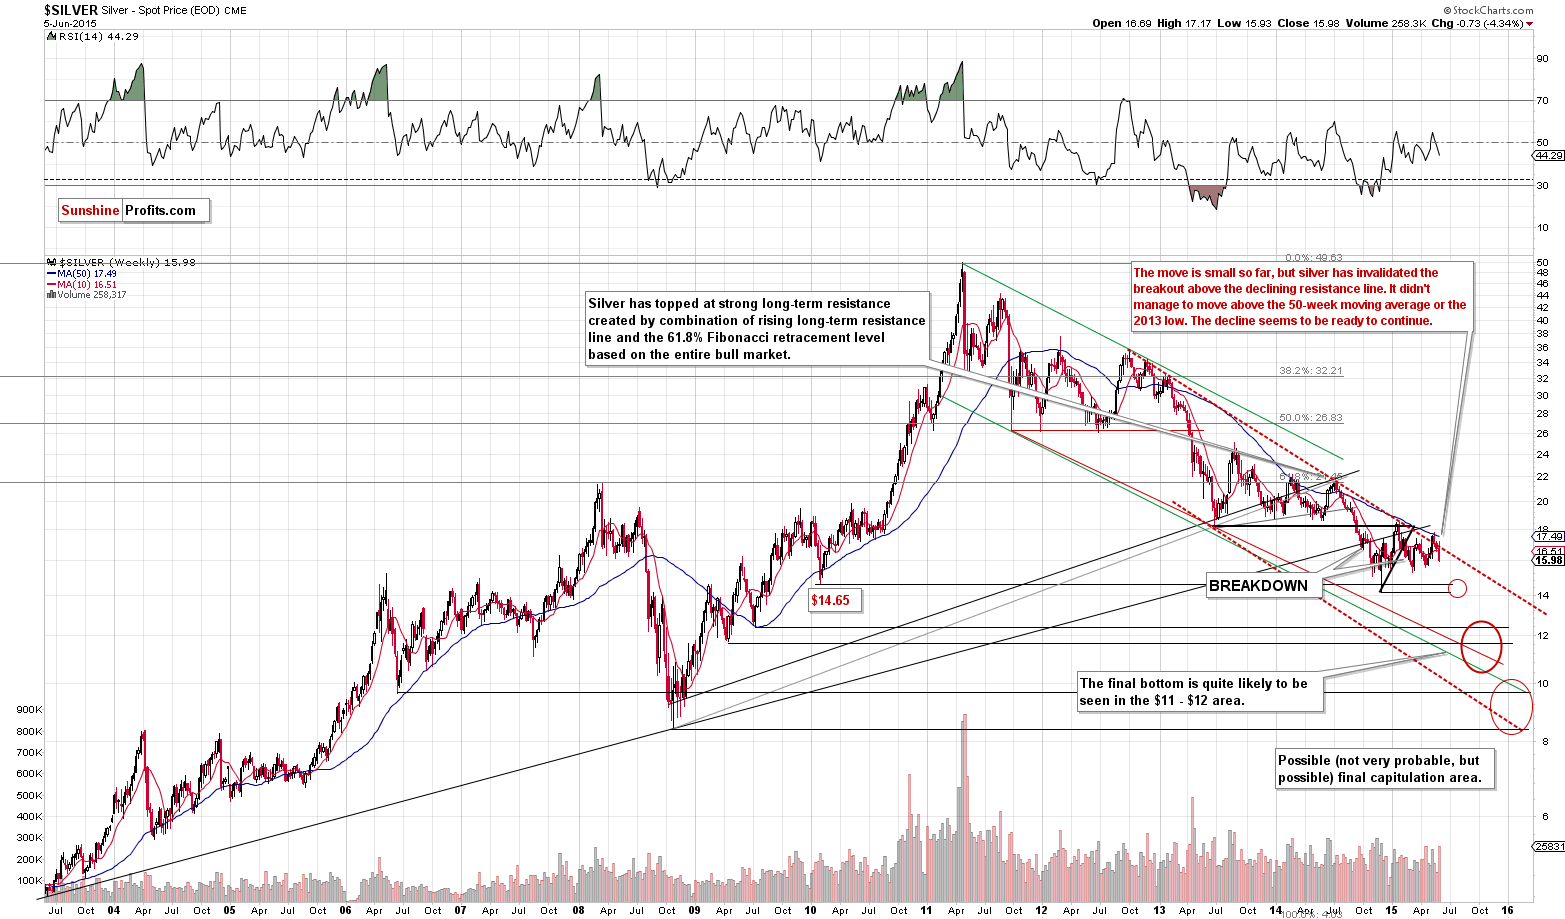
Silver didn’t do much on Friday, but the lack of action is actually bearish, as it resulted in a weekly close well below the declining resistance line. If anyone had any doubts about the breakout’s invalidation, it should now be clear that the breakout was indeed clearly invalidated, which by itself is a very bearish sign for the next several weeks. We might still see a short-term bounce, but we think that if we see one, it will be short-lived.
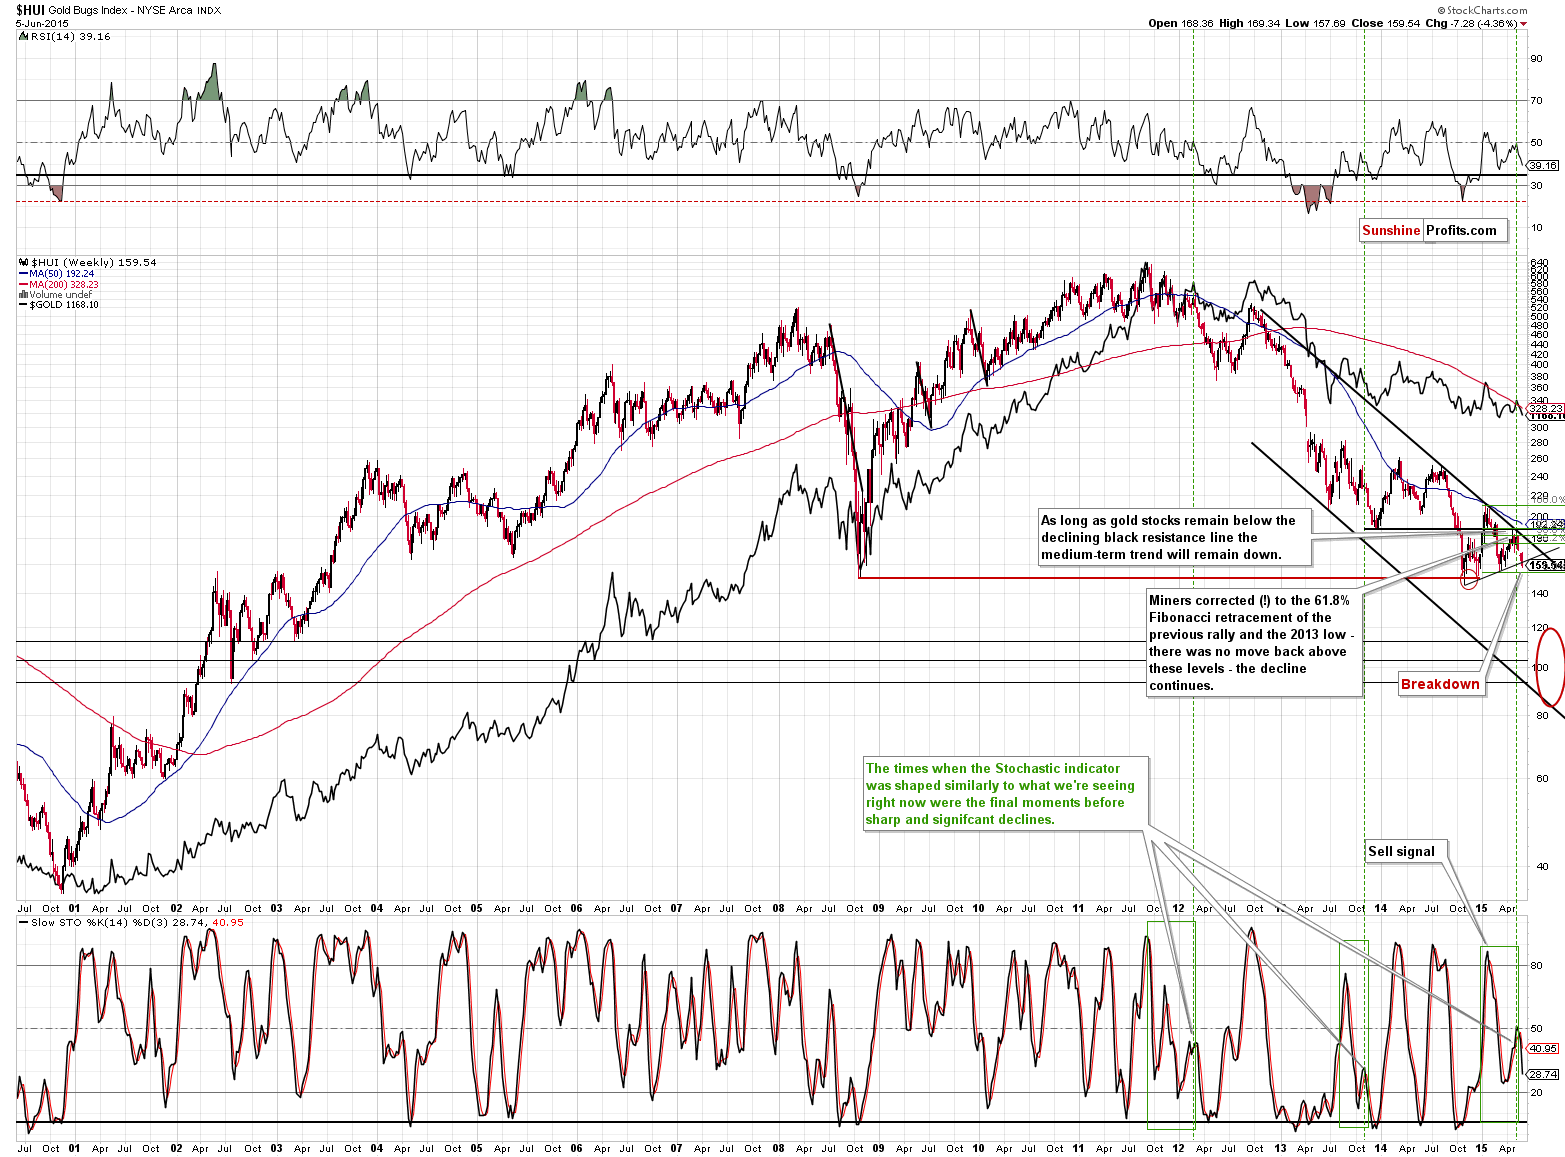
As mentioned earlier today, gold stocks have broken below a certain support level. This level is created by the rising line based on the 2014 low and the March 2015 low. The breakdown is not confirmed, but a weekly close below the support is quite a bearish development on its own even if it doesn’t imply a confirmation of the breakdown.
Speaking of weekly closing prices, the interesting fact is that there was only 1 time in the past years when the HUI closed the week below the level at which it closed on Friday – in October 2014. The previous time when the HUI closed the week lower was back in… July 2003. That’s right – more than 10 years ago. It surely seems that entering short positions several weeks ago and remaining out of the mining stocks sector with the long-term investment capital was and still is a good idea.
Our previous comments on the above chart remain up-to-date as well:
The sell signal from the Stochastic indicator is now clearly visible and the link between the current situation and the previous 2 cases when we saw a very similar pattern is strong. The implications are very bearish as both previous cases were followed by substantial declines.
Before we summarize today’s alert, we would like to move back to the silver market and discuss the very long-term cycles that are present in this market.
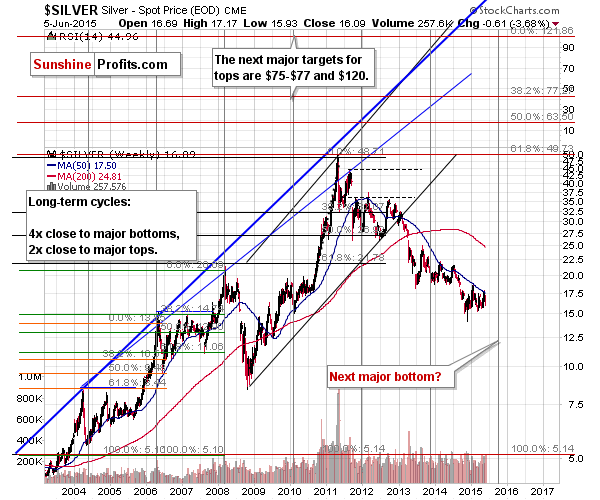
It’s been quite a long time since we previously featured the above chart, but the upside price targets that we described in it remain up-to-date – however, it doesn’t seem likely that they will be achieved before we see another sharp decline in the price of the white metal.
As we wrote previously, we expect the final bottom to be seen sometime during the fall of this year, probably in the October – November time frame. We would not be very surprised to see it in the final part of the summer or early in 2016, but it seems that the fall of this year is most likely to be the time when the medium-term trend changes. We based this on the trend lines, their pace of decline, shapes of the previous declines (history tends to repeat itself) and the proximity of various support levels. The above chart provides an additional confirmation – the very long-term turning point confirms the above-mentioned time target. Please note that in most cases these turning points marked bottoms, so it’s more likely than not that the upcoming turning point will also mean a bottom.
Please note that the above chart also emphasizes that the downtrend remains in place – the 50-week moving average served as support and resistance multiple times in the past and at this time silver remains below it. There was basically no confirmed breakout above this moving average since 2011, so it seems that it’s a quite reliable estimator of the current trend – and it remains down.
The implications are very bearish for the medium term.
Before summarizing, let’s take a look at the True Seasonal patterns to see what’s likely in store for us in the short term.
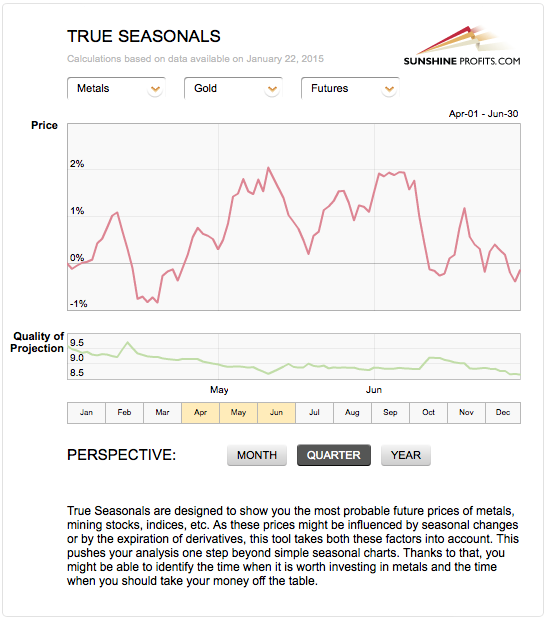
June tends to be a quite bearish month for gold and the rest of the precious metals sector, especially the part of the month that we are just about to enter. Gold has already been declining for days, but it seems that the declines are far from being over (even if we see a temporary bounce, it likely to be short-lived).
Overall, we can summarize the situation in the precious metals market in the same way as we did on Friday:
Summing up, the outlook for the precious metals market was bearish on Friday and after Friday’s session it became – once again - even more bearish. It seems that the final bottom is still ahead of us.
The current short positions in the precious metals sector are profitable (and more profitable than they were on Friday), but it seems that they will become much more profitable in the future, so we are keeping them intact.
We will keep you – our subscribers – updated.
To summarize:
Trading capital (our opinion): Short (full position) position in gold, silver and mining stocks is justified from the risk/reward perspective with the following stop-loss orders and initial (!) target prices:
- Gold: initial target price: $1,115; stop-loss: $1,253, initial target price for the DGLD ETN: $87.00; stop loss for the DGLD ETN $63.78
- Silver: initial target price: $15.10; stop-loss: $18.13, initial target price for the DSLV ETN: $67.81; stop loss for DSLV ETN $38.44
- Mining stocks (price levels for the GDX ETN): initial target price: $16.63; stop-loss: $21.83, initial target price for the DUST ETN: $23.59; stop loss for the DUST ETN $10.37
In case one wants to bet on lower junior mining stocks' prices, here are the stop-loss details and initial target prices:
- GDXJ: initial target price: $21.17; stop-loss: $28.68
- JDST: initial target price: $14.35; stop-loss: $5.65
Long-term capital (our opinion): No positions
Insurance capital (our opinion): Full position
Please note that a full position doesn’t mean using all of the capital for a given trade. You will find details on our thoughts on gold portfolio structuring in the Key Insights section on our website.
As a reminder – “initial target price” means exactly that – an “initial” one, it’s not a price level at which we suggest closing positions. If this becomes the case (like it did in the previous trade) we will refer to these levels as levels of exit orders (exactly as we’ve done previously). Stop-loss levels, however, are naturally not “initial”, but something that, in our opinion, might be entered as an order.
Since it is impossible to synchronize target prices and stop-loss levels for all the ETFs and ETNs with the main markets that we provide these levels for (gold, silver and mining stocks – the GDX ETF), the stop-loss levels and target prices for other ETNs and ETF (among other: UGLD, DGLD, USLV, DSLV, NUGT, DUST, JNUG, JDST) are provided as supplementary, and not as “final”. This means that if a stop-loss or a target level is reached for any of the “additional instruments” (DGLD for instance), but not for the “main instrument” (gold in this case), we will view positions in both gold and DGLD as still open and the stop-loss for DGLD would have to be moved lower. On the other hand, if gold moves to a stop-loss level but DGLD doesn’t, then we will view both positions (in gold and DGLD) as closed. In other words, since it’s not possible to be 100% certain that each related instrument moves to a given level when the underlying instrument does, we can’t provide levels that would be binding. The levels that we do provide are our best estimate of the levels that will correspond to the levels in the underlying assets, but it will be the underlying assets that one will need to focus on regarding the sings pointing to closing a given position or keeping it open. We might adjust the levels in the “additional instruments” without adjusting the levels in the “main instruments”, which will simply mean that we have improved our estimation of these levels, not that we changed our outlook on the markets. We are already working on a tool that would update these levels on a daily basis for the most popular ETFs, ETNs and individual mining stocks.
Our preferred ways to invest in and to trade gold along with the reasoning can be found in the how to buy gold section. Additionally, our preferred ETFs and ETNs can be found in our Gold & Silver ETF Ranking.
As always, we'll keep you - our subscribers - updated should our views on the market change. We will continue to send out Gold & Silver Trading Alerts on each trading day and we will send additional Alerts whenever appropriate.
The trading position presented above is the netted version of positions based on subjective signals (opinion) from your Editor, and the Tools and Indicators.
As a reminder, Gold & Silver Trading Alerts are posted before or on each trading day (we usually post them before the opening bell, but we don't promise doing that each day). If there's anything urgent, we will send you an additional small alert before posting the main one.
=====
Latest Free Trading Alerts:
S&P 500 remained below the level of 2,100 on Friday, as it extended its short-term downtrend. Will this move down continue?
=====
Hand-picked precious-metals-related links:
Silver manipulation? First Majestic question CFTC
Gold ETFs record outflow for 24th straight month in May
=====
In other news:
IMF official warns of market disorder from Fed rate hike
HSBC shake-up: What you need to know
Experts worry that 'phony numbers' are misleading investors
=====
Thank you.
Sincerely,
Przemyslaw Radomski, CFA
Founder, Editor-in-chief
Gold & Silver Trading Alerts
Forex Trading Alerts
Oil Investment Updates
Oil Trading Alerts

