
Briefly: In our opinion no speculative short positions in gold, silver and mining stocks are currently justified from the risk/reward perspective.
Gold, silver and mining stocks invalidated last week’s breakdown and they did so in a very profound way. Gold rallied over $40, silver rallied $1 and miners moved higher by more than 7%. If this was not exciting enough, the precious metals sector is declining significantly today in pre-market trading. Something seems to be very different about the metals’ and miners’ performance in the last several days when one compares it with the previous months. Was the final bottom just formed?
In short, it seems that much less changed than it seems at the first sight. Based on yesterday’s session and what’s happening in today’s pre-market trading, it seems that there is a holiday-related explanation that really puts these moves into perspective.
Friday’s session turned out to be less representative of the market participants’ approach toward precious metals than it had seemed based on Friday’s price action alone. Of course, it was not possible to know it before we actually saw the rally yesterday. Based on Friday’s actions we only had breakdowns on huge volume. However, now we have seen a rally on big volume that erased the previous day’s declines – at least in the case of gold. Was there anything specific regarding Friday that could have influenced the trading? Yes. That was the session right after Thanksgiving that was shorter than usually and many market participants were away from their trading desks due to the long weekend.
While we almost never resort to manipulative theories when explaining price moves, it seems that at this time there might have been someone or more traders that pushed the price lower on Friday, knowing that the decline would trigger stop-loss orders in long positions and take the price even lower – which would allow these traders to get back in at lower prices and secure a profit at the expense of those who were long on Friday. We have no proof of this taking place, but that is something that was more likely to happen on Friday than on the previous trading days because this Friday was a part of the long weekend.
The size of the volume that we saw on Friday didn’t suggest the above (it suggested the opposite – served as a confirmation of the bearish move), but taking it into account together with Monday’s big rally makes the above quite probable.
What are the direct implications? There are actually little implications as far as the direction of the next move is concerned. If the above was really behind Friday’s “anomaly”, then we shouldn’t consider the volatile comeback as something really bullish. It was simply something that might happen from time to time and something with which not much can be effectively done (naturally, there are institutions monitoring the market for signs of manipulation, but it’s not an easy thing to prove anything). Please note that these things emerge relatively rarely – the techniques such as breakdowns / breakdowns or watching volume for confirmation are very useful for the vast majority of time.
The thing that has already changed because of that and what may persist for some time is increased volatility. The wide price swings that we saw on Friday and yesterday have probably already attracted many new day-traders to enter the gold market and as they will aim to profit from the volatility, they will also contribute to it. The volatility might wear off if there are no significant moves in the USD Index, but it might take some time. Today’s pre-market $10+ decline seems to confirm the above.
What are the indirect implications? It seems that since Friday’s decline was not a “true” move and Monday’s big comeback was not as significant, it will be best to focus on their net effect without considering the extreme low. In other words, instead of thinking about gold’s last 2 trading days as a breakdown and invalidation thereof, we might consider them as… a $13 rally (something that was more or less canceled in today’s pre-market trading). This changes a lot from the technical perspective in many charts. We will keep the above in mind when commenting on the charts in the following part of today’s essay.
Let’s start with the USD Index (charts courtesy of http://stockcharts.com).
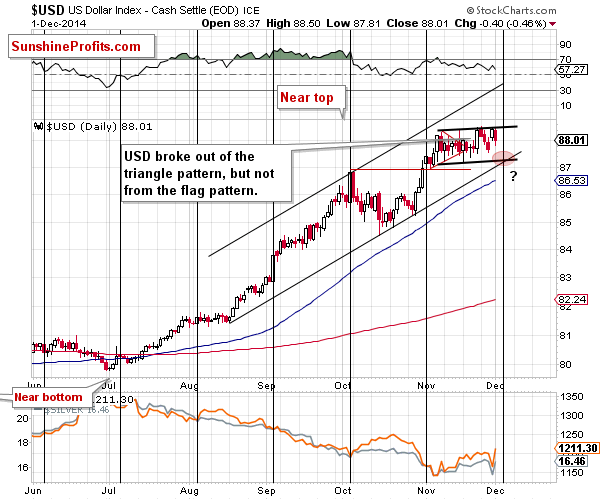
The cyclical turning point is just around the corner, and there has been no breakout above the flag pattern. If we are to see a turnaround at the turning point, then it seems that another decline and a bottom in the next few days is more likely than a breakout and a sharp move higher. This is the case as there was no breakout and the continuation of the pattern is more likely. While the USD Index seemed to be repeating its late-October – November rally, the decreased pace of growth in the last several days made this scenario less probable.
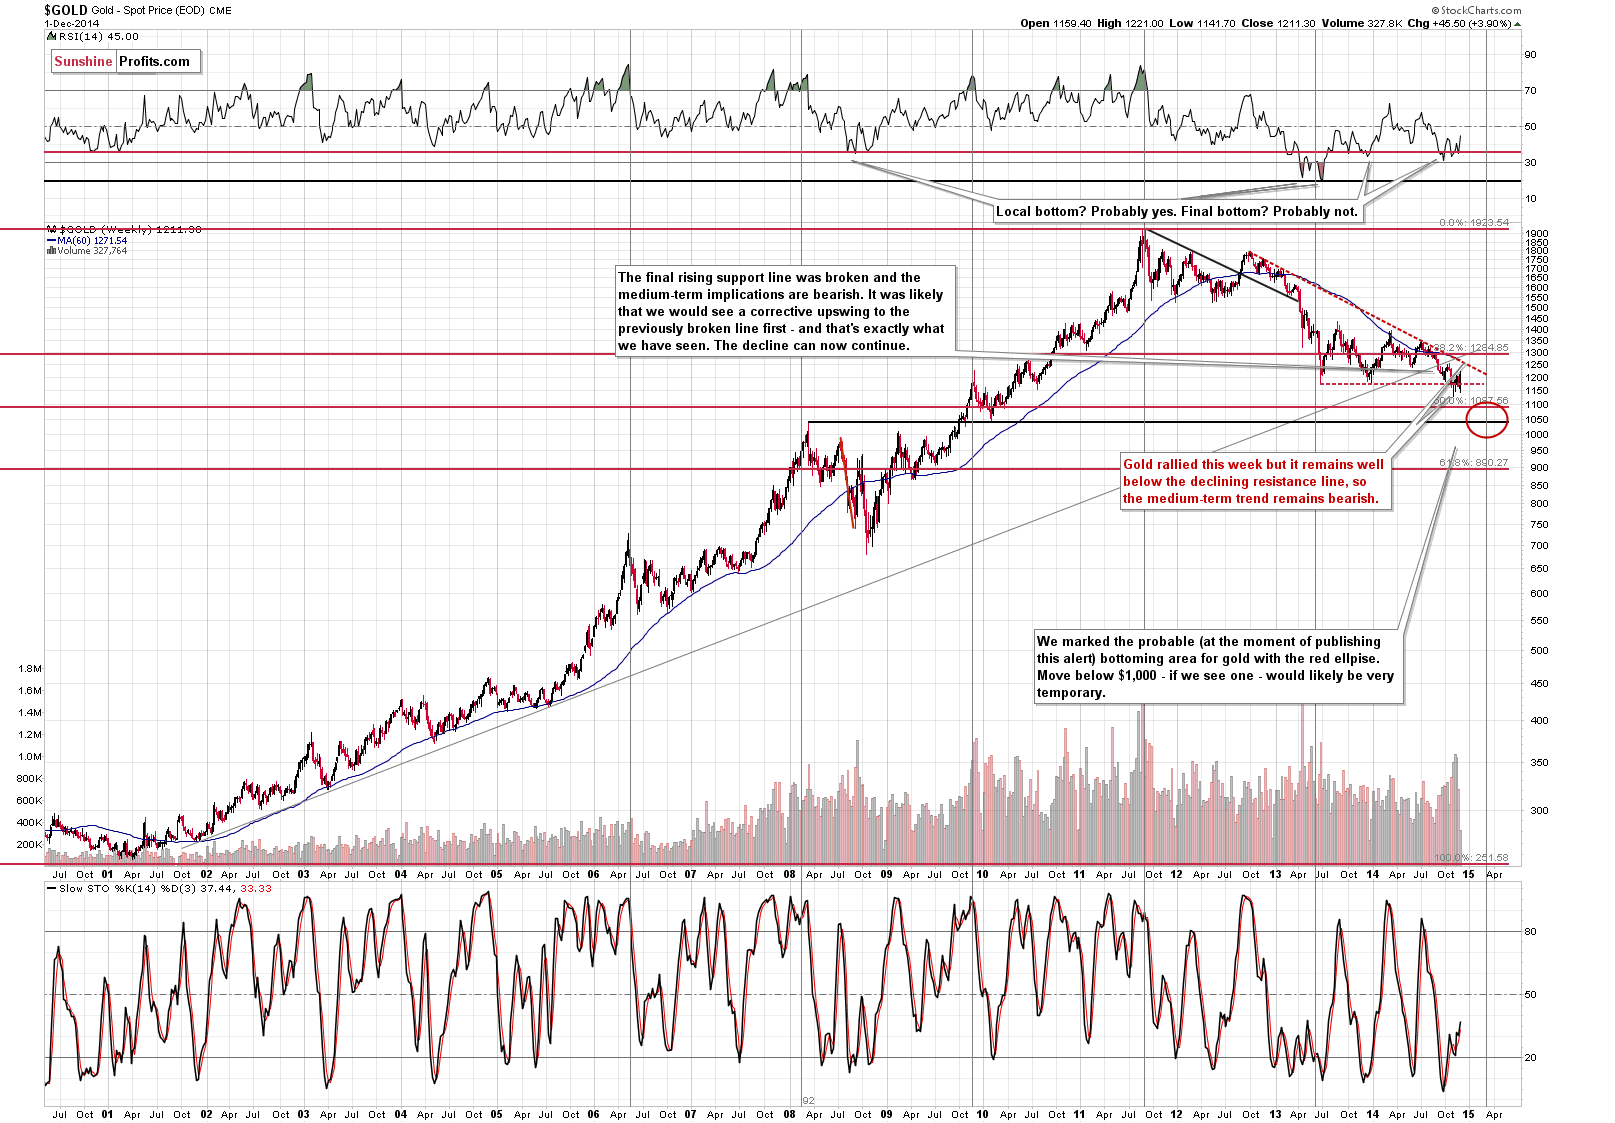
On the long-term chart, we see that the declining resistance line is well above the current price, so the medium term trend is definitely down. The next big move is still likely to be to the downside.
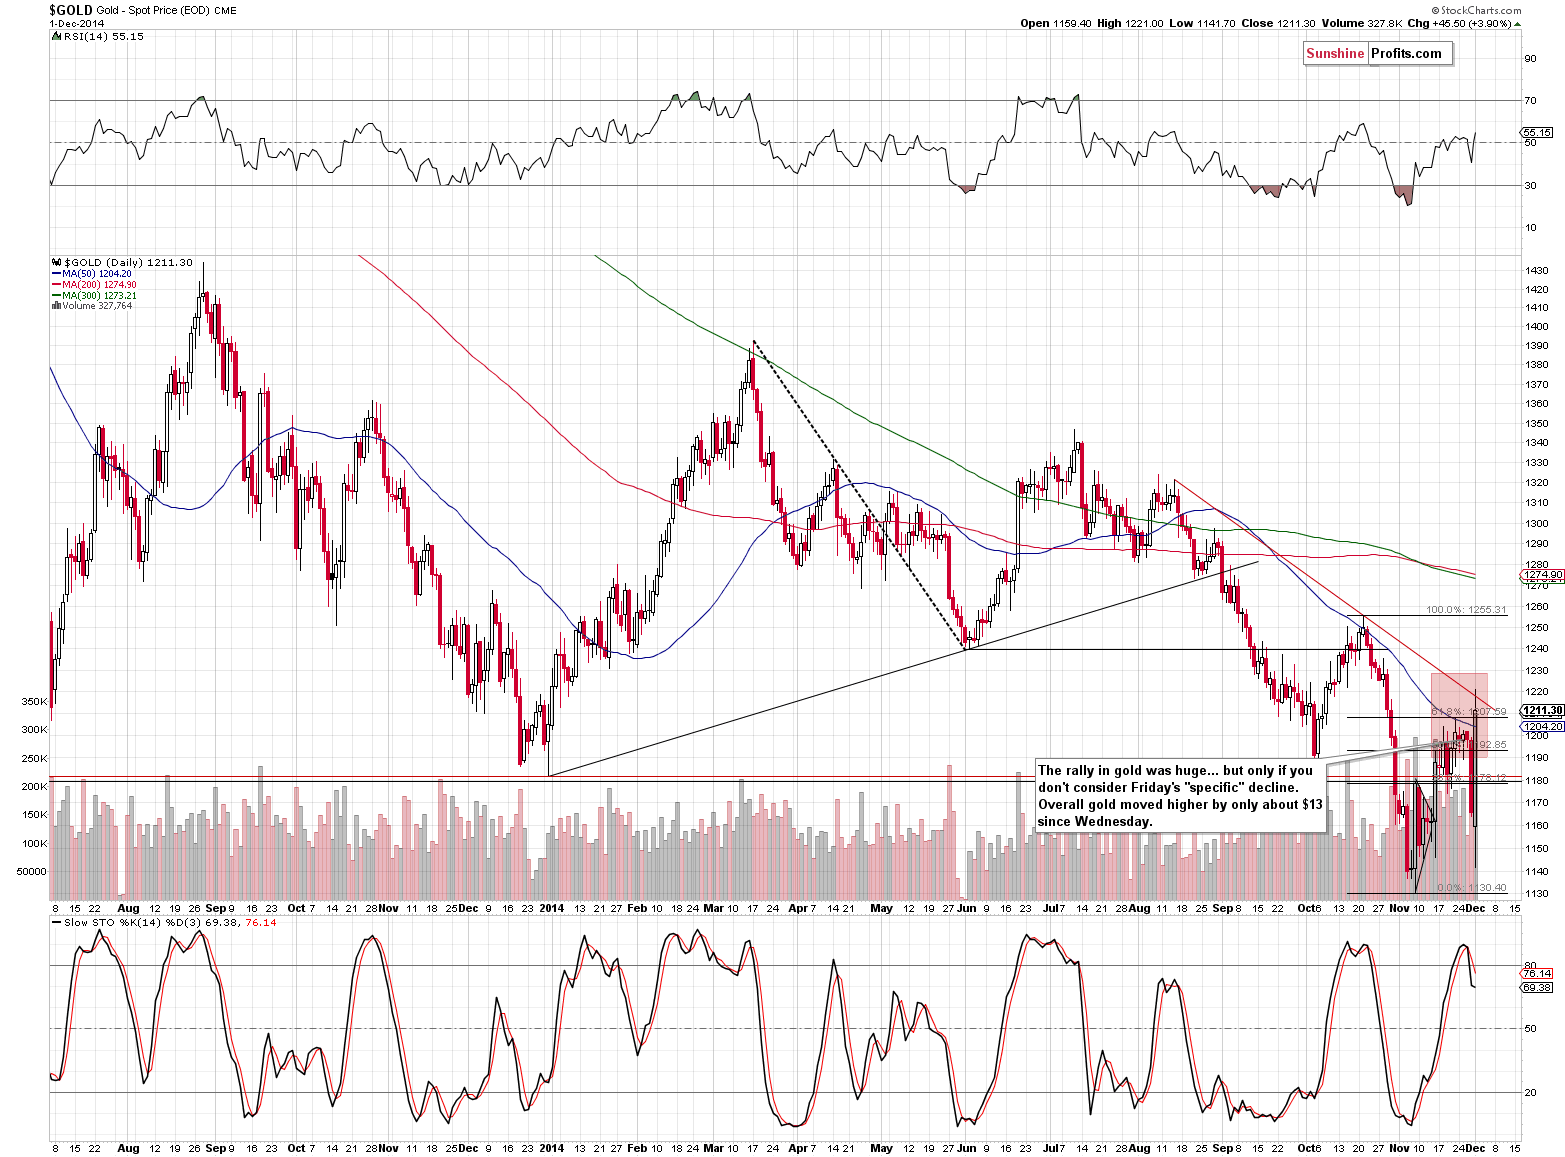
On the above chart, we see (in light of our previous comments) that gold has moved higher since Wednesday, but it declined after touching the declining, short-term resistance line, which we have previously referred to as our upper target level within the target area. Is the top in? It could be the case, but given the situation in the USD Index, there is still risk of seeing temporarily higher prices. If gold moves above the red line, then it could rally to $1,250 or so, where the medium-term resistance line is (marked on the long-term chart).
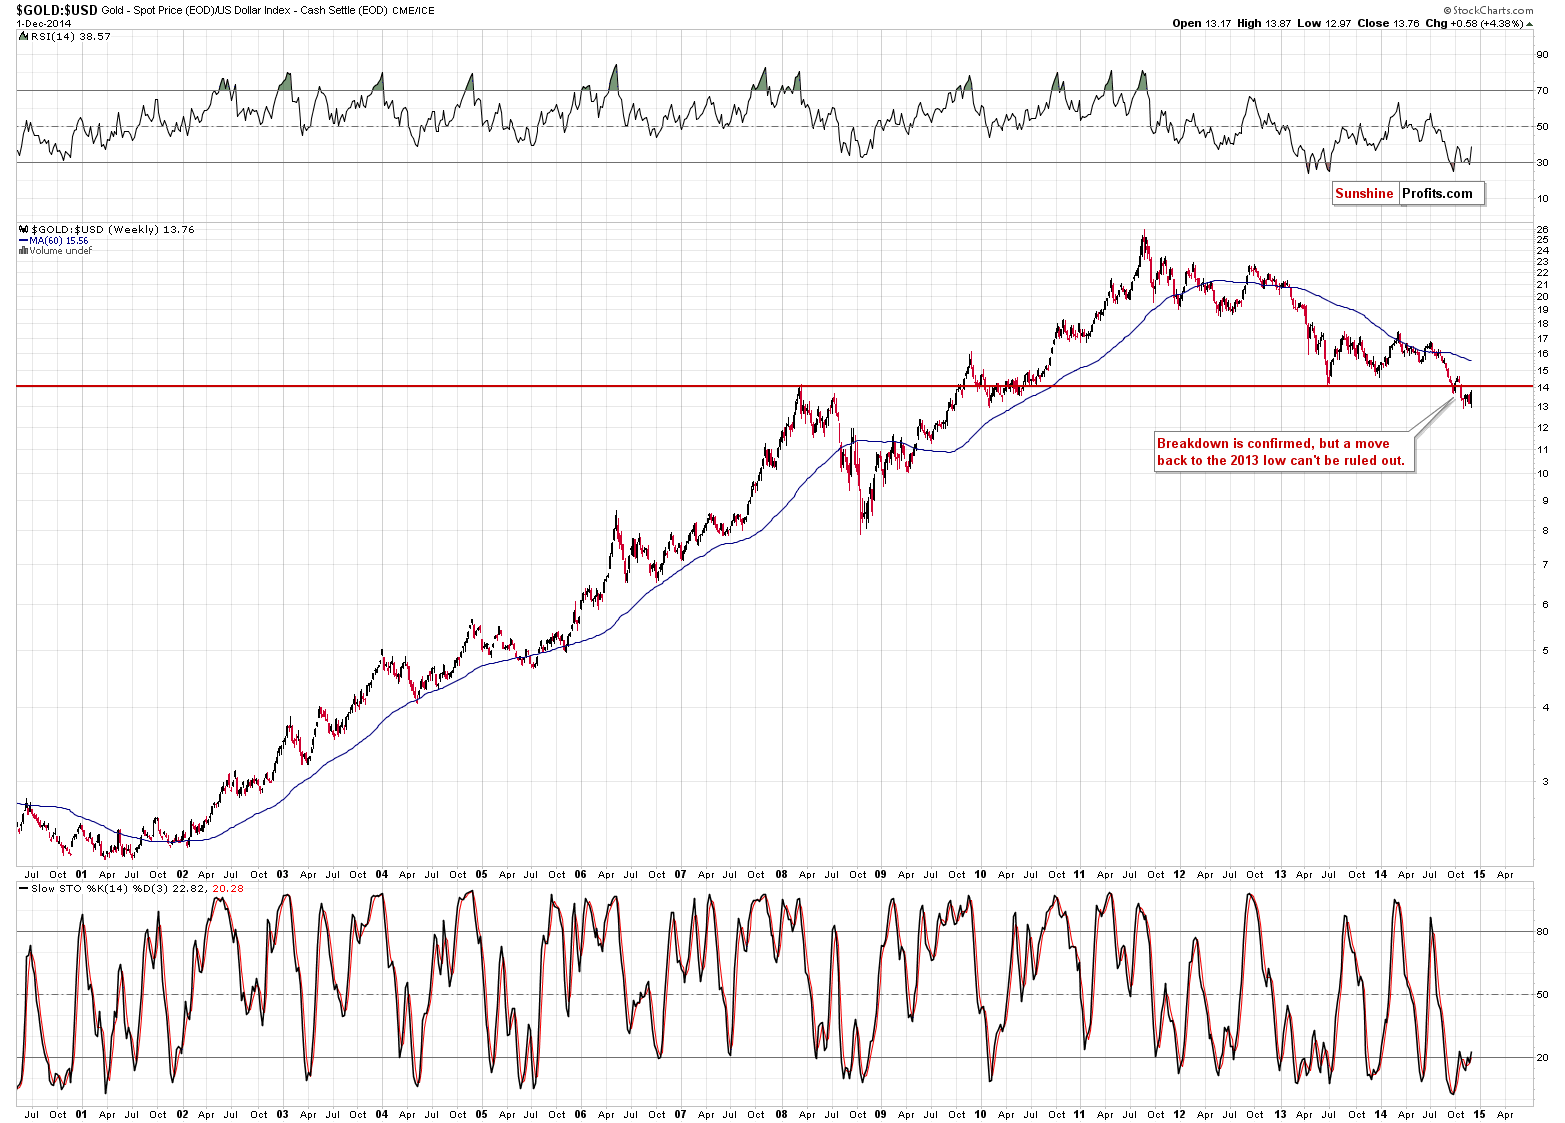
If we take a look at the gold:USD ratio and check for technical divergences, we’ll see that gold could indeed move higher before turning south again – thus verifying the breakdown by moving back to the 2013 low and 2008 high and then declining again.
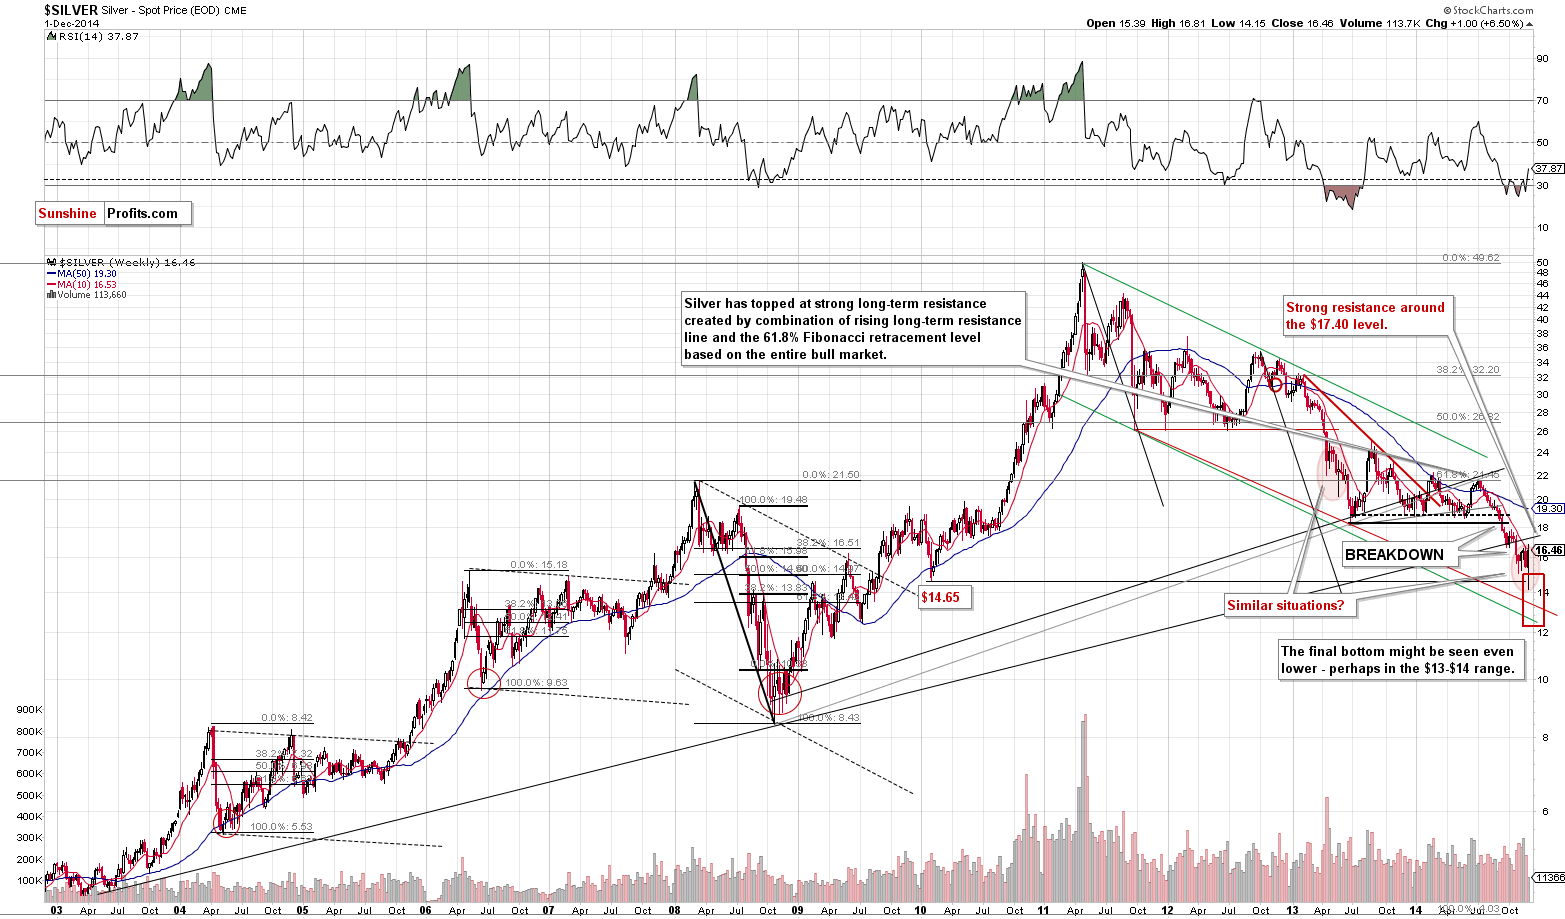
The silver market moved temporarily above the 10-week moving average only to decline back below it again. There was no true breakout and the situation seems similar to the one in gold, as silver remains well below the strong resistance. In this case, the medium-term resistance is created by the rising support line, which is currently close to $17.40. The medium-term trend remains down.
Silver moved to our target area last week, but this doesn’t seem to be really meaningful given our previous comments. It seems that the white metal will move to the target area – and to lower levels in the future.
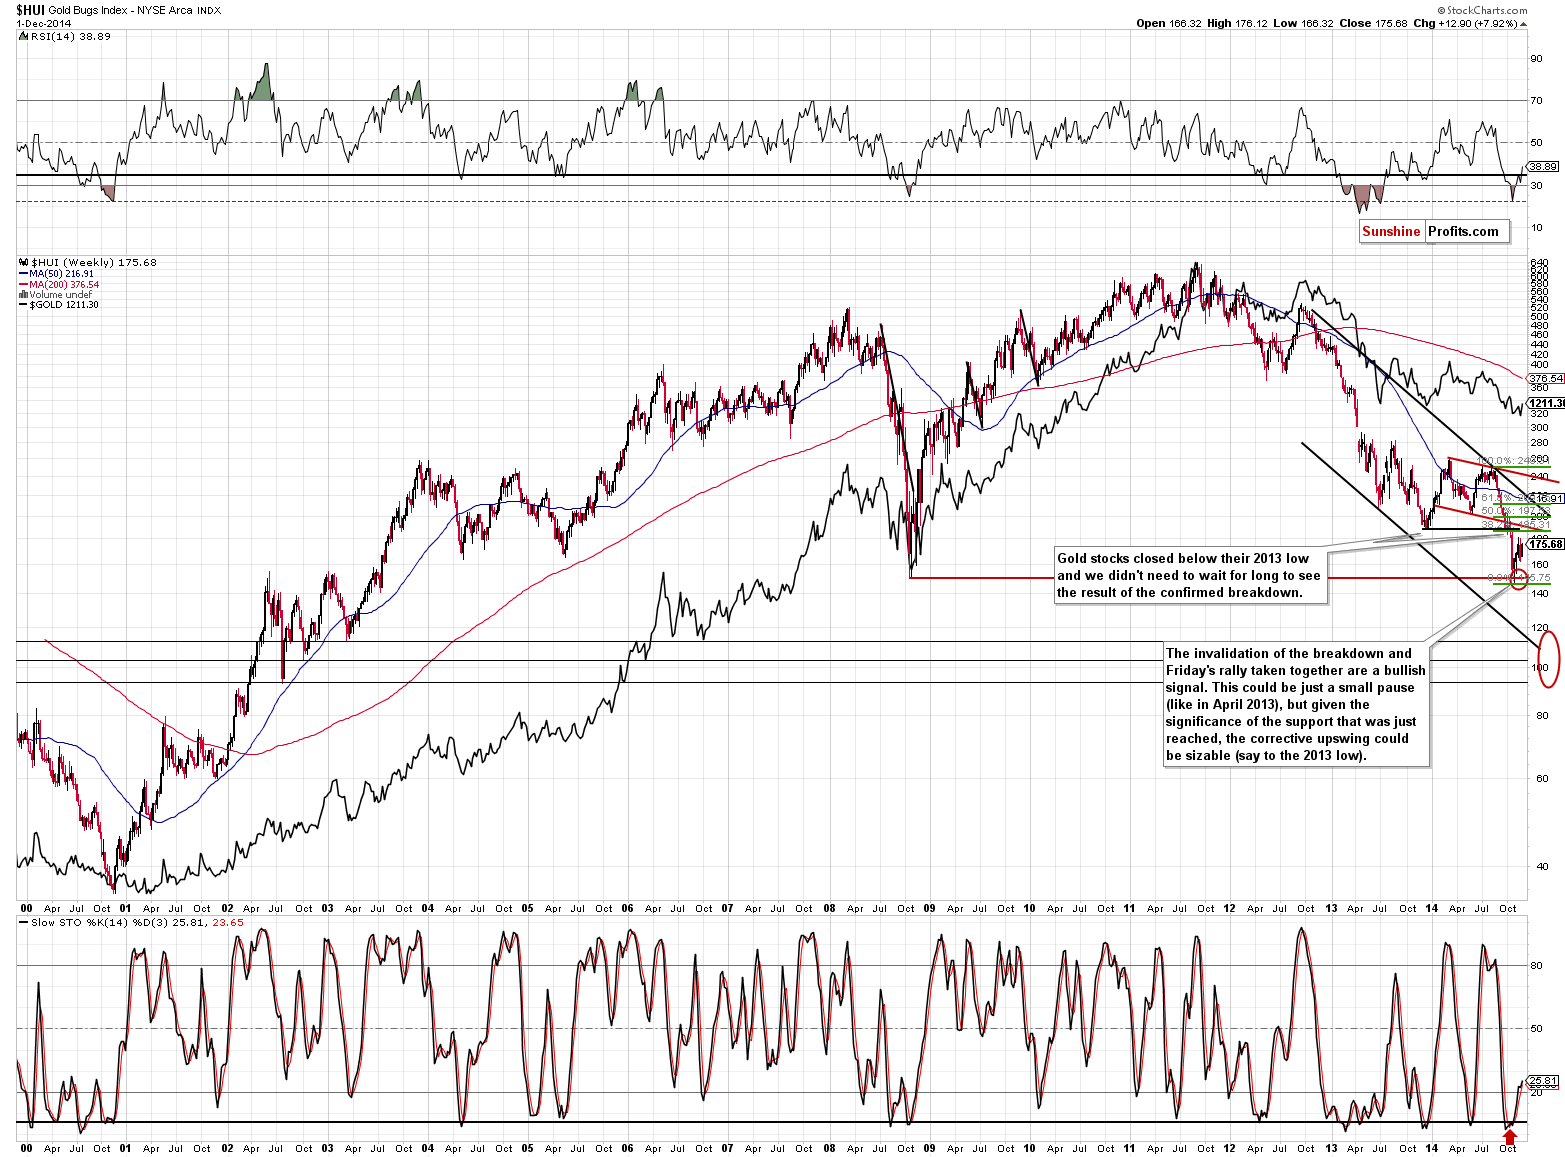
Finally, the analysis of gold stocks provides us with a bearish sign. While gold moved higher from Wednesday to Monday by about $13, gold stocks declined by about 1%. While it may seem unbelievable given the HUI Index’s rally yesterday, gold stocks have underperformed gold, which is a bearish sign.
The resistance level of the 2013 low has not been reached so far, so we could see an additional rally without any change in the medium-term outlook, which remains bearish.
Summing up, while a lot seems to have happened in the precious metals market in the last few days, it seems that in reality not much has changed. Both Friday’s decline and Monday’s rally seem to have been more of an “anomaly” than an important sign of strength in the precious metals market. In this situation, it seems that the approach that we had had toward the precious metals market before Friday is up-to-date today. The next big downswing is likely to be significant and much bigger than what we saw on Friday, however, it seems that waiting for a bearish confirmation before opening short positions is justified from the risk-reward perspective, especially right before the dollar’s cyclical turning point and the possibility of another move lower in it in the following days.
As always, we will continue to monitor the situation and report to you – our subscribers – accordingly.
To summarize:
Trading capital (our opinion): No positions
Long-term capital (our opinion): No positions
Insurance capital (our opinion): Full position
Please note that a full position doesn’t mean using all of the capital for a given trade. You will find details on our thoughts on gold portfolio structuring in the Key Insights section on our website.
As a reminder – “initial target price” means exactly that – an “initial” one, it’s not a price level at which we suggest closing positions. If this becomes the case (like it did in the previous trade) we will refer to these levels as levels of exit orders (exactly as we’ve done previously). Stop-loss levels, however, are naturally not “initial”, but something that, in our opinion, might be entered as an order.
Since it is impossible to synchronize target prices and stop-loss levels for all the ETFs and ETNs with the main markets that we provide these levels for (gold, silver and mining stocks – the GDX ETF), the stop-loss levels and target prices for other ETNs and ETF (among other: UGLD, DGLD, USLV, DSLV, NUGT, DUST, JNUG, JDST) are provided as supplementary, and not as “final”. This means that if a stop-loss or a target level is reached for any of the “additional instruments” (DGLD for instance), but not for the “main instrument” (gold in this case), we will view positions in both gold and DGLD as still open and the stop-loss for DGLD would have to be moved lower. On the other hand, if gold moves to a stop-loss level but DGLD doesn’t, then we will view both positions (in gold and DGLD) as closed. In other words, since it’s not possible to be 100% certain that each related instrument moves to a given level when the underlying instrument does, we can’t provide levels that would be binding. The levels that we do provide are our best estimate of the levels that will correspond to the levels in the underlying assets, but it will be the underlying assets that one will need to focus on regarding the sings pointing to closing a given position or keeping it open. We might adjust the levels in the “additional instruments” without adjusting the levels in the “main instruments”, which will simply mean that we have improved our estimation of these levels, not that we changed our outlook on the markets. We are already working on a tool that would update these levels on a daily basis for the most popular ETFs, ETNs and individual mining stocks.
Our preferred ways to invest in and to trade gold along with the reasoning can be found in the how to buy gold section. Additionally, our preferred ETFs and ETNs can be found in our Gold & Silver ETF Ranking.
As always, we'll keep you - our subscribers - updated should our views on the market change. We will continue to send out Gold & Silver Trading Alerts on each trading day and we will send additional Alerts whenever appropriate.
The trading position presented above is the netted version of positions based on subjective signals (opinion) from your Editor, and the automated tools (SP Indicators and the upcoming self-similarity-based tool).
As a reminder, Gold & Silver Trading Alerts are posted before or on each trading day (we usually post them before the opening bell, but we don't promise doing that each day). If there's anything urgent, we will send you an additional small alert before posting the main one.
=====
Latest Free Trading Alerts:
S&P 500 index made new all-time high on Friday, before closing down 0.3%. Is this a topping consolidation or just a flat correction within a long-term uptrend?
Stock Trading Alert: Stocks Continue To Fluctuate Along Record Levels – Which Direction Is Next?
=====
Hand-picked precious-metals-related links:
Oil, gold crash spell end of commodity ‘supercycle'
Perth Mint's silver sales jump to 10-month high in November
=====
In other news:
S&P doubts Japan government will have detailed fiscal consolidation plan
China stocks surge on PBOC stimulus hopes
European Banks Seen Afflicted by $82 Billion Capital Gap
China ETF Outflows Show Traders Losing Faith in Rally
=====
Thank you.
Sincerely,
Przemyslaw Radomski, CFA
Founder, Editor-in-chief
Gold & Silver Trading Alerts
Forex Trading Alerts
Oil Investment Updates
Oil Trading Alerts

