
Briefly: In our opinion short speculative positions (half) in gold, silver and mining stocks are justified from the risk/reward perspective.
To a great extent today’s alert will be a big reply to the question that we received yesterday – what has actually changed in our outlook for the precious metals sector given this week’s strength. Let’s jump right to the finish line before discussing details: not much, if anything. The situation developed as expected – we were likely to see a move higher and we saw a move higher – yesterday, we even mentioned the possibility of the GDX ETF moving to its 50% retracement level.
We will provide some more details today, but we would like to point out that the main reasons for which we think the medium-term move is down were covered in the previous Monday’s alert, and if you haven’t had the chance to read it, we encourage you to do so today. Having said that, let’s move on to charts (charts courtesy of http://stockcharts.com.)
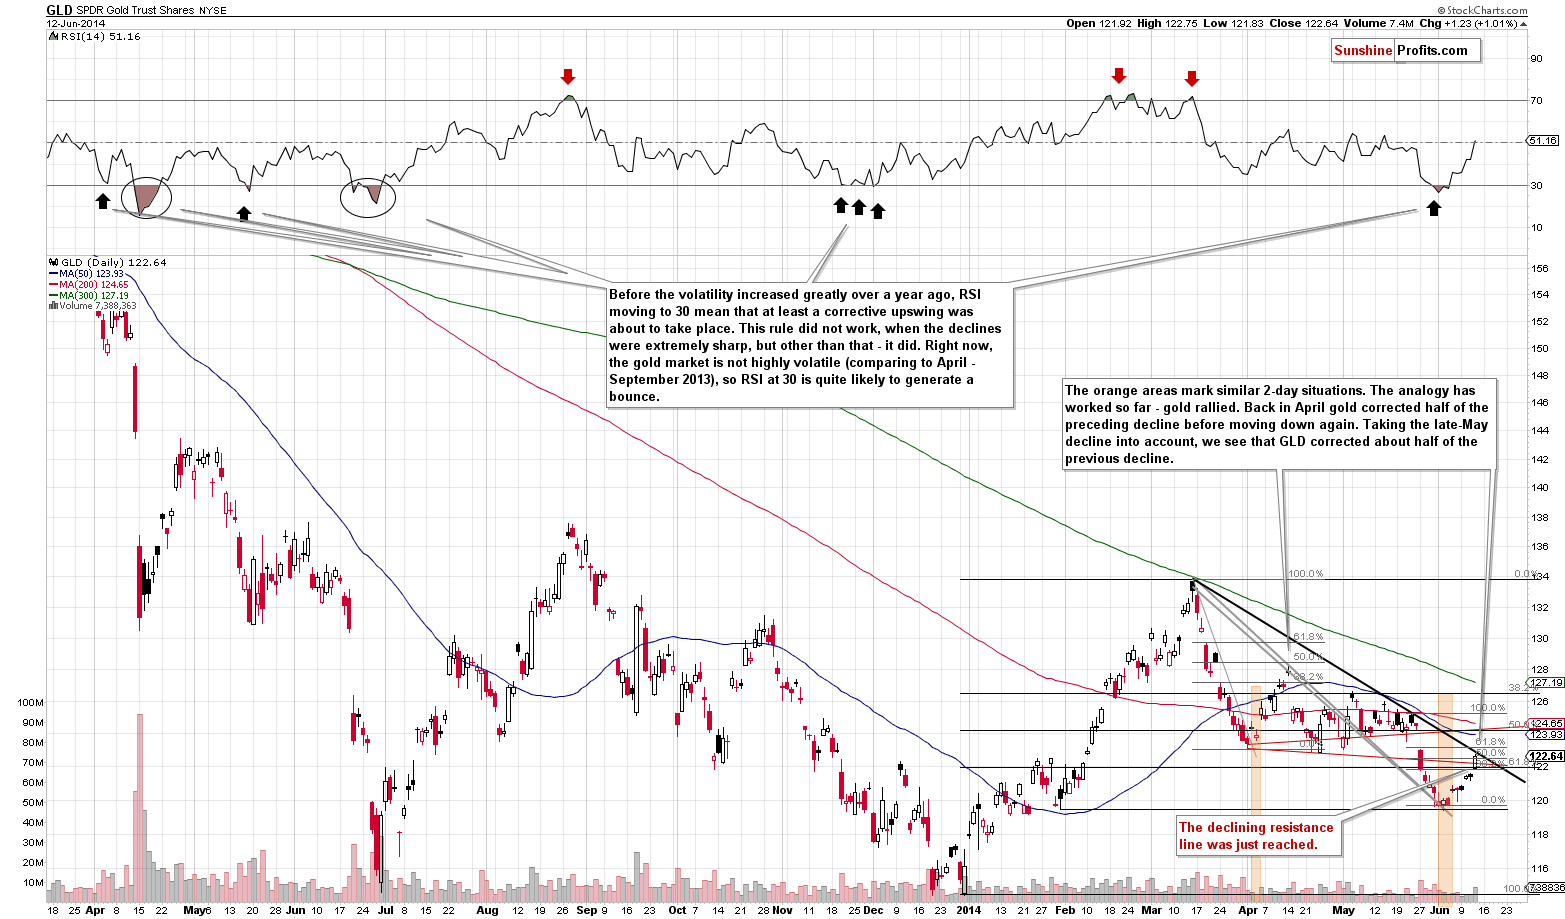
Gold rallied visibly and the move materialized on significant volume. In general – with no other important factors present - such sessions are a bullish sign. At this time, however, we need to take into account the declining resistance line that was just reached, the analogy to the April rally and the medium-term trend (which remains down).
The declining resistance line marked in black seems to be enough to stop this rally. An analogous line in spot gold was not reached yesterday, but it was reached in pre-market trading today (at approximately $1,277), so the bearish implications are present also from this perspective.
The analogy to the April rally remains in place. We previously commented on it by marking the 2-day session with orange rectangles and writing that we were likely to see a bigger rally once again. The similarity continued and we saw a visible move higher. Now, if the similarity is to continue, then we have probably just seen another local top or we will see one today. The reason is that back in April gold corrected about half of the preceding decline before moving lower once again, and that’s approximately how much of the previous decline gold has just corrected. Please note that at this time it’s less clear what point should we use as the start of the decline as there were a few local tops in May. If we used a higher high, the 50% retracement would be slightly higher as well, but all that it changes is that gold could move just a little higher before forming a top.
Overall, nothing changed in gold’s technical picture and we can see the same in case of its performance relative to other commodities.
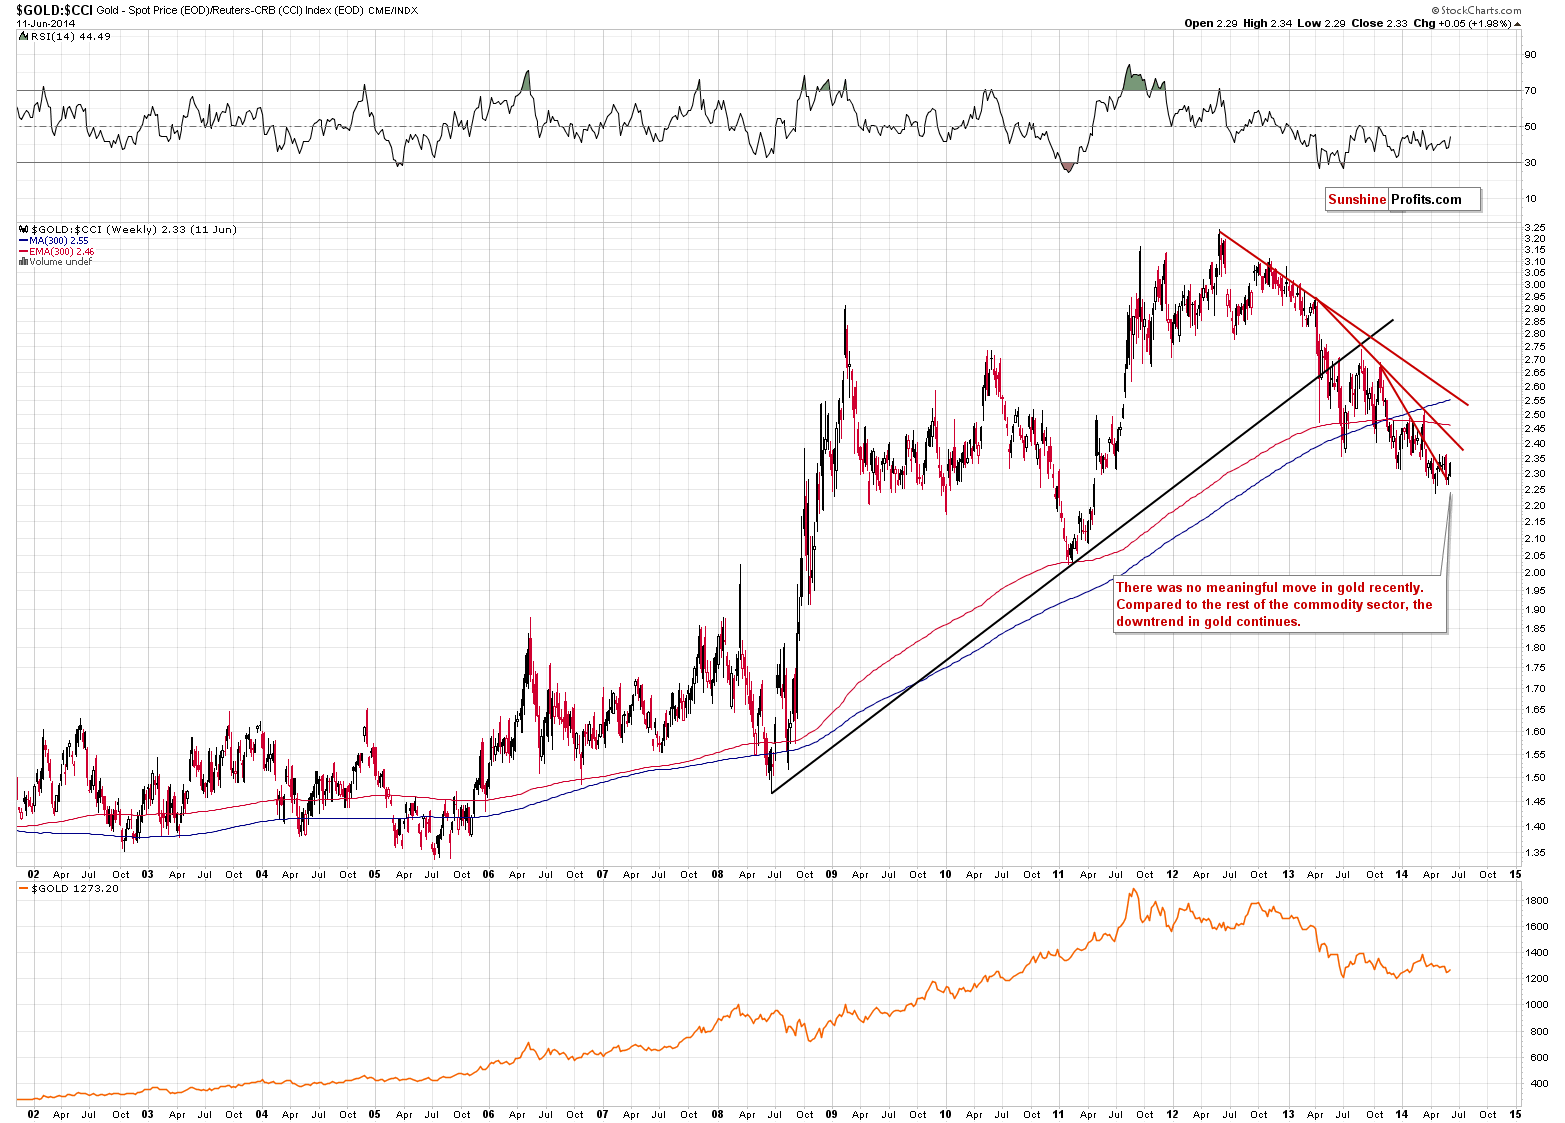
The above chart doesn’t include the last day’s action, but it doesn’t change anything as the move was not significant enough to change the overall trend and the trend’s clearly down. In terms of other commodities, gold has been making new lows for the past year instead of simply consolidating. There has been no meaningful breakout and the trend remains down.
Let’s examine silver’s rally.
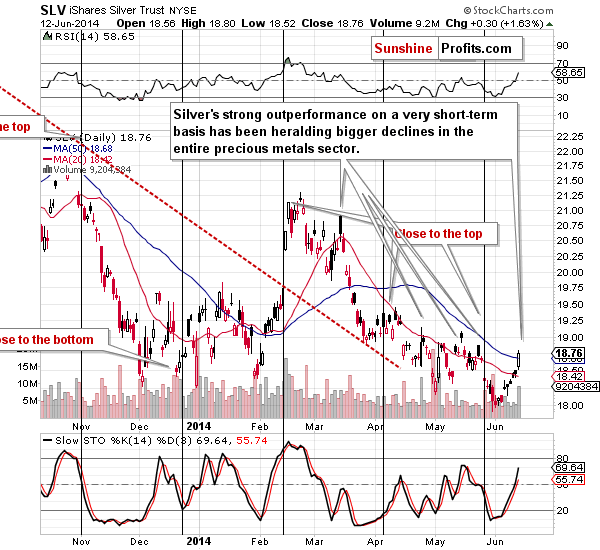
Those, who have been following our analysis for some time, know that it’s usually best not to take silver’s strength at face value. In the early years of the current great bull market in the precious metals sector one could say that the “whites lead the yellow” meaning that silver and platinum were showing strength before gold and they indicated another rally (and the same went for mining stocks).
However, that’s not how things have worked in the past months. There has been a different and quite strong short-term relationship in place between silver and gold and its implications are the opposite to these mentioned above. In the past months silver has been outperforming gold on a very short-term basis right before taking another dive. We marked some cases on the above chart – please note that silver usually rallied quickly right before a big decline. These fake moves caught many long-term investors by surprise as that’s exactly the opposite of what one might have expected. Anyway, we definitely saw significant price/volume action yesterday and it’s either a sign of a bigger rally or – as it worked in the vast majority of cases – another fake move that will be followed by declines. We think the latter is much more probable, but we will monitor the market to see any bullish confirmations or something that could invalidate the bearish outlook.
At the first sight the mining stocks’ chart is very bullish. They rallied in the last 3 days and the accompanying volume was relatively high and rising. That’s a bullish combination. However, the rally was likely to take place, based on gold’s previous oversold status, so the fact that we indeed saw a rally, is not necessarily a sign of strength. What’s so significant about the last days’ performance is the mining stocks’ strength relative to gold. Let’s examine it more closely starting with the long-term chart.
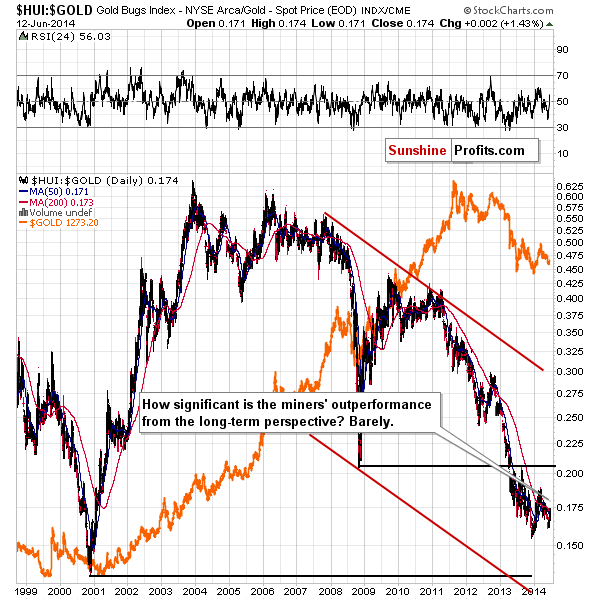
What did you see when you looked at the above chart just a second ago? You saw a huge decline with a pause. You might have also seen a decline that doesn’t look like it’s over as it hasn’t stopped at a significant support. That’s exactly what it is. The significant thing is what happened in the second half of 2013 – there was a pullback to the 2008 low and then further declines. The breakdown was verified and the odds for the continuation of the downtrend increased. What happened this week in the HUI to gold ratio – meaning the gold stocks’ performance relative to gold – is not even visible on the above chart. That tells you how much it changes as far as the main trend is concerned – nothing, at least not yet.
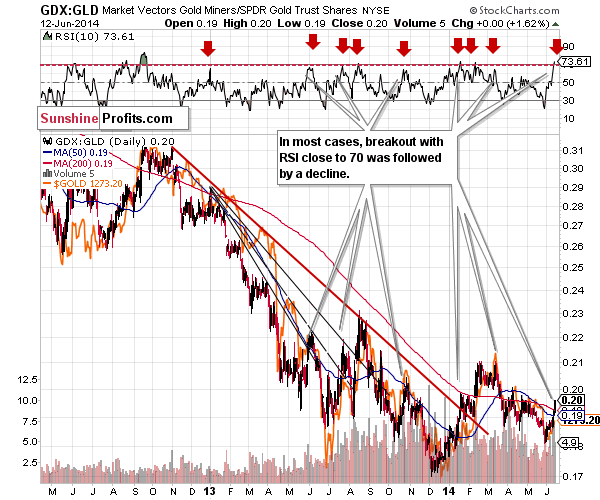
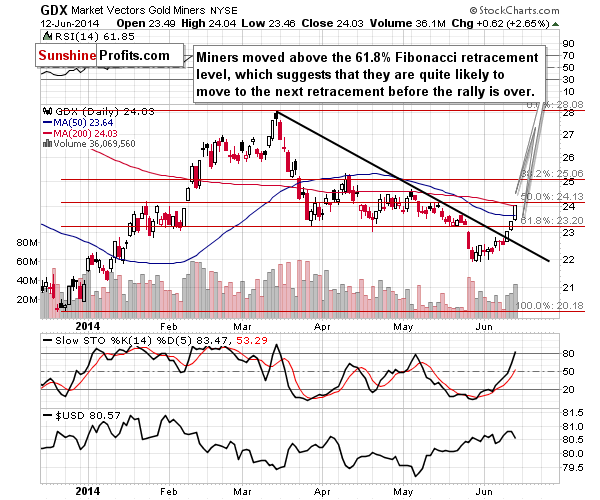
On a short-term basis (we used the GDX ETF as a proxy for the mining stocks this time) the miners’ outperformance is clearly visible, but the implications don’t have to be bullish just yet. The RSI indicator based on the ratio suggests a significantly overbought condition and in fact we just saw a sell signal as the indicator moved above the 70 level.
What we wrote yesterday remains up-to-date:
The way the mining stocks performed relative to gold is very significant. The rally in the GDX to GLD ratio was strong and sharp. With something as visible as that, one might expect it to mean something. We think it does. While in the past, strong performance of the mining stocks relative to gold used to herald more gains, it doesn’t seem to be the case at this time anymore. In most cases, in the past months, the times when the miners to gold ratio rallied particularly strongly – and by that we mean when the RSI indicator moved close to the 70 level – heralded either a consolidation in the precious metals sector, or a decline.
At this time the RSI indicator based on the ratio is slightly above 67, which is very close to the 70 level, and the analogy we mentioned is already in place. This doesn’t mean that it will cease to be in place if the precious metal sector rallies some more.
What do we make of all the above? It seems to us that the days of the rally in the precious metals market are numbered. The resistance in case of the GLD ETF is very close, and even though miners rallied quite strongly, they too have a resistance level (50% retracement) that can prevent further gains. Additionally, the extent of the miners’ outperformance suggests that at least a pause is likely.
We realize that miners rallying so strongly appear to be a very bullish and encouraging sign, but the same was the case several times in the past months – there already were cases when miners rallied as substantially relative to gold and what happened in the following weeks is illustrated by the above chart – we usually saw at least a pause and declines in some cases. The recent (past year) history shows us that in case of miners’ outperformance too much can be a bad thing and this could apply once again in this case.
There are 2 more factors that we would like to discuss today that are not directly seen on the above charts.
Firstly, the strong rally in mining stocks could have been caused by the final part of an upswing in the stock market. Mining stocks have been one of the worst performing sectors for the past 2 years or so. It is quite often the case that the worst performing sectors catch up right at the top of the market (just at it is the case that individual companies that didn’t perform well catch up when the sector tops). Consequently, perhaps it was the case that the miners’ rally was just a confirmation of a top in the stock market. It could be just a local top, not necessarily a significant one – but still there could be something other than the internal strength of the precious metals market that caused miners to rally so strongly recently.
Secondly, gold made headlines on finance.yahoo.com yesterday and today and they were positive. The one that we saw previously said “Gundlach: Gold could go to $1,500”, “Gold Set for First Back-to-Back Weekly Gain Since April” and the one that we’re seeing now says “Will gold regain its safe haven status?”. It is usually the case that such headlines attract a lot of people who don’t really believe in the gold market, but are buying it without giving it a second though just to make a quick profit. It has proven to be profitable to generally do the opposite – when everyone thinks that a certain move is going to happen, to do exactly the opposite. At this time it could be the case that everyone who were at least considering buying gold, have already done so and there’s no more buying power left to push prices even higher in the short term.
Summing up, while the medium-term trend in the precious metals market is down, we were likely to see a corrective upswing – and we have. While in the past days it seemed that the corrective upswing was not over yet, we have some signs that it is over now. We have gold at a significant resistance line, we have short-term outperformance in silver, and gold had made the headlines. Miners moved higher relative to gold but after examining the situation more closely it turns out that it’s much less bullish than it seems at first sight. Consequently, we think that using a small amount of the speculative capital (half of the regular position) to open a short position is now justified from the risk/reward point of view.
To summarize:
Trading capital (our opinion): Short positions (half) in gold, silver and mining stocks with the following stop loss orders:
- Gold: $1,306
- Silver: $20.20
- GDX ETF: $25.6
Long-term capital: No positions
Insurance capital: Full position
Please note that a full position doesn’t mean using all of the capital for a given trade. You will find details on our thoughts on gold portfolio structuring in the Key Insights section on our website.
As always, we'll keep you - our subscribers - updated should our views on the market change. We will continue to send out Gold & Silver Trading Alerts on each trading day and we will send additional Alerts whenever appropriate.
The trading position presented above is the netted version of positions based on subjective signals (opinion) from your Editor, and the automated tools (SP Indicators and the upcoming self-similarity-based tool).
As a reminder, Gold & Silver Trading Alerts are posted before or on each trading day (we usually post them before the opening bell, but we don't promise doing that each day). If there's anything urgent, we will send you an additional small alert before posting the main one.
Thank you.
Sincerely,
Przemyslaw Radomski, CFA
Founder, Editor-in-chief
Gold & Silver Trading Alerts
Forex Trading Alerts
Oil Investment Updates
Oil Trading Alerts

