
In short: No changes: small (half) short position in gold, silver, and mining stocks.
Gold moved slightly higher today and what we had initially (when we were sending the second alert on Friday) assumed about the candlestick being formed (bearish shooting star candlestick) did not materialize. Let’s see how much this changed (charts courtesy of http://stockcharts.com.)
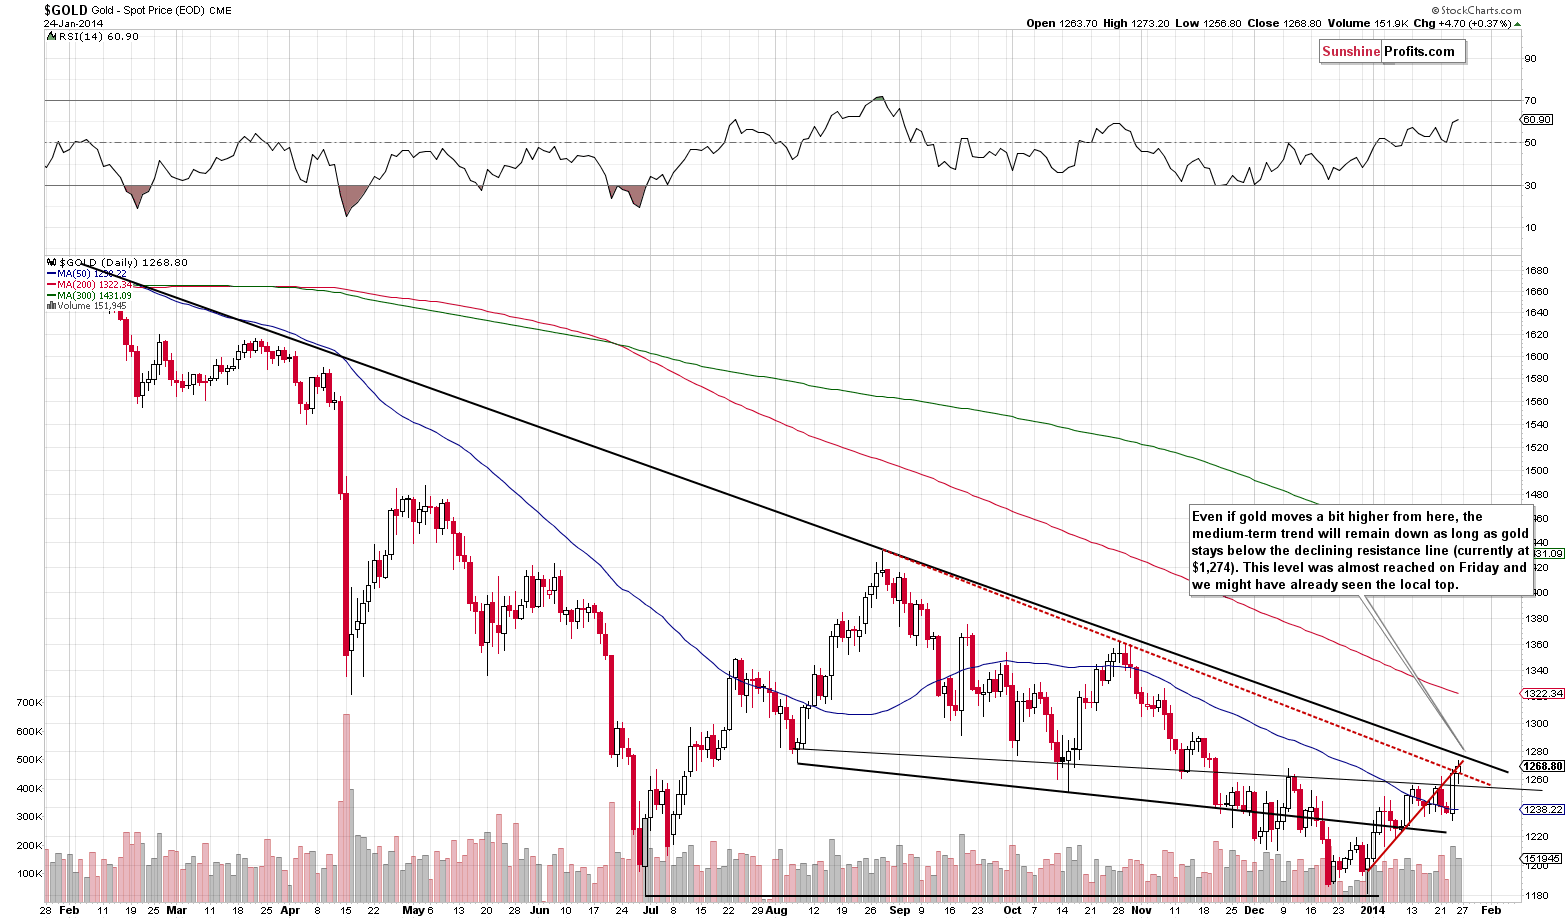
Not much. Gold still almost reached the strong declining resistance line and it still seems that it’s about to reverse its course.
Based on Thursday’s closing prices, we wrote the following:
(…) we get a picture in which gold would be likely to rally on Friday or on one of the following days, but this rally would take gold only to the declining medium-term resistance line (approximately to $1,275) and after that the yellow metal would be likely to decline once again.
Gold moved to $1,273, and waiting for it to move $2 more dollars before opening a position didn’t seem worth the risk of missing this chance to open a short position in case the market topped a little lower.
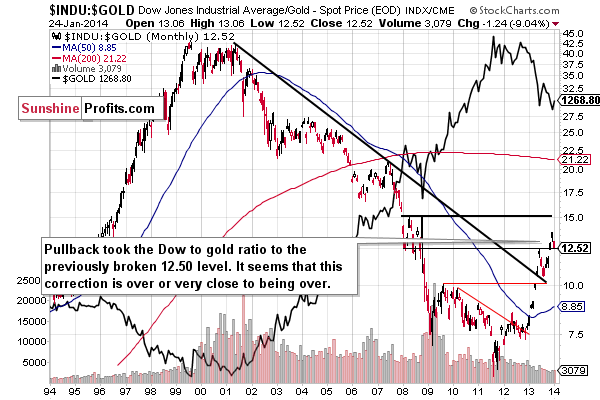
Especially, that the Dow to gold ratio has corrected to its previously broken support/resistance line at 12.50.
Additionally, what we wrote previously remains up-to-date:
Taking the Dow to gold ratio into account, we see a post-breakout correction. It’s worth noting that the correction has begun sort of “by itself” – without reaching any significant resistance line. This makes it more likely that the move is just a correction and not a real decline in the ratio (meaning a rally in gold).
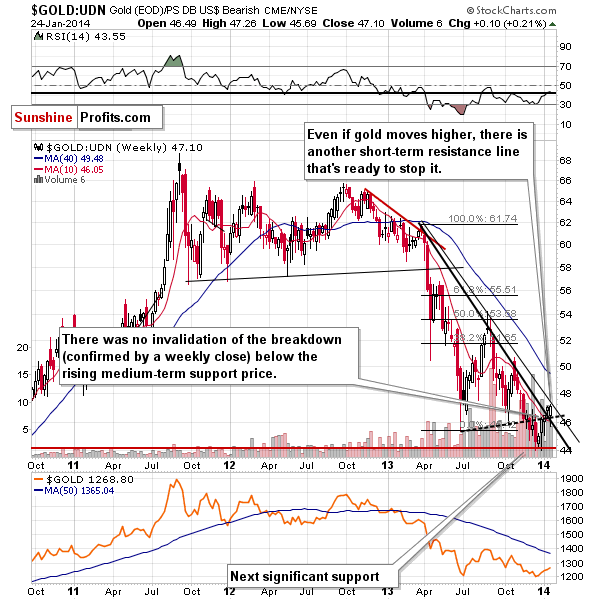
From the non-USD perspective, gold has almost reached the declining resistance line, which suggests that the top is either in or about to be in. However, to be clear, a bit higher on the above chart could mean $20 or so in spot gold in USD terms, so the above signal is not that precise.
The chart featuring gold priced in the British pound, however, is.
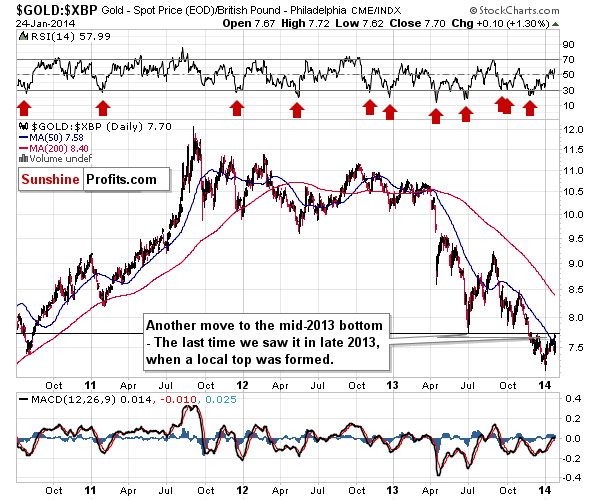
Gold moved to the mid-2013 bottom, which is also a late-2013 high. This level serves as resistance and was just reached, so we can expect a reversal to be seen shortly.
Moving on to the silver chart, we once again see something much less bullish.
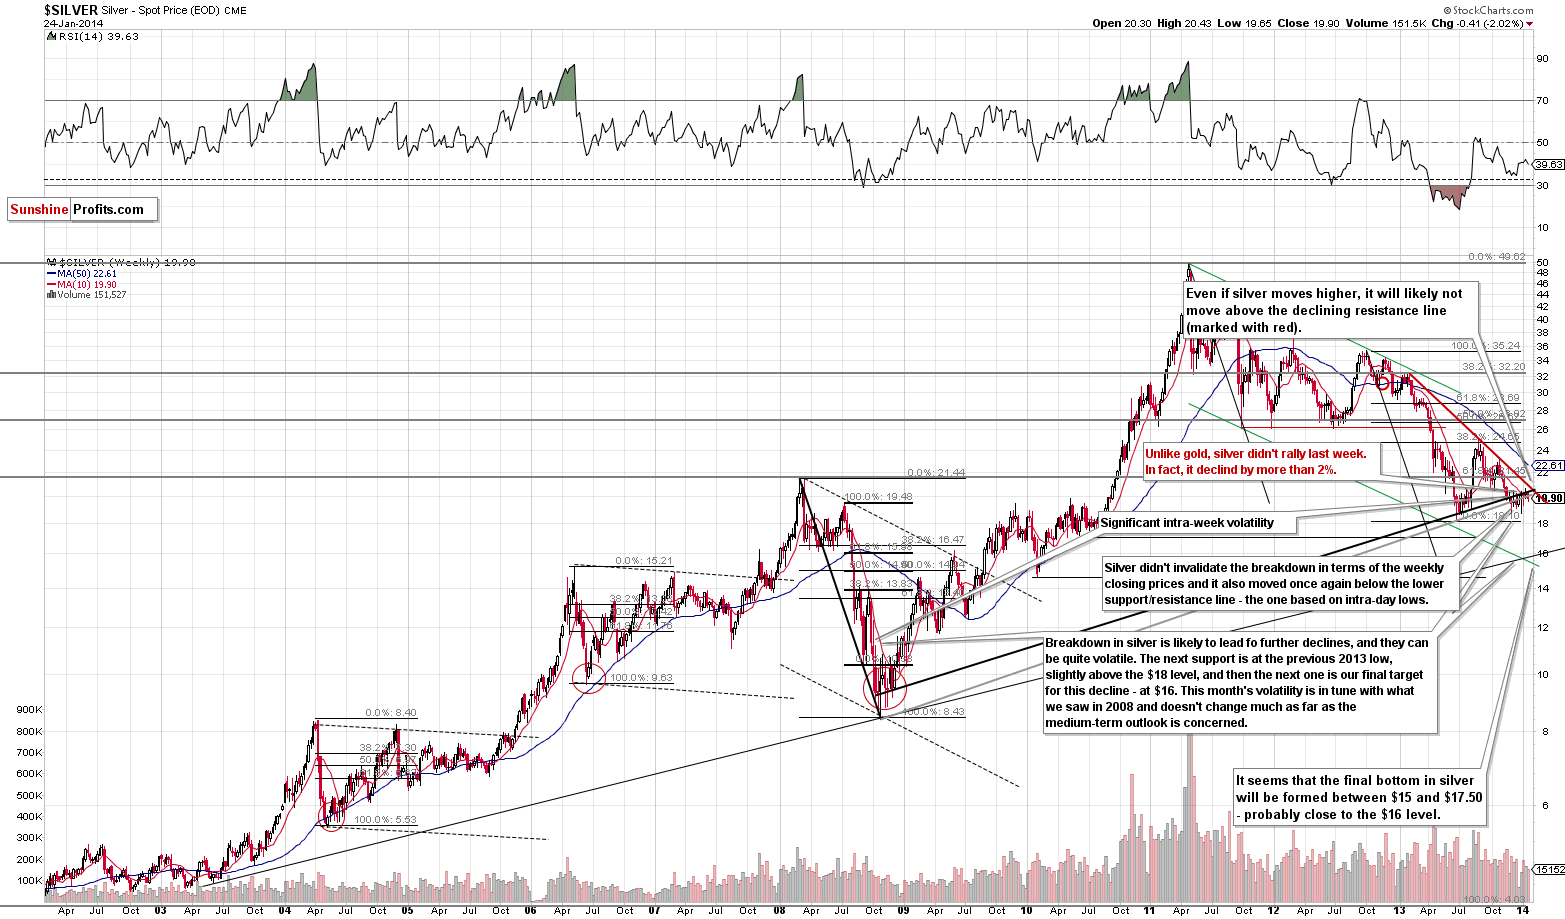
Silver moved significantly lower last week and ended it about 2% lower. This is a negative divergence, which by itself doesn’t mean that a top is in, but it does confirm it if we have signals that this is the case coming from other markets. And this is the case right now.
Gold stocks were basically flat on Friday, so what we wrote based on Thursday’s closing prices remains up-to-date.
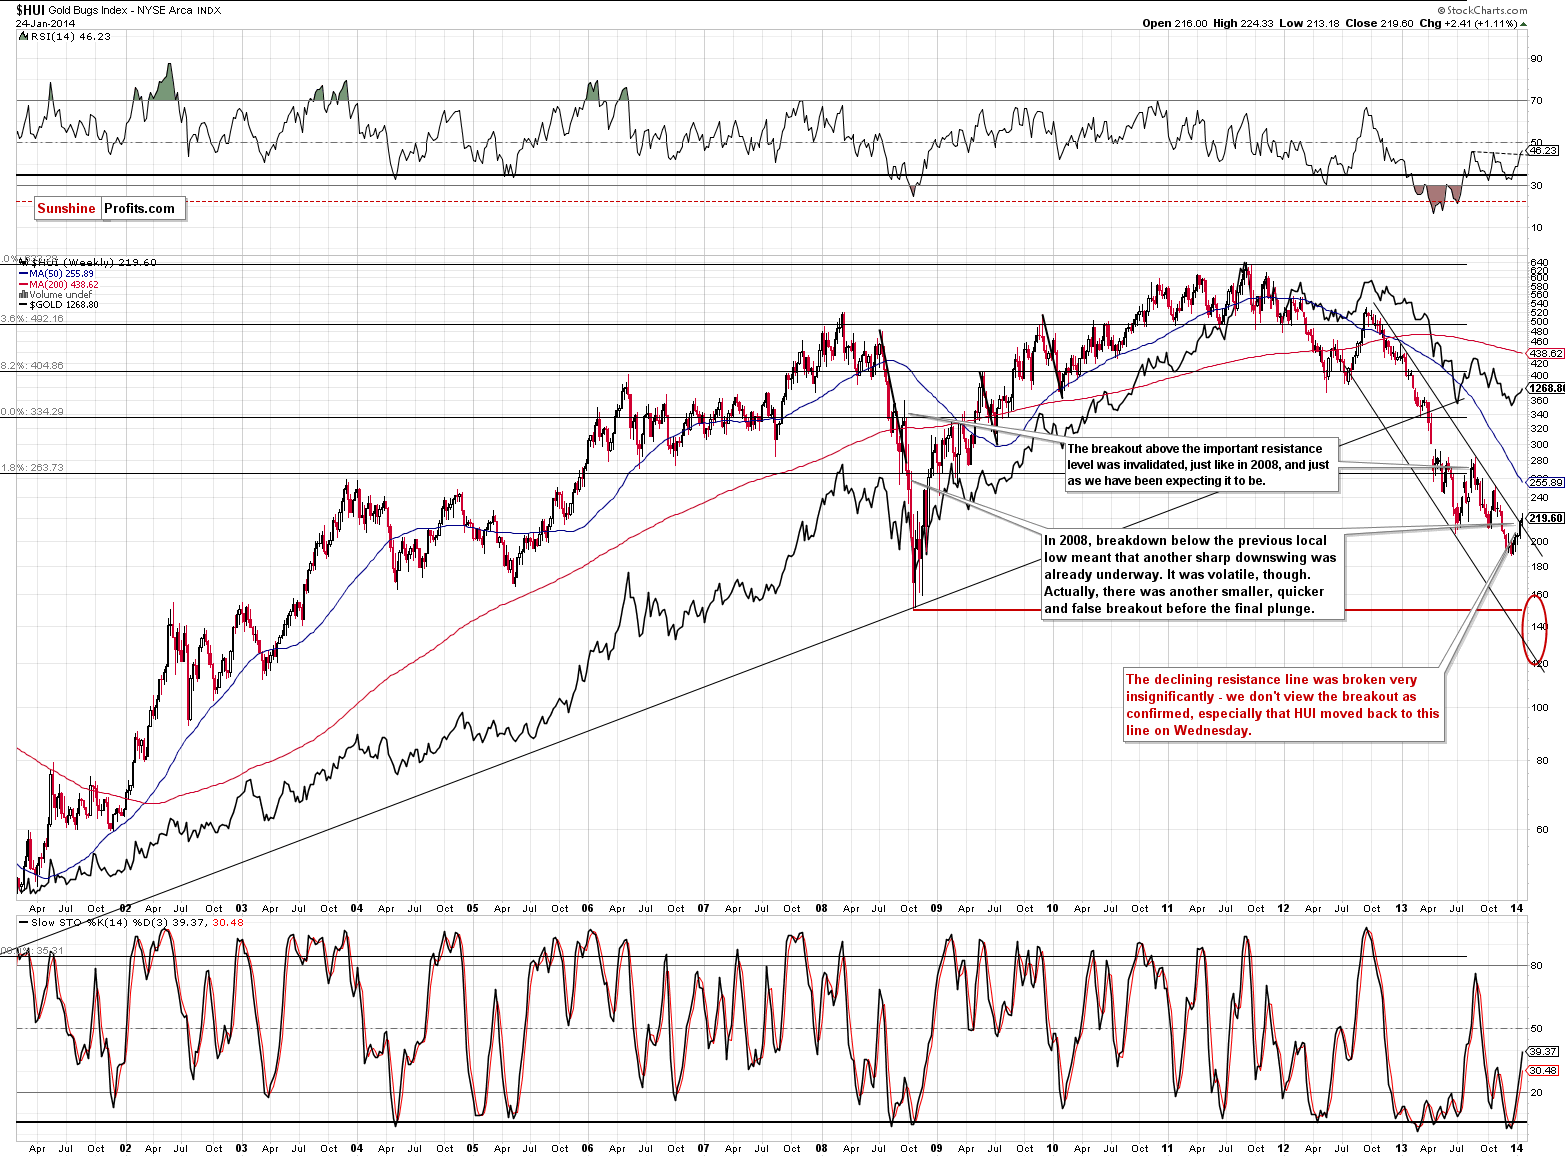
Gold miners moved higher recently, but not to the extent that would suggest the medium-term trend is already up. Yes, we saw a very small (!) move above the declining resistance line, but just as it was the case with gold, we would need to see a confirmation of this move.
This is particularly the case because we saw something similar right before the final part of the plunge in 2008. History repeats itself to some degree and the current decline is in our opinion most similar to the only other major decline that we saw since the beginning of this bull market. Back then there was one major correction within the decline (we saw one in mid-2013) and then one small one. We have a small breakout right now.
So, how bullish is it, really? „Mildly“ is our best answer at this time.
What about silver stocks?
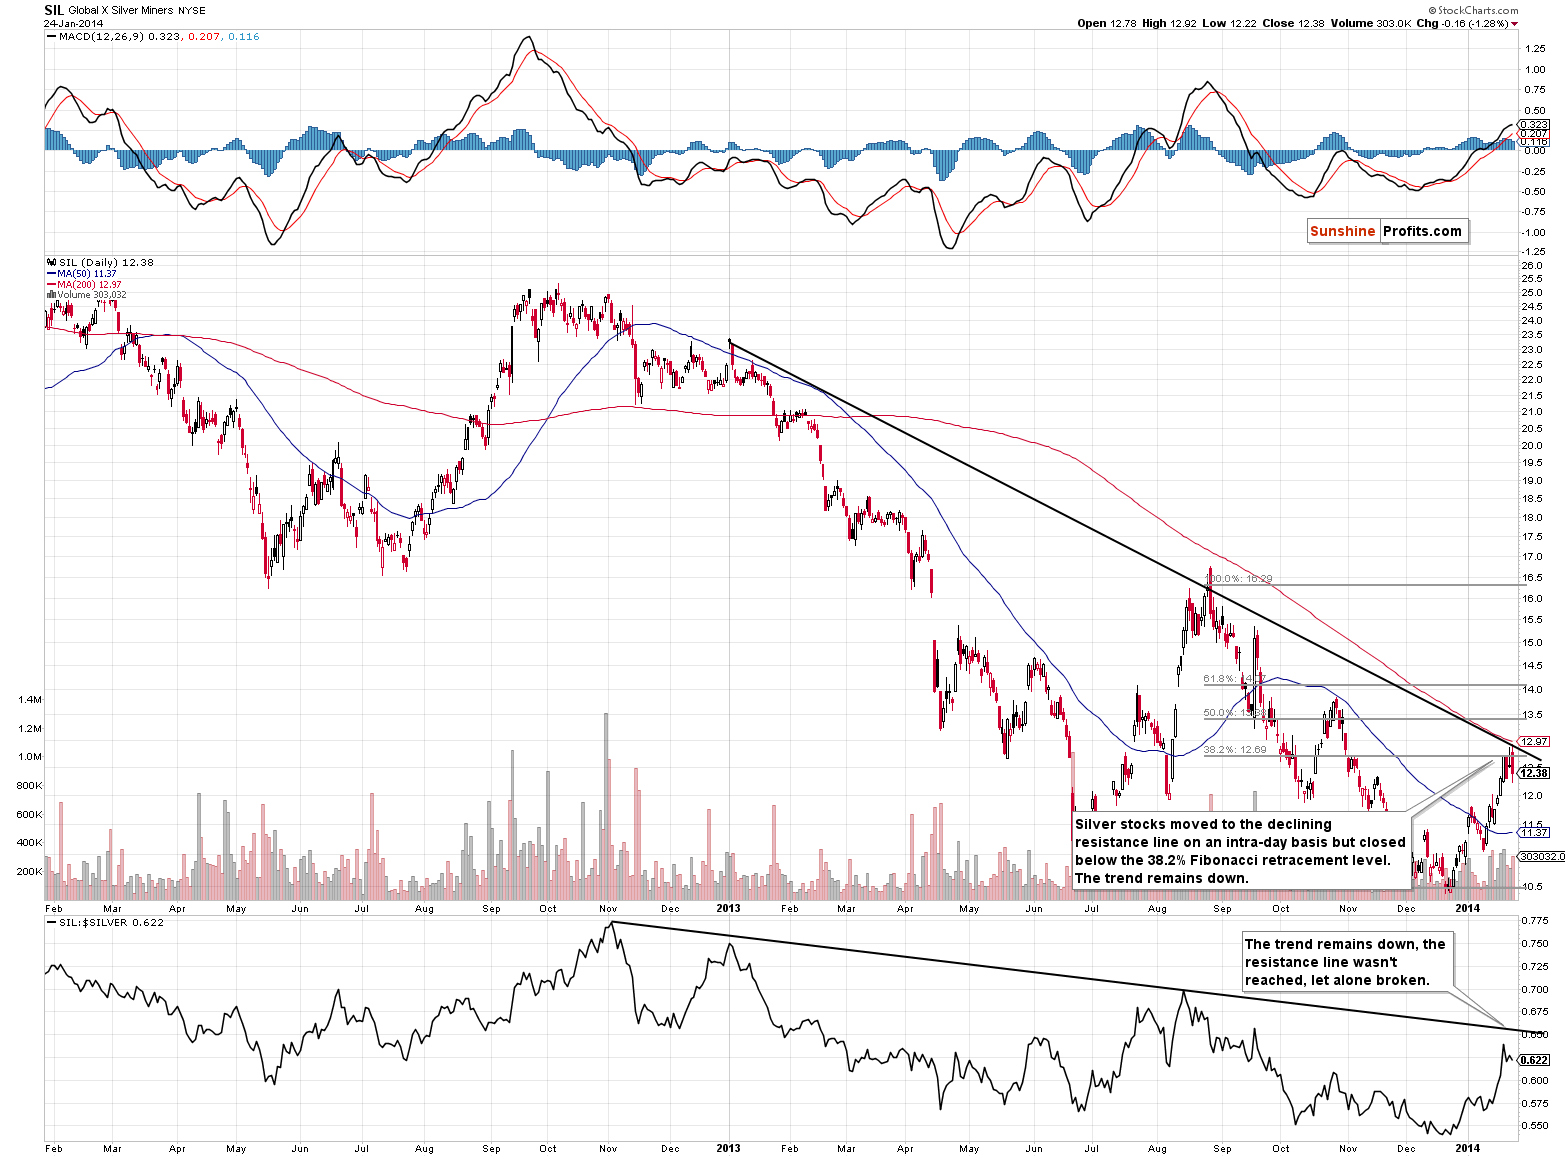
Silver stocks remain in a downtrend and the situation is very similar to what we described based on Thursday’s closing prices, but we would like to stress that we saw yet another failed attempt to move above the 38.2% Fibonacci retracement level. The declining resistance line remains in place and intra-day rallies didn’t manage to take silver stocks above the declining resistance line.
The declining resistance lines (for silver stocks, and for their ratio to silver, which you can see in the lower part of the chart) were not broken and the trend remains down also from this perspective.
There is no doubt that a significant, counter-trend daily slide in the USD Index was one of the factors contributing to higher precious metals prices on Thursday and also – to a smaller extent – on Friday.
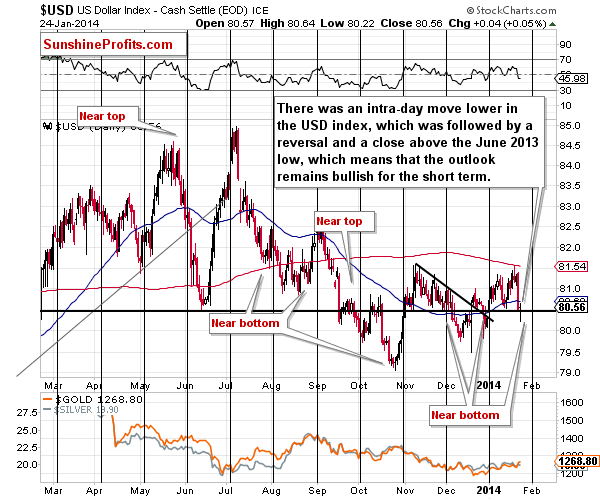
The USD Index but moved temporarily below the horizontal support level created by the June 2013 low. We saw a move back above this line before the session was over, so we now have an invalidation of the breakdown, which is a bullish sign. The medium- and long-term trends are up, so it’s quite likely that the big surprises will be to the upside – please note that overall it’s been the case since late October 2013.
Naturally, if the USD Index rallies strongly, it will likely serve as a trigger for a decline in precious metals.
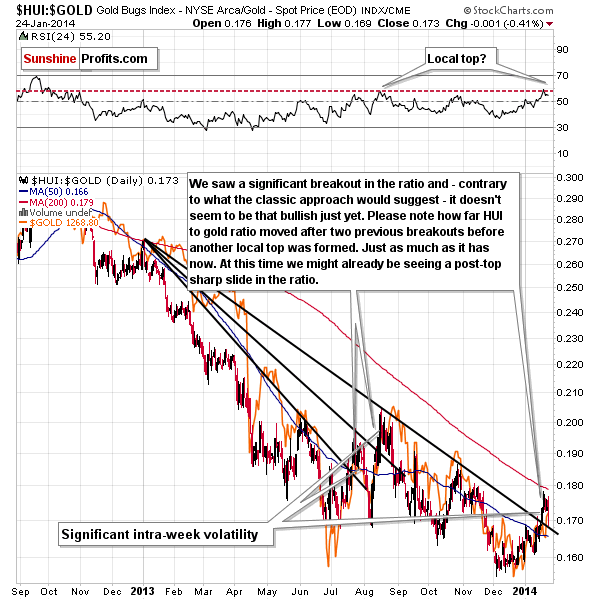
The gold stocks to gold ratio behaves just like it did after 2 previous fake breakouts – we saw some volatility without a decisive move lower in the entire sector. Previously it had just been a matter of time before such a move occurred, so it could very well be the case also this time.
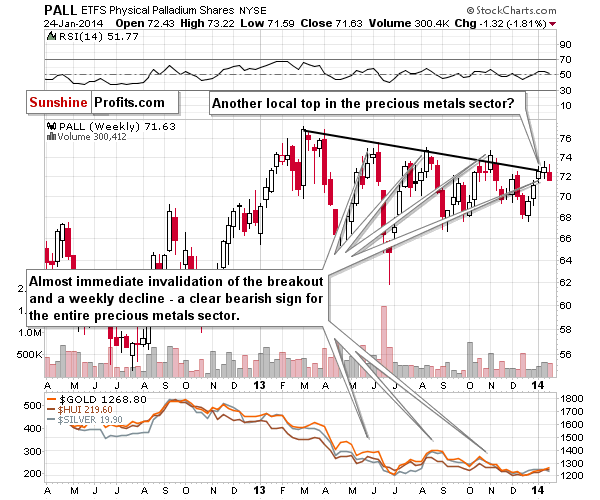
We previously wrote that local tops in palladium often mean local tops in the rest of the precious metals sector and we’ve drawn a resistance line, which usually marks a local top (or it signals that one is near). This bearish signal is in place once again.
In other news, we were asked to comment on the outcome of the recent survey conducted among precious metals analysts: 59.09% were bullish, 22.73% were bearish and 18.18% were neutral. The most recent short-term move was up, and its natural for sentiment to increase after an upswing. However, the medium-term trend was not invalidated and it remains down. The sentiment itself doesn't signal much at this time - it's neither extremely bullish, nor extremely bearish and only these two states would have any implications.
Summing up, taking all of the above into account, we arrive at the conclusion that it’s a good idea to use a small part of your speculative capital to trade the (likely) coming decline in precious metals. If we see a confirmation of the bearish case (for instance, a decline on strong volume), we will likely suggest adding to the position. Naturally, in case of an invalidation of the bearish outlook, we will keep you informed as well.
To summarize:
Trading capital: Short position (half) in: gold, silver and mining stocks. We are planning to profit on a significant downswing, so the stop-loss orders will not be that close (however, if something invalidates the bearish outlook, we will let you know ASAP, even if stop loss orders are not reached).
Stop loss orders for the above-mentioned short position:
- Gold: $1,307
- Silver: $21.20
- GDX ETF: $27.20
Long-term capital: No positions.
As always, we'll keep you - our subscribers - updated should our views on the market change. We will continue to send out Gold & Silver Trading Alerts on each trading day and we will send additional Alerts whenever appropriate.
The trading position presented above is the netted version of positions based on subjective signals from your Editor, and the automated tools (SP Indicators and the upcoming self-similarity-based tool).
As a reminder, Gold & Silver Trading Alerts are posted before or on each trading day (we usually post them before the opening bell, but we don't promise doing that each day). If there's anything urgent, we will send you an additional small alert before posting the main one.
Thank you.
Sincerely,
Przemyslaw Radomski, CFA

