Briefly: In our opinion speculative long positions (full) in gold, silver and mining stocks are justified from the risk/reward perspective.
Gold rallied $32 last week, but gold stocks didn’t follow despite a daily show of strength. In fact, the HUI Index moved 0.41% lower. Strong underperformance of gold stocks has often indicated local tops in the past. Is this the case also this time?
In short, our Friday’s alert already answered the above question. What we wrote about the daily movements, applies also to the weekly performance. It seems that the corrective upswing in the precious metals sector is not over yet, and gold stocks’ poor performance can be, to a great extent, attributed to the declines in the general stock market. Let’s take a look at the charts (charts courtesy of http://stockcharts.com).
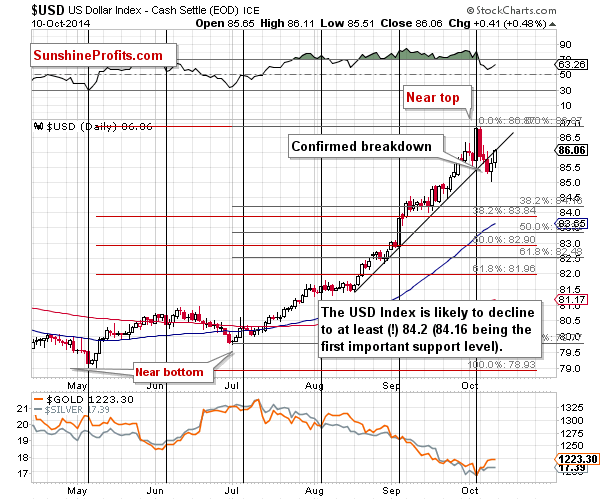
On Friday, we wrote the following:
The breakdown is still not confirmed, but unless the USD Index rallies and closes above 86 today – it will. The next week would begin with a confirmed breakdown and with a much more negative outlook.
The USD indeed closed above the 86 level, but in the above comments the 86 level is used as an approximation – the breakdown would’ve been invalidated if the USD had closed with a move back above the rising support/resistance level. This was not the case – the USD Index closed at the resistance level, but not above it. Consequently, the breakdown was not invalidated and the implications are bearish for the USD Index and bullish for the precious metals market. In fact, we are already seeing a pre-market rally today.
Our other comments about the USD Index remain up-to-date as well:
How low can the USD Index move during the corrective downswing? It could decline to 82 (81.96 is the 61.8% Fibonacci retracement based on the May - October rally), but the decline could end as soon as the USD reaches 84.2 or so (84.16 is the 38.2% Fibonacci retracement based on the July – October rally). Either way, the USD Index is quite likely to decline at least by additional 1.4 index points, which is quite a lot. Even if the USD declines to 84.2 and bottoms, this decline would still be likely to trigger a bigger upswing in the precious metals sector.
Why? Because gold, silver, and mining stocks are negatively correlated with the dollar in the short term.
Generally, everything that we wrote about the correlations and their implications remains up-to-date:
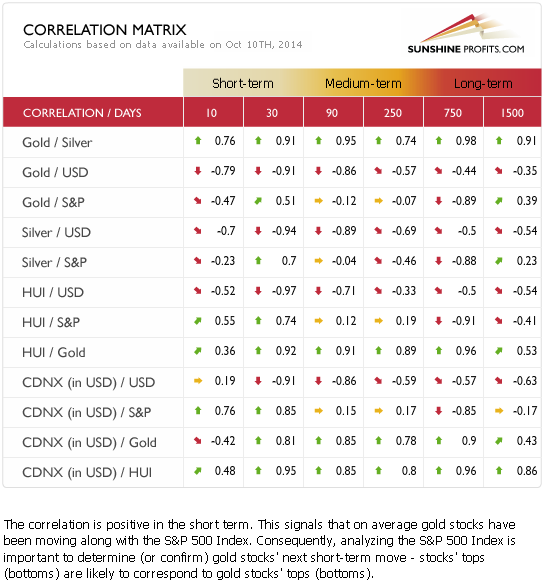
The Correlation Matrix is a tool, which we have developed to analyze the impact of the currency markets and the general stock market upon the precious metals sector. In the short-term (30 trading days) column we see values very close to -1 in case of gold/USD, silver/USD, and HUI/USD correlations. Consequently, the markets are very strongly negatively correlated, and a move lower in the USD is quite likely to impact precious metals in a positive way.
Moreover, please note that the correlation between the stock market and silver (0.73) and between the HUI and the stock market (0.72) is visibly higher than it is between the stock market and gold (0.55). Consequently, it shouldn’t surprise us that miners and silver have not performed so well recently – stocks have been declining. Once stocks bottom, it seems that silver and gold stocks will catch up with gold.
Having said that, let’s take a look at the yellow metal. Again, our previous comments remain up-to-date, as gold didn’t move much on Friday:
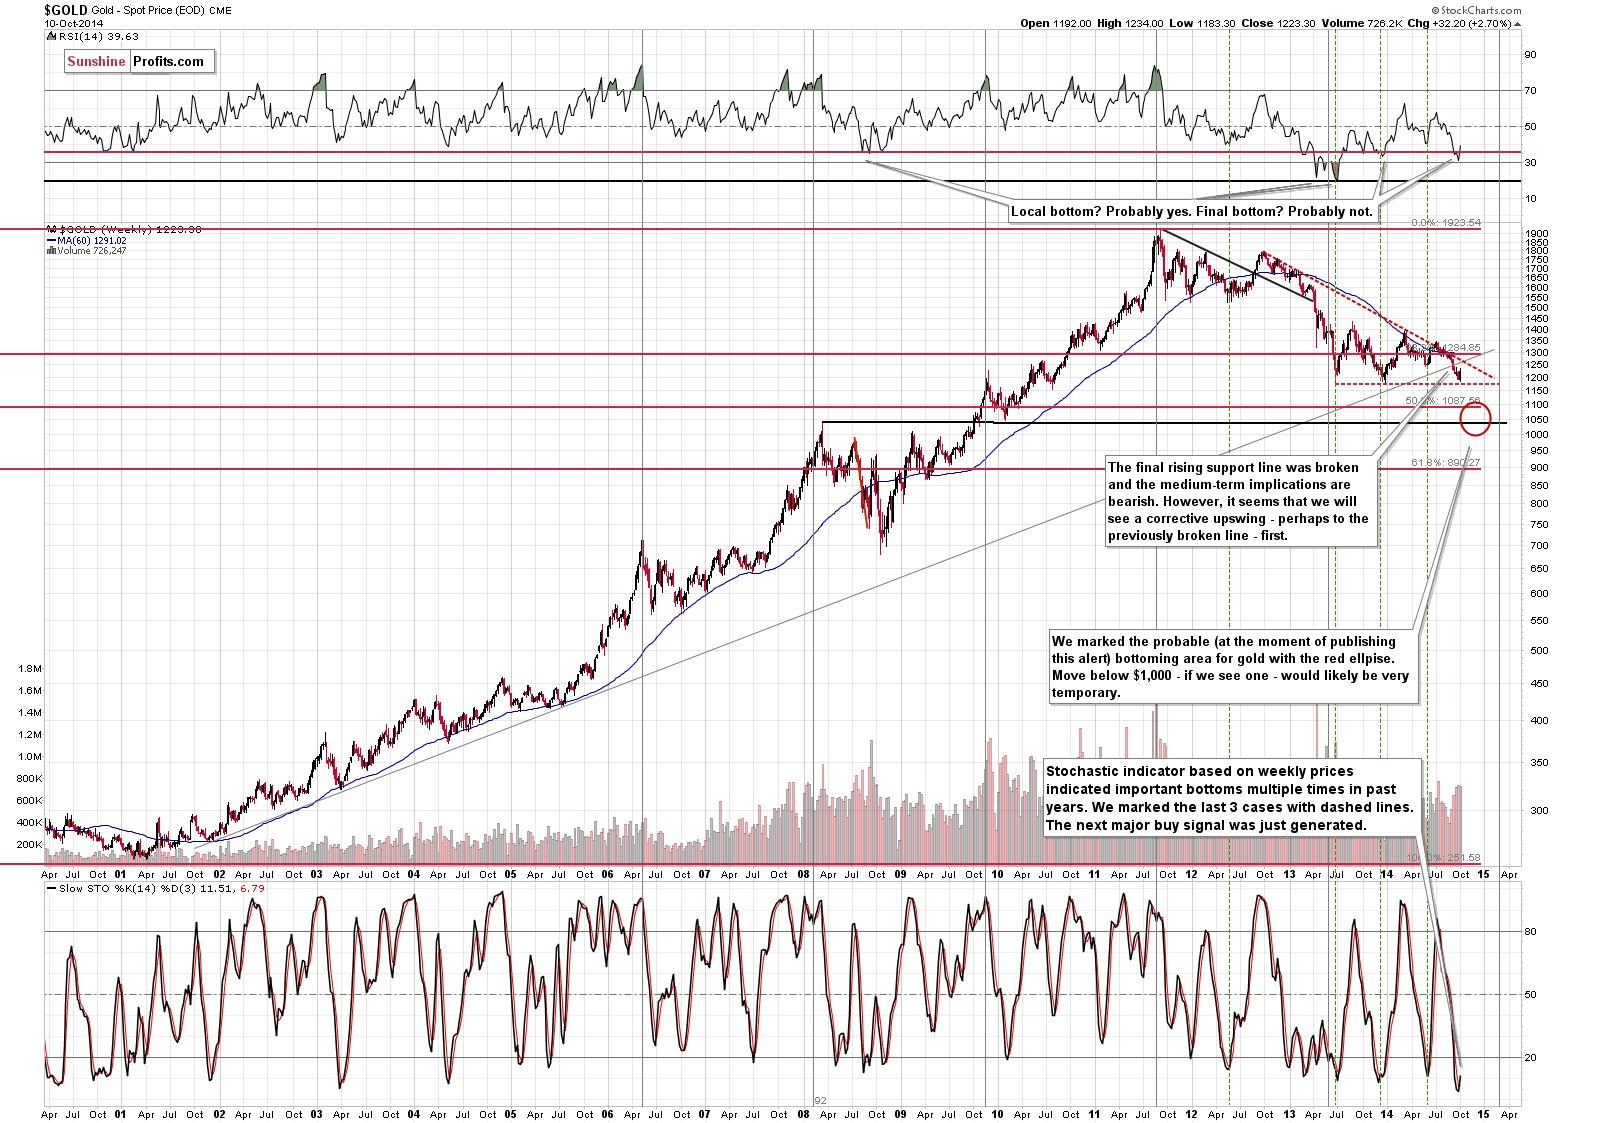
The question that we would like to reply to in today’s alert is how high gold is likely to move during this corrective upswing. In our opinion, it’s quite likely to rally to the combination of resistance levels: the long-term rising (grey) line and the declining red dashed line. These lines intersect just a little above the $1,250 level, so it seems to makes sense to expect the next local top to form there. Please note that this is based on the information that we have available today. It will be crucial to monitor the USD Index and its link with gold to determine whether a top is indeed being formed or not. If we don’t see bottoming action in the USD Index, but gold reaches the above-mentioned resistance levels, it might not be the final top for gold. We will keep our eyes opened and report to you accordingly.
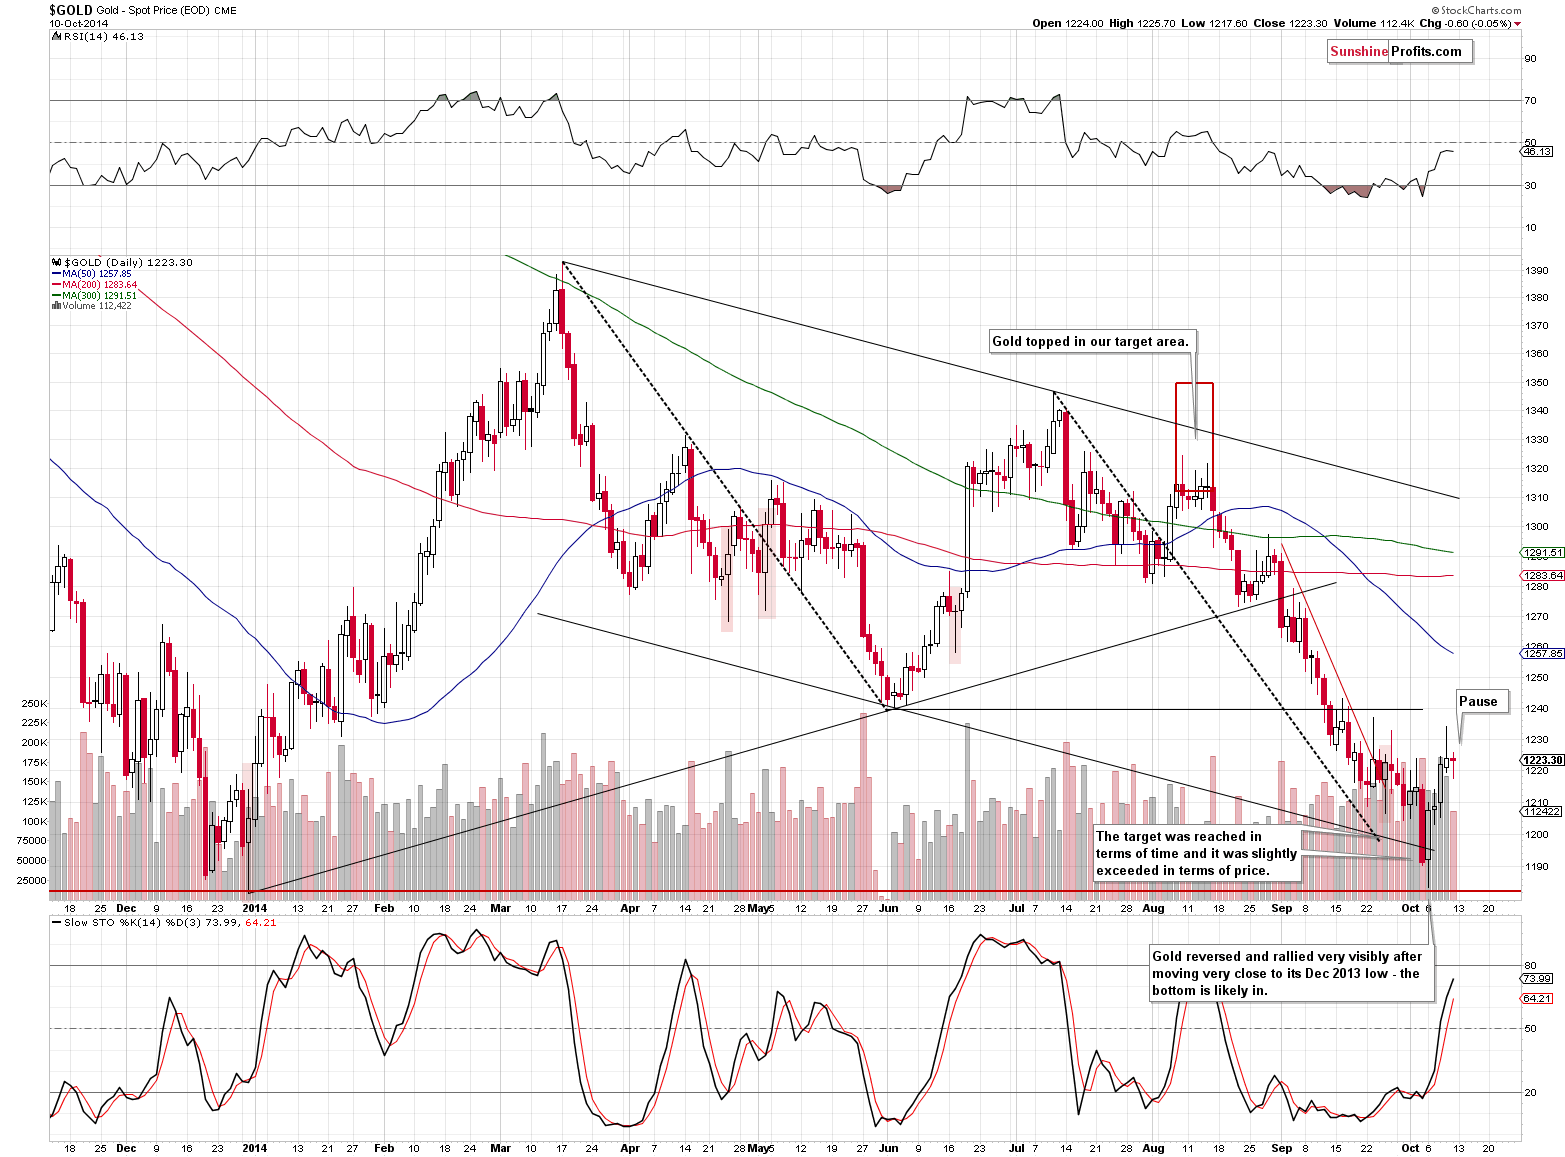
From the short-term point of view, gold paused. There were no sell signals on Friday – the short-term uptrend seems to remain in place.
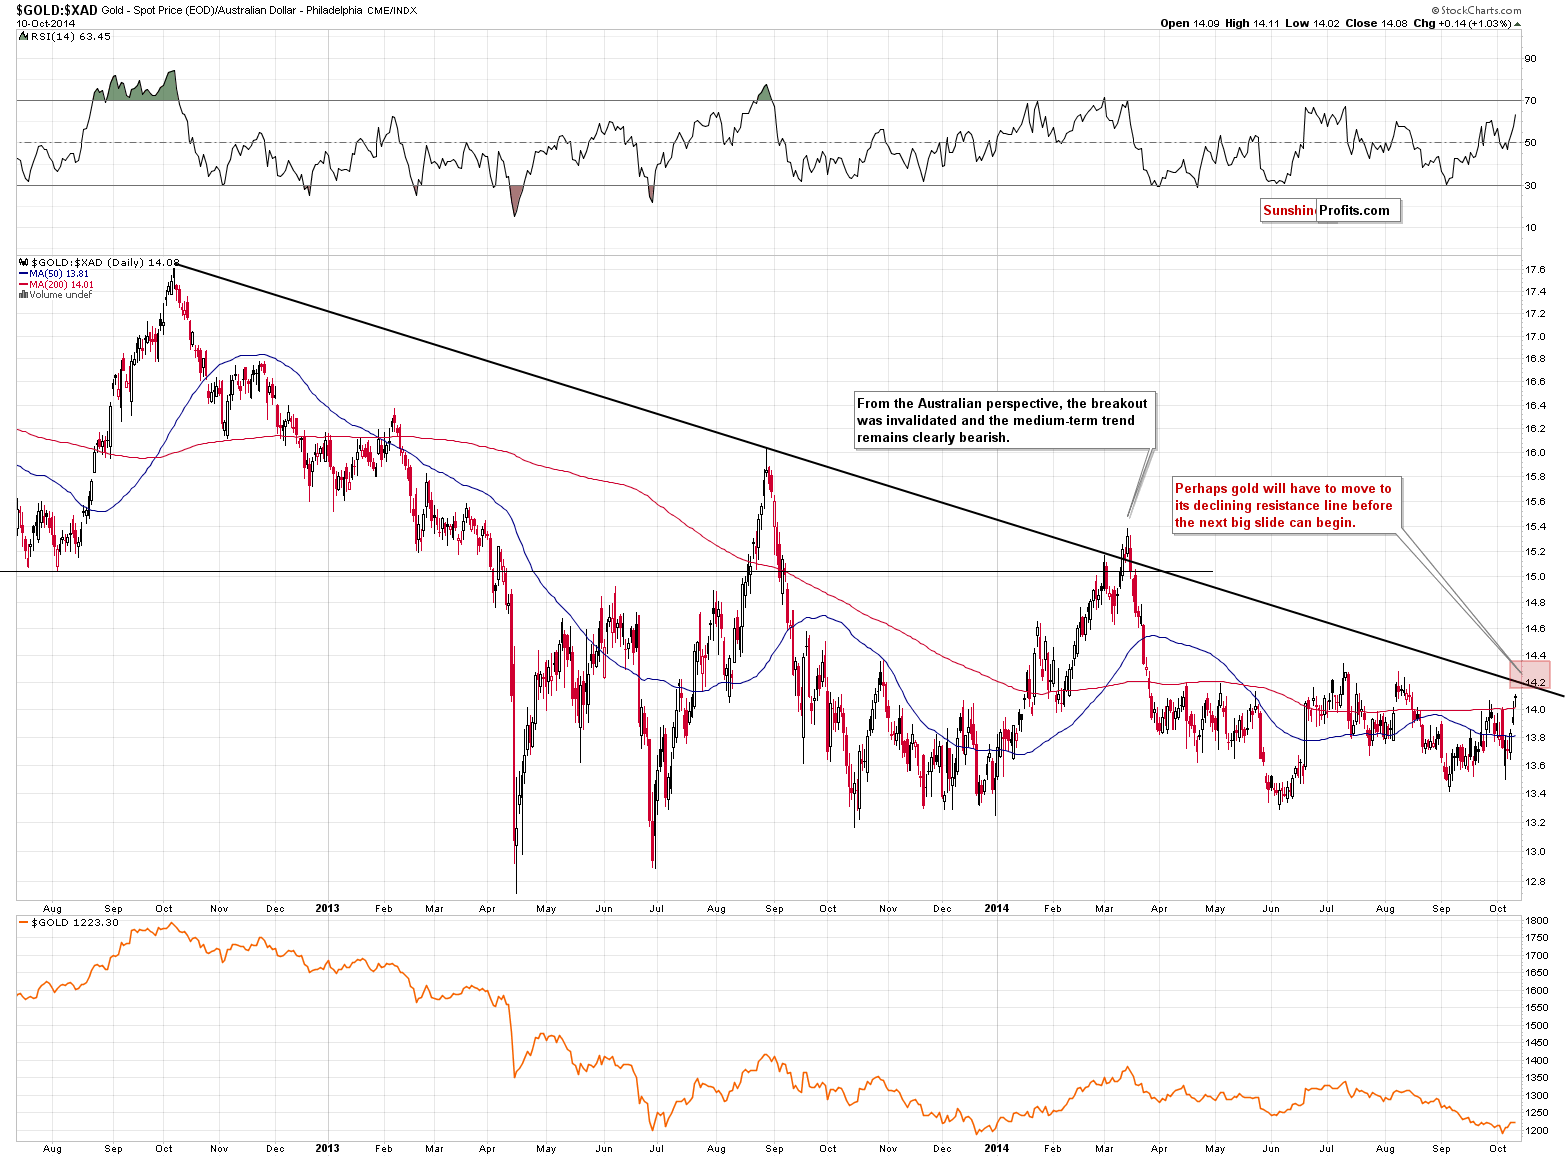
In Friday’s alert, we commented on gold’s price seen from the Australian perspective.
We wrote the following:
When we take a look at gold priced in the Australian dollar, we see a rather straightforward picture. There is a big declining resistance line that might stop or delay any rallies. At least, that’s been the case so far this year. To be precise – in March, gold moved slightly above this line, but it plunged shortly thereafter. In case history rhymes also this time, we drew the target area at and slightly above the declining resistance line. Either way, it’s rather close, so we are quite likely to see a pause or top rather soon.
Gold moved closer to the target area, but it’s not in it yet, so it doesn’t seem that the rally is over.
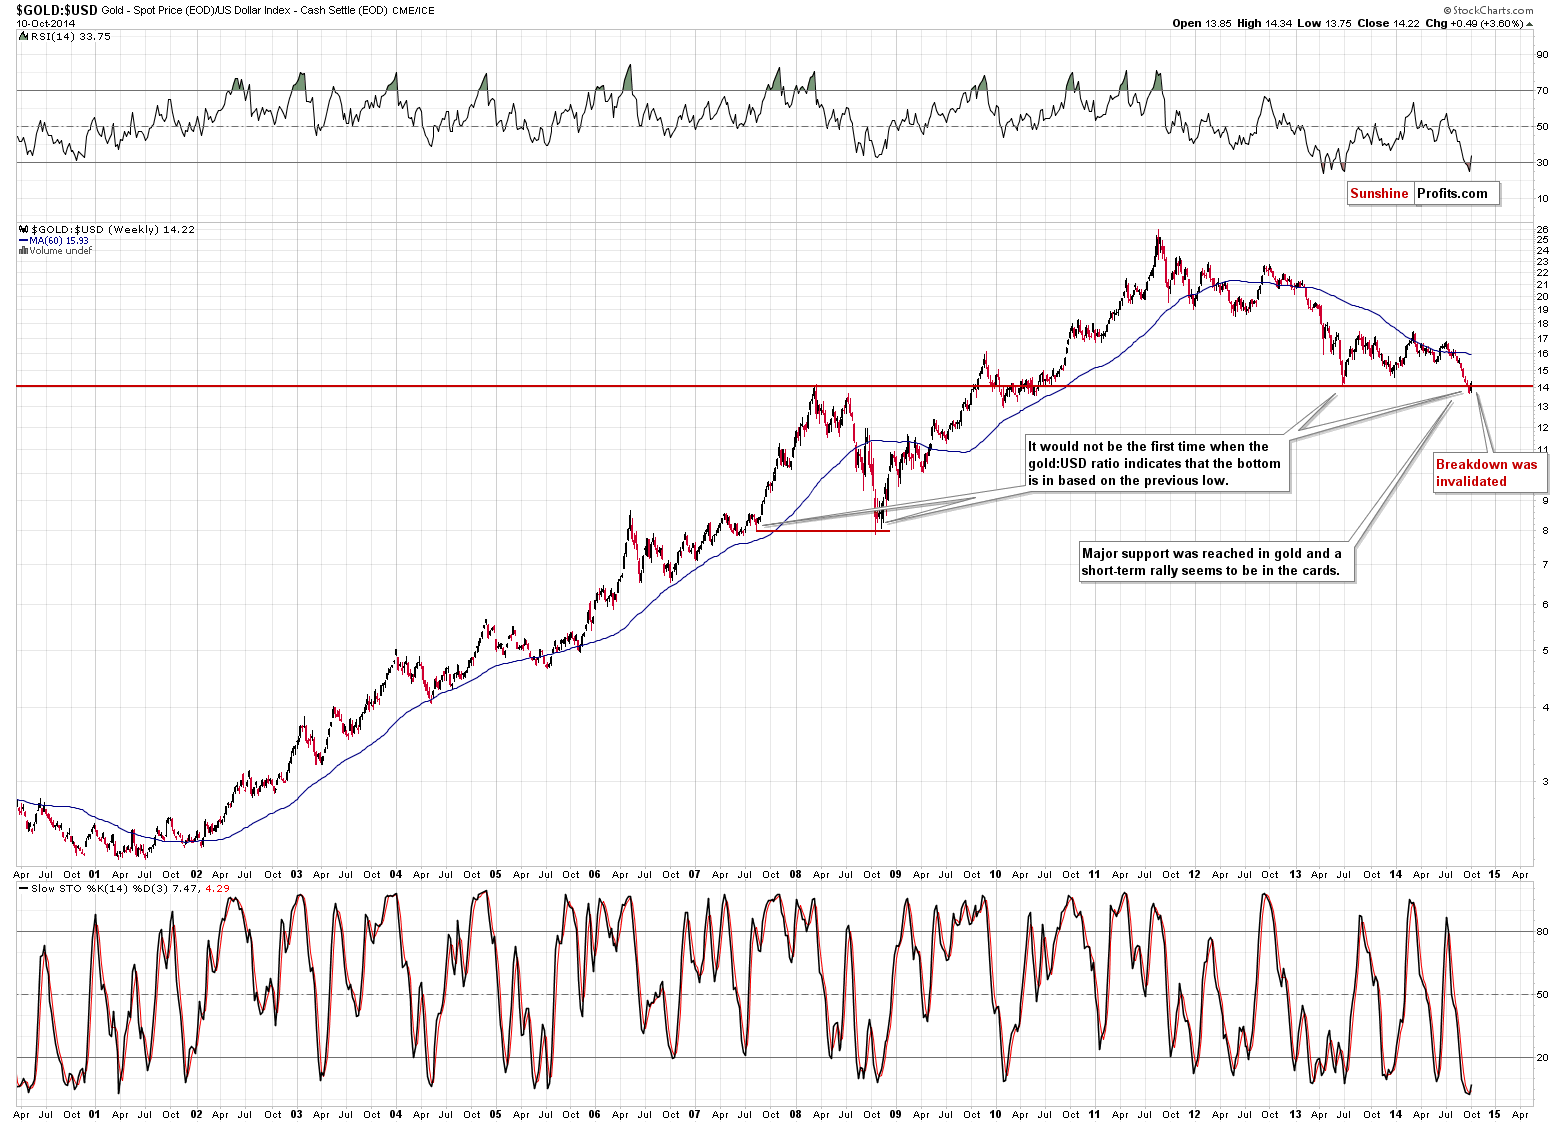
Before we move to silver and mining stocks, we would like to comment on an additional chart that we’ve featured recently. The ratio of gold to the USD Index.
In the Oct. 7 Gold & Silver Trading Alert, we wrote the following:
We recently commented about the gold to USD Index ratio as something that could provide us with technical confirmations. Based on Friday’s and today’s price moves we saw a small decline below the 2008 high (and 2013 low) that was followed by another move higher. Before viewing the decline as a breakdown, please note that back in 2008 the ratio also moved very temporarily below the horizontal support only to invalidate this move and rally shortly thereafter. It seems that we are seeing this type of action once again.
The move below the horizontal support was just invalidated. This is a bullish sign and the bullish analogy to 2008 remains in place.
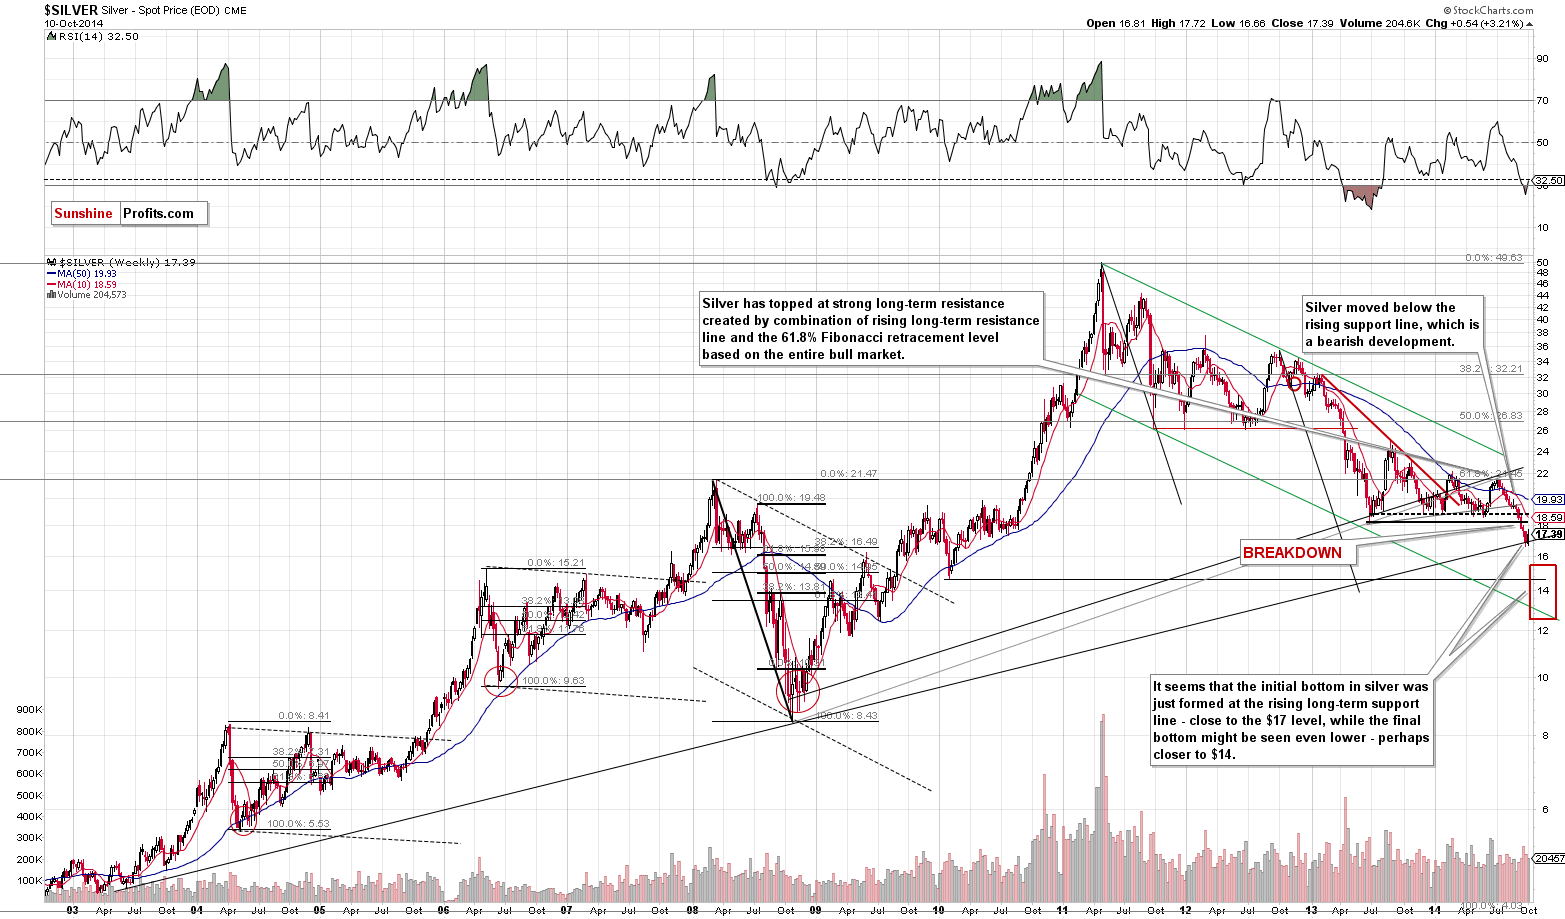
The situation in silver is also unchanged from what we saw on Friday and our previous comments remain up-to-date:
As you can see on the above chart, the situation in silver hasn’t changed much recently. The white metal seems to have bottomed at the long-term rising support line and the correction seems to be under-way. How high is silver likely to move before it declines once again? It’s a particularly tough call in case of this part of the precious metals sector as it can be, and is, very volatile at times, however, it seems that it could move to its 2013 low or the previous 2014 lows. Consequently, $18 - $18.50 is our target area based on the information that we have available today. Just as it is the case with gold, it will be crucial to consider the situation in the USD, before making trading / investment decisions regarding silver.
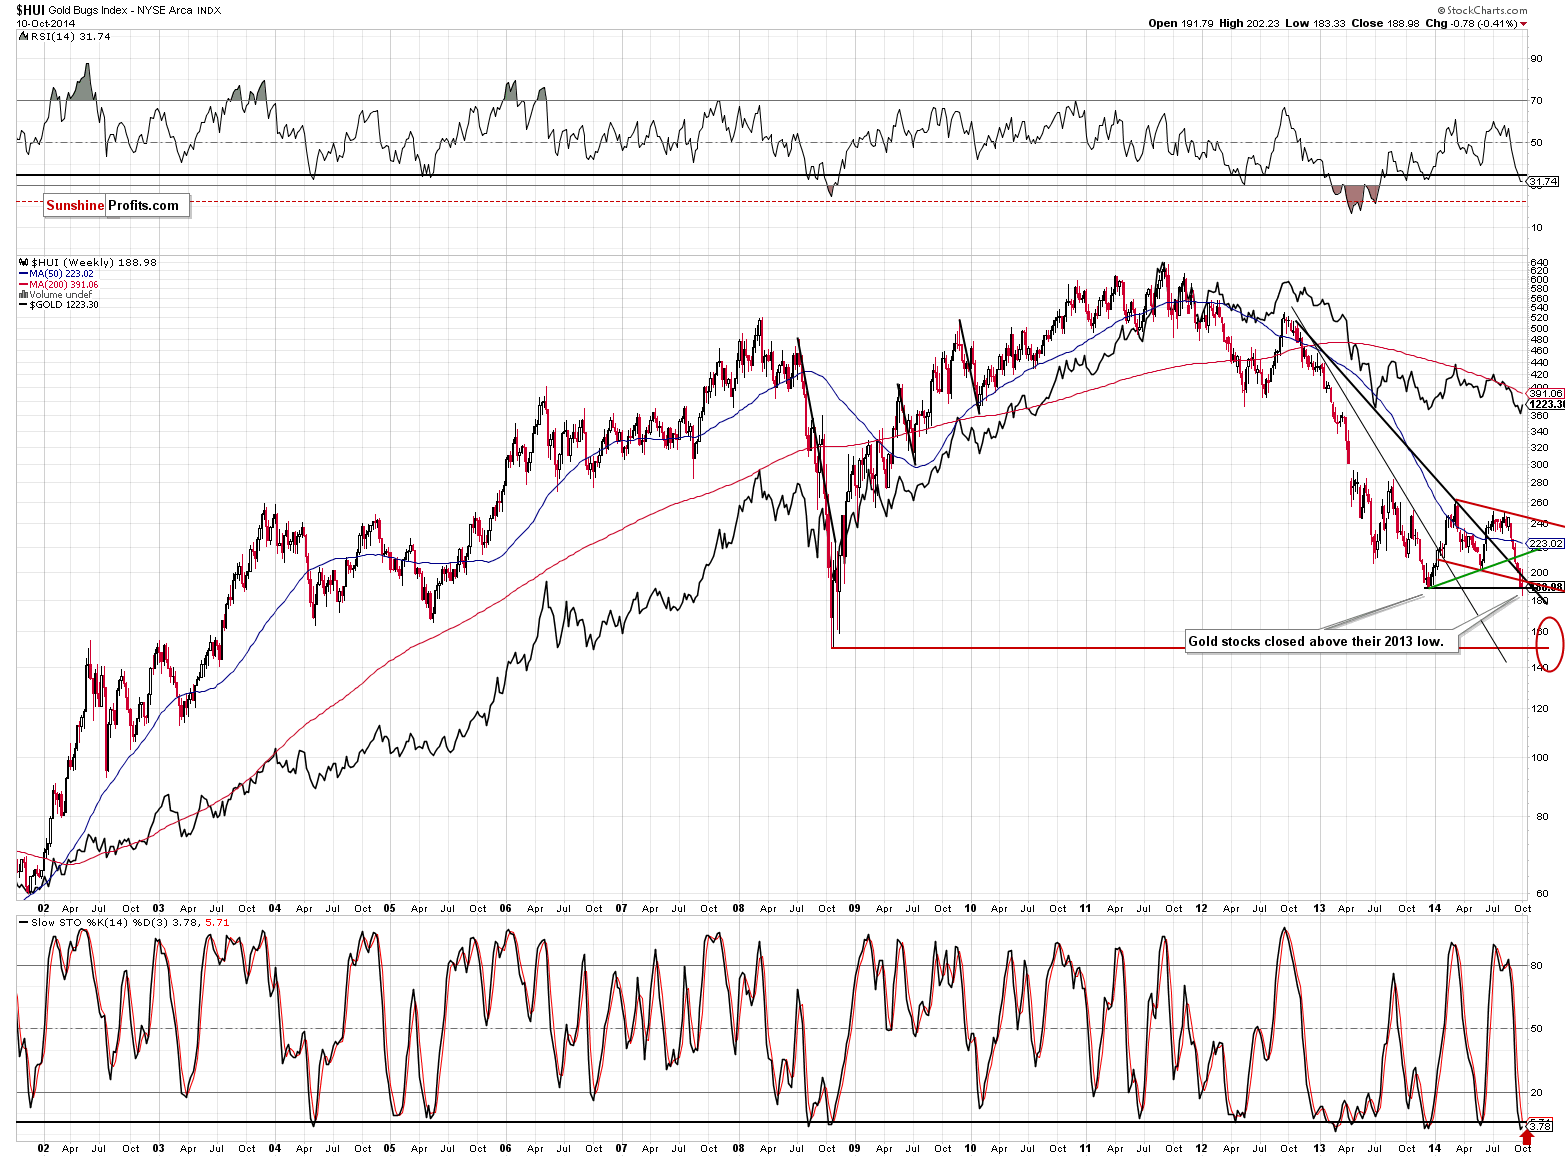
Gold stocks moved substantially on a day-to-date basis, but looking at the entire week, we get a picture in which almost nothing changed. The HUI Index moved only 0.41% lower. Is this really a bearish sign given gold’s rally? Not necessarily – there was a good reason for miners to underperform, and it was a big decline in the general stock market. When stocks move higher again, miners (and silver) will be likely to catch up with gold.
The important thing about the HUI Index is that it closed above the 2013 low. Last week’s temporary move below it is not really concerning because of that.
How high can the HUI Index go (before moving lower again) based on the information that we have today? To approximately 213-215, in our opinion. That’s where the rising, green support line is. Again, the above could change and we will keep you – our subscribers – informed.
Overall, we can summarize the situation in the precious metals market in the same way as we did on Friday:
Summing up, it seems that the corrective downswing in the USD Index and the corrective upswing in the precious metals market are underway. In our opinion, it seems to be a good idea to use speculative capital to profit from these moves. Today’s alert features our estimations of where the next local tops might be in gold, silver and mining stocks, but there are still quite a few unknowns, especially in the case of the USD Index. The price targets that we provide below are “initial” meaning that they are based on our estimations at this time. We will monitor the situation and will let you – our subscribers – know (we will send a confirmation) when we think it’s a good idea to exit the current long position and take profits off the table.
A lot of money had been saved by staying out of the precious metals market in the past months with one’s long-term investments (that is if one followed our suggestions; details below), and additional gains have been made on the recent speculative short positions. The corrective upswing that we are already seeing will likely provide additional profits from the trading capital.
As always, we will keep you – our subscribers – updated and informed.
To summarize:
Trading capital (our opinion):
It seems that having speculative (full) long positions in gold, silver and mining stocks is a good idea:
- Gold: stop-loss: $1,172, initial target price: $1,249, stop loss for the UGLD ETF $11.29, initial target price for the UGLD ETF $13.56
- Silver: stop-loss: $16.47, initial target price: $18.07, stop loss for USLV ETF $23.94, initial target price for the USLV ETF $31.73
- Mining stocks (price levels for the GDX ETF): stop-loss: $19.94, initial target price: $23.37, stop loss for the NUGT ETF $18.25, initial target price for the NUGT ETF $28.99,
In case one wants to bet on higher junior mining stock ETFs, here are the stop-loss details and initial target prices:
- GDXJ stop-loss: $28.40, initial target price: $37.14
- JNUG stop-loss: $6.19, initial target price: $16.34
Long-term capital (our opinion): No positions
Insurance capital (our opinion): Full position
Please note that a full position doesn’t mean using all of the capital for a given trade. You will find details on our thoughts on gold portfolio structuring in the Key Insights section on our website.
Our preferred ways to invest in and to trade gold along with the reasoning can be found in the how to buy gold section. Additionally, our preferred ETFs and ETNs can be found in our Gold & Silver ETF Ranking.
As always, we'll keep you - our subscribers - updated should our views on the market change. We will continue to send out Gold & Silver Trading Alerts on each trading day and we will send additional Alerts whenever appropriate.
The trading position presented above is the netted version of positions based on subjective signals (opinion) from your Editor, and the automated tools (SP Indicators and the upcoming self-similarity-based tool).
As a reminder, Gold & Silver Trading Alerts are posted before or on each trading day (we usually post them before the opening bell, but we don't promise doing that each day). If there's anything urgent, we will send you an additional small alert before posting the main one.
Thank you.
Sincerely,
Przemyslaw Radomski, CFA
Founder, Editor-in-chief
Gold & Silver Trading Alerts
Forex Trading Alerts
Oil Investment Updates
Oil Trading Alerts


