

Briefly: In our opinion (full) speculative long positions in gold, silver and mining stocks are currently justified from the risk/reward perspective.
The USD Index soared much higher on Friday, well above the previous high. With the USD Index so high, it seemed odd that gold managed to close higher and the same went for mining stocks, which even outperformed the yellow metal. What’s even more significant, gold and miners showed the same strength yesterday. Is the rally in gold around the corner?
Actually, it could be the case. We have been aiming to profit on the next decline in the precious metals market after a confirmation of the market’s weakness, most likely after a correction and continuation of a rally in the USD Index. However, the USD Index is already very high – well above the 90 level and very close to the resistance at 92.33. Since gold is not declining (it’s actually rallying), it could be waiting for a bigger sign of weakness in the USD Index in order to start at a bigger short-term rally. Yesterday, we wrote that this meant that we might see an opportunity to go long very soon. It seems that yesterday’s session was the thing that was needed to push the risk/reward ratio to the levels justifying opening a long position. Let’s see why and start with the USD Index chart (charts courtesy of http://stockcharts.com).
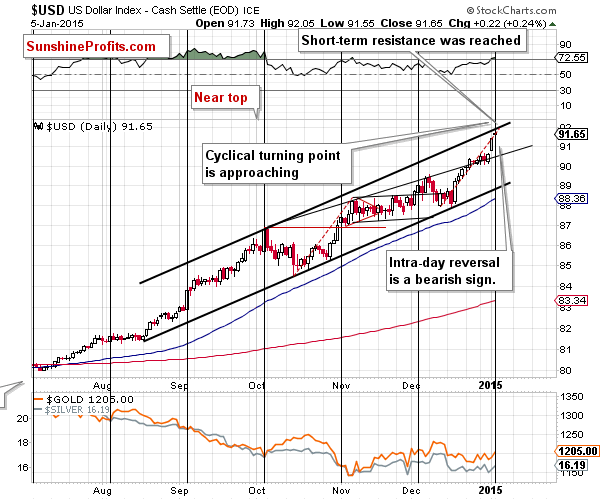
The USD Index moved higher once again, which seems bullish, but:
- The RSI indicator is as overbought as it was in early November 2014, when we saw a local top.
- The cyclical turning point is here and the previous move was definitely up.
- The mid-Dec. rally is just as big as the mid-Oct. – Nov. one, which suggests that this rally may be already over or close to being over.
- We just saw an intra-day reversal.
The above is a bearish combination for the short term.
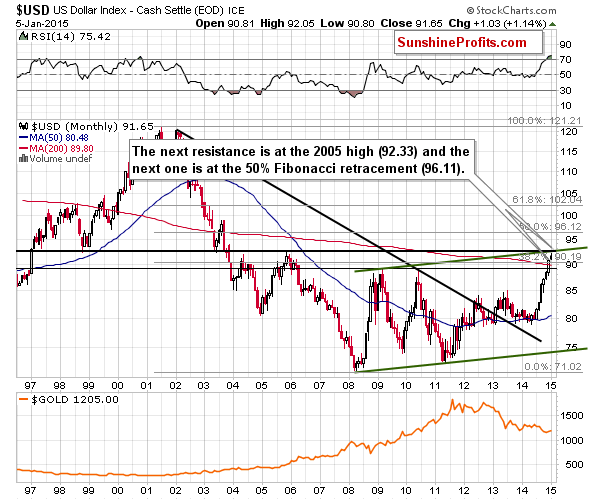
The combination of both long-term resistance levels was almost reached yesterday. The USD Index moved to the 92.05 level, which is only 0.28 below the 92.33 level – the 2005 high. The USD Index could move even higher, but there is little room for further gains before a correction / decline.
Combining the implications of both charts suggests that we will either see a local top in the USD Index very soon or that it’s already in.
More importantly, for us – precious metals investors and traders – gold has already started to respond positively without waiting for the final “go” signal (the USD’s decline). This increases the odds of a rally in gold in the coming days.
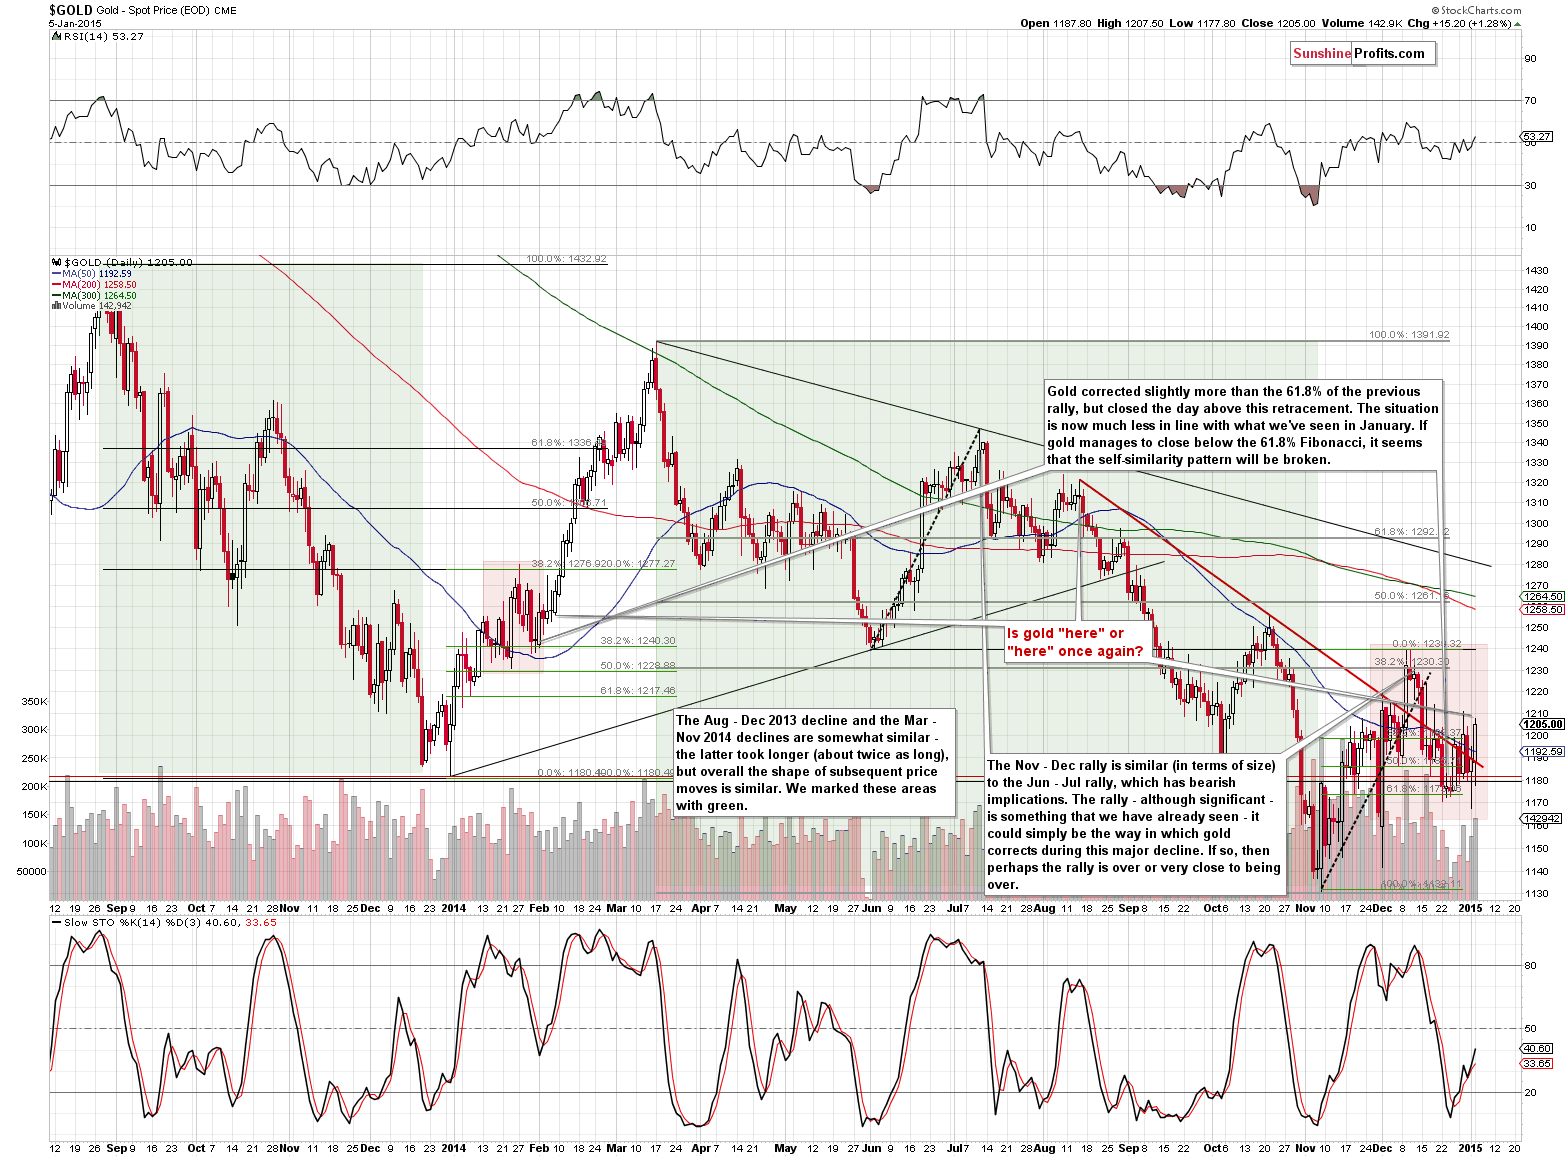
On the short-term chart we see self-similar patterns. In a way, gold looks like it’s about to rally as what happened in the areas marked with red rectangles is similar and both red areas follow green areas that are also similar to one another. The more recent decline (green area) took more time than the previous one, so it’s no wonder that the post-decline consolidation took more time as well. Please note that in both cases we saw gold declining initially around the 50-day moving average, then rallying some more (above the previous high) and then a decline that didn’t take gold below the first local low. In Feb. 2014, gold rallied shortly thereafter. Consequently, the implications are bullish.
The second similarity has bearish implications. The June – July 2014 rally was similar in size to the November – December 2014 rally, which is a small suggestion that the rally is already over.
In our opinion, the former is a much stronger analogy and the overall implications for the short term are bullish. Please note that back in August 2014 (which is where gold “would be” if the Jun. – Jul. rally was analogous to the Nov. – Dec. one), the USD Index was not rallying, so gold was not showing strength but not declining. Back then, the USD Index formed a local bottom, while the opposite seems to be the case at this time.
How high could gold go? Probably at least to the previous local top, close to the $1,250 level, which is also where the declining medium-term resistance line is.
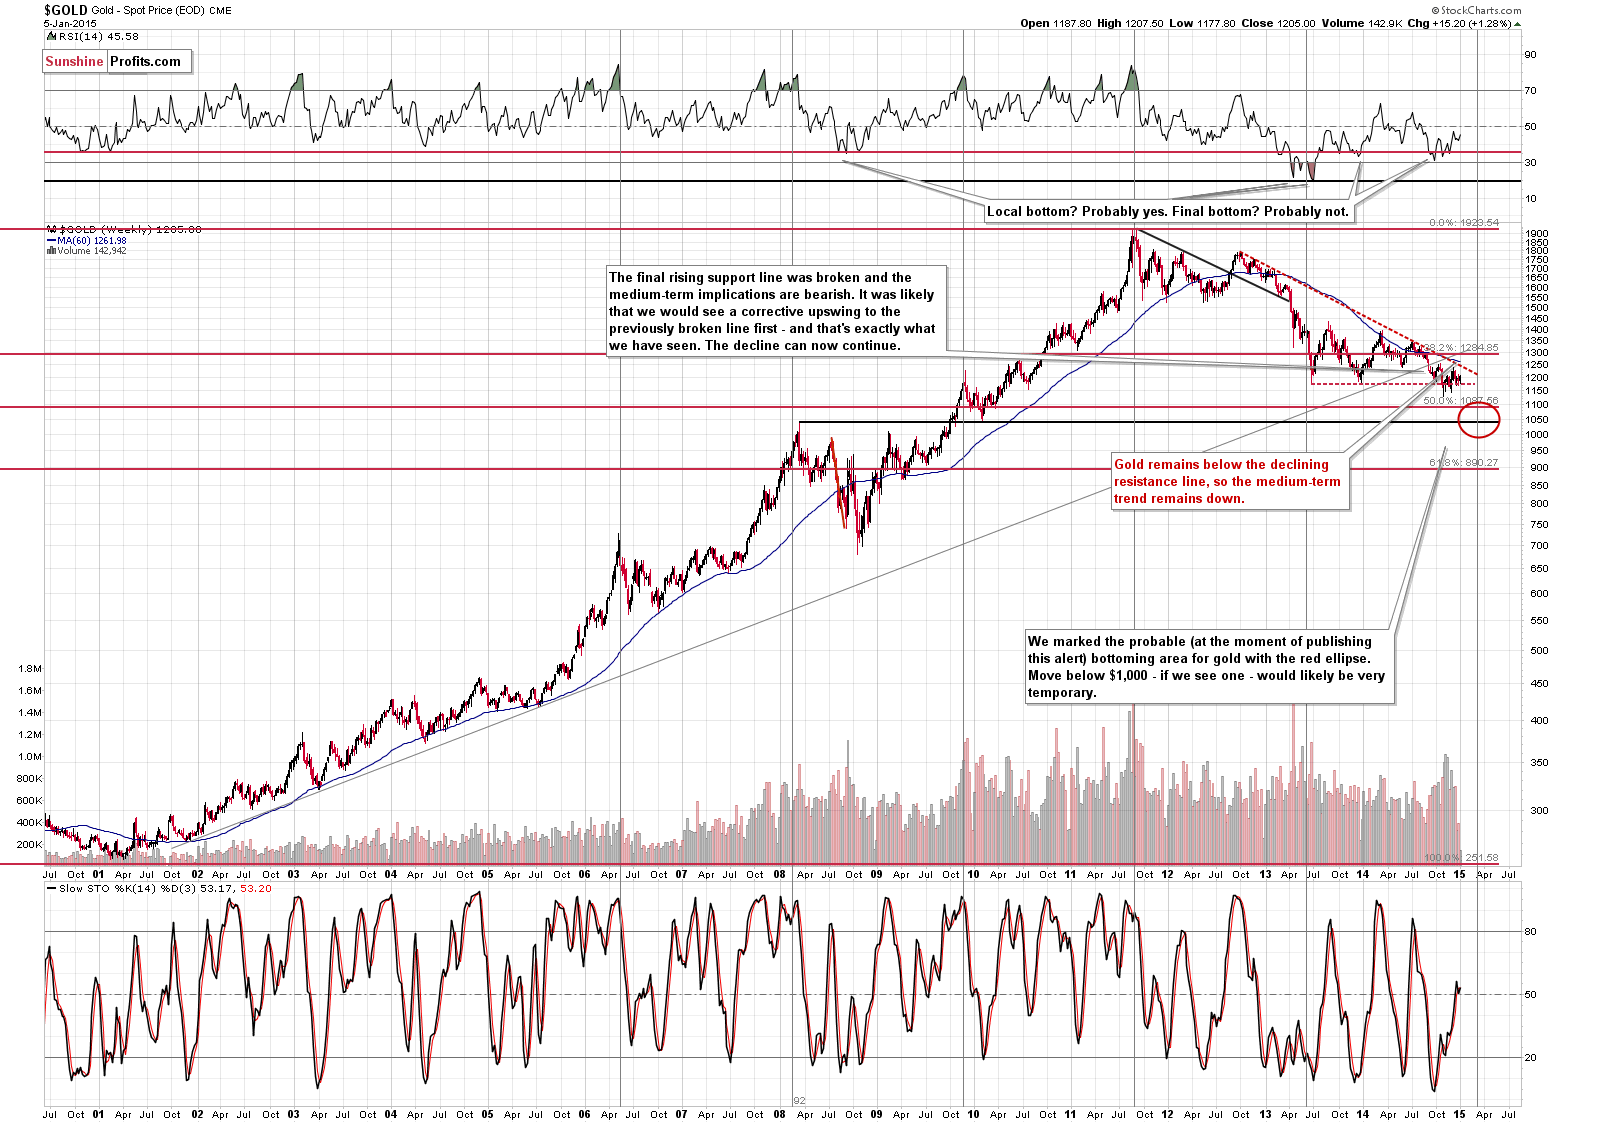
The medium-term trend remains down, so it doesn’t seem likely that the coming rally in gold would be anything more than a corrective upswing. Please note that even if we see a move above the declining resistance line, but we don’t see a confirmed breakout above the previously broken 38.2% Fibonacci retracement level (close to $1,285), the medium-term trend will still remain down.
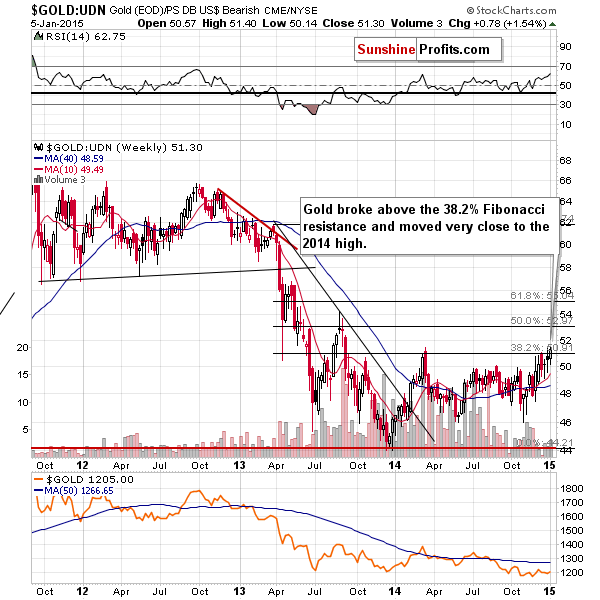
The price of gold is above the 38.2% Fibonacci retracement level from the non-USD perspective, which is a bullish sign. It’s not above the 2014 high, though, which means that the bullish implications are not very strong. A breakout from this perspective will serve as a bullish confirmation.
In yesterday’s alert we wrote the following regarding mining stocks:
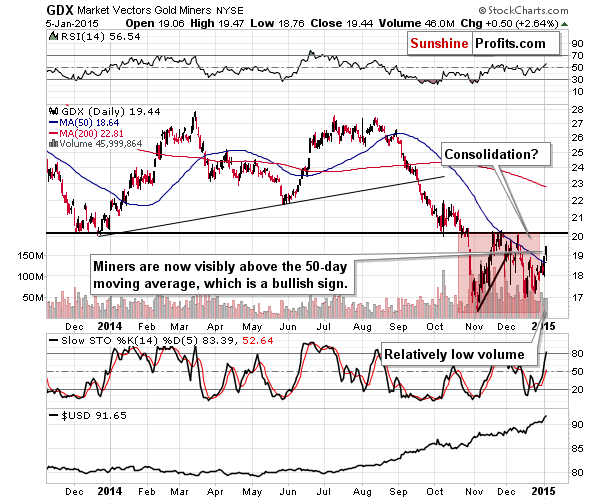
The situation in the GDX ETF is rather tense because of 2 things. The first thing is the fact that the 50-moving average was broken only insignificantly. As we wrote previously, that’s the average that has been stopping local rallies since late November. We now see a 5th attempt to move above it. The implications are bearish.
The other important thing is that mining stocks moved higher by over 3% on Friday, which is significant as gold rallied only a little and the USD rallied strongly. This is bullish. The only reason that it’s not very bullish is that the volume that accompanied Friday’s rally was relatively low – it was not a huge-volume rally that would confirm the strength of the move.
The GDX ETF is now more visibly above the 50-day moving average, which makes the outlook more bullish. It’s also bullish that miners rallied despite the general stock market’s decline yesterday.
Summing up, we just saw another day when gold rallied visibly despite a rally in the USD Index and in our opinion this made the situation bullish enough to justify opening long positions in the precious metals sector from the risk/reward perspective. The self-similar pattern in gold suggests that we will see more strength in the coming days and the miners’ ability to rally despite declining main stock indices is also a bullish factor. As always, we will be monitoring the market for additional signs and report to you – our subscribers - accordingly.
To summarize:
Trading capital (our opinion):
It seems that having speculative (full) long positions in gold, silver and mining stocks is a good idea:
- Gold: initial target level: $1,277; stop-loss: $1,179, initial target level for the UGLD ETN: $ 14.00; stop loss for the UGLD ETN $11.10
- Silver: initial target level: $17.46 ; stop-loss: $15.44, initial target level for the USLV ETN: $25.69 ; stop loss for USLV ETN $17.91
- Mining stocks (price levels for the GDX ETN): initial target level: $21.46 ; stop-loss: $18.38 , initial target level for the NUGT ETN: $17.14 ; stop loss for the NUGT ETN $10.93
In case one wants to bet on lower junior mining stocks' prices, here are the stop-loss details and initial target prices:
- GDXJ: initial target level: $28.96 ; stop-loss: $23.87
- JNUG: initial target level: $42.46 ; stop-loss: $23.84
Long-term capital (our opinion): No positions
Insurance capital (our opinion): Full position
Please note that a full position doesn’t mean using all of the capital for a given trade. You will find details on our thoughts on gold portfolio structuring in the Key Insights section on our website.
As a reminder – “initial target price” means exactly that – an “initial” one, it’s not a price level at which we suggest closing positions. If this becomes the case (like it did in the previous trade) we will refer to these levels as levels of exit orders (exactly as we’ve done previously). Stop-loss levels, however, are naturally not “initial”, but something that, in our opinion, might be entered as an order.
Since it is impossible to synchronize target prices and stop-loss levels for all the ETFs and ETNs with the main markets that we provide these levels for (gold, silver and mining stocks – the GDX ETF), the stop-loss levels and target prices for other ETNs and ETF (among other: UGLD, DGLD, USLV, DSLV, NUGT, DUST, JNUG, JDST) are provided as supplementary, and not as “final”. This means that if a stop-loss or a target level is reached for any of the “additional instruments” (DGLD for instance), but not for the “main instrument” (gold in this case), we will view positions in both gold and DGLD as still open and the stop-loss for DGLD would have to be moved lower. On the other hand, if gold moves to a stop-loss level but DGLD doesn’t, then we will view both positions (in gold and DGLD) as closed. In other words, since it’s not possible to be 100% certain that each related instrument moves to a given level when the underlying instrument does, we can’t provide levels that would be binding. The levels that we do provide are our best estimate of the levels that will correspond to the levels in the underlying assets, but it will be the underlying assets that one will need to focus on regarding the sings pointing to closing a given position or keeping it open. We might adjust the levels in the “additional instruments” without adjusting the levels in the “main instruments”, which will simply mean that we have improved our estimation of these levels, not that we changed our outlook on the markets. We are already working on a tool that would update these levels on a daily basis for the most popular ETFs, ETNs and individual mining stocks.
Our preferred ways to invest in and to trade gold along with the reasoning can be found in the how to buy gold section. Additionally, our preferred ETFs and ETNs can be found in our Gold & Silver ETF Ranking.
As always, we'll keep you - our subscribers - updated should our views on the market change. We will continue to send out Gold & Silver Trading Alerts on each trading day and we will send additional Alerts whenever appropriate.
The trading position presented above is the netted version of positions based on subjective signals (opinion) from your Editor, and the automated tools (SP Indicators and the upcoming self-similarity-based tool).
As a reminder, Gold & Silver Trading Alerts are posted before or on each trading day (we usually post them before the opening bell, but we don't promise doing that each day). If there's anything urgent, we will send you an additional small alert before posting the main one.
=====
Latest Free Trading Alerts:
On Friday, crude oil lost 1.68% as the combination of weak Chinese economic data, a stronger greenback and news of increased production in some regions weighed on the price. As a result, light crude extended losses and hit a fresh multi-year low. Will we see new lows in the coming days?
Oil Trading Alert: Oil Bears Still In Charge
=====
Hand-picked precious-metals-related links:
BullionVault’s Gauge of Client Buying Drops to Five-Year Low
Hedge Funds Resume Bullish Gold Bets as Greece Vote Looms
CHART: Gold price rallies into teeth of rabid dollar
=====
In other news:
Dow plunges 331 points as oil falls below $50
Samaras Faces Greeks Skeptical of His ‘Scare’ Scenarios
3 reasons the euro is plunging
Love Him or Hate Him, Ackman Now Runs the World’s Top Hedge Fund
=====
Thank you.
Sincerely,
Przemyslaw Radomski, CFA
Founder, Editor-in-chief
Gold & Silver Trading Alerts
Forex Trading Alerts
Oil Investment Updates
Oil Trading Alerts

