
In short: In our opinion, small (half) short positions in gold, silver, and mining stocks are still justified (no changes since yesterday).
Yesterday’s session was quite significant and we saw multiple interesting developments in the precious metals market. Let’s move right to them (charts courtesy of http://stockcharts.com.) Before we start – if you’re short on time, be sure to examine at least 2 last charts from this alert.
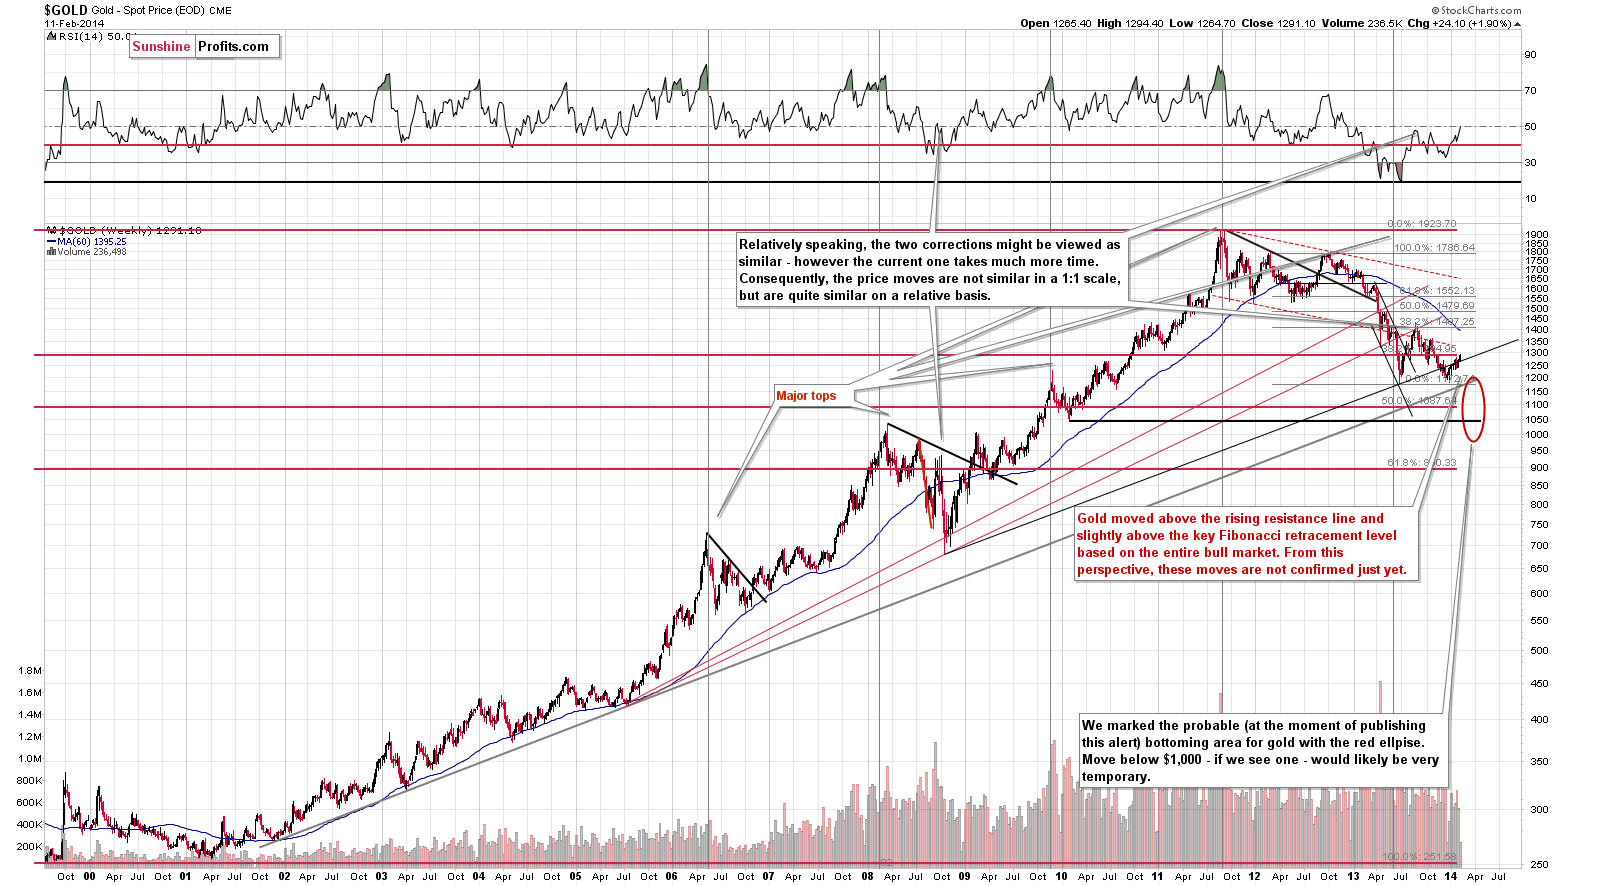
In yesterday’s alert we wrote that gold remained below the 38.2% Fibonacci retracement level based on the entire bull market, so the most important resistance level remained in place. We had previously stated that it would take a significant breakout above this level to change the medium-term outlook – and we have yet to see one.
Gold moved above the 38.2% Fibonacci retracement level on Tuesday, but it moved very close to this level in pre-market trading on Wednesday. Consequently, we don’t view the breakout as being really in (only one close and without a significant move further), and since the move above the long-term rising resistance line has been relatively small so far, we don’t read too much into it as well.
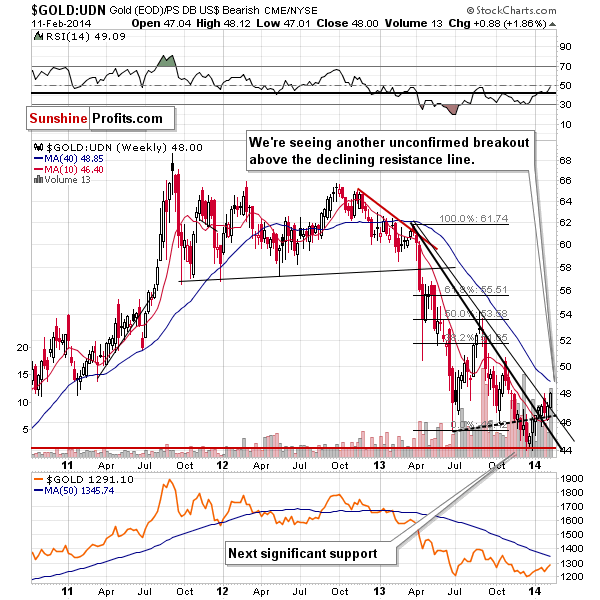
From the non-USD perspective, there was a breakout yesterday. It’s an unconfirmed one and as such it doesn’t have truly bullish implications. Please note that the above chart is based on the weekly candlesticks and there are 3 more days before the trading week is over.
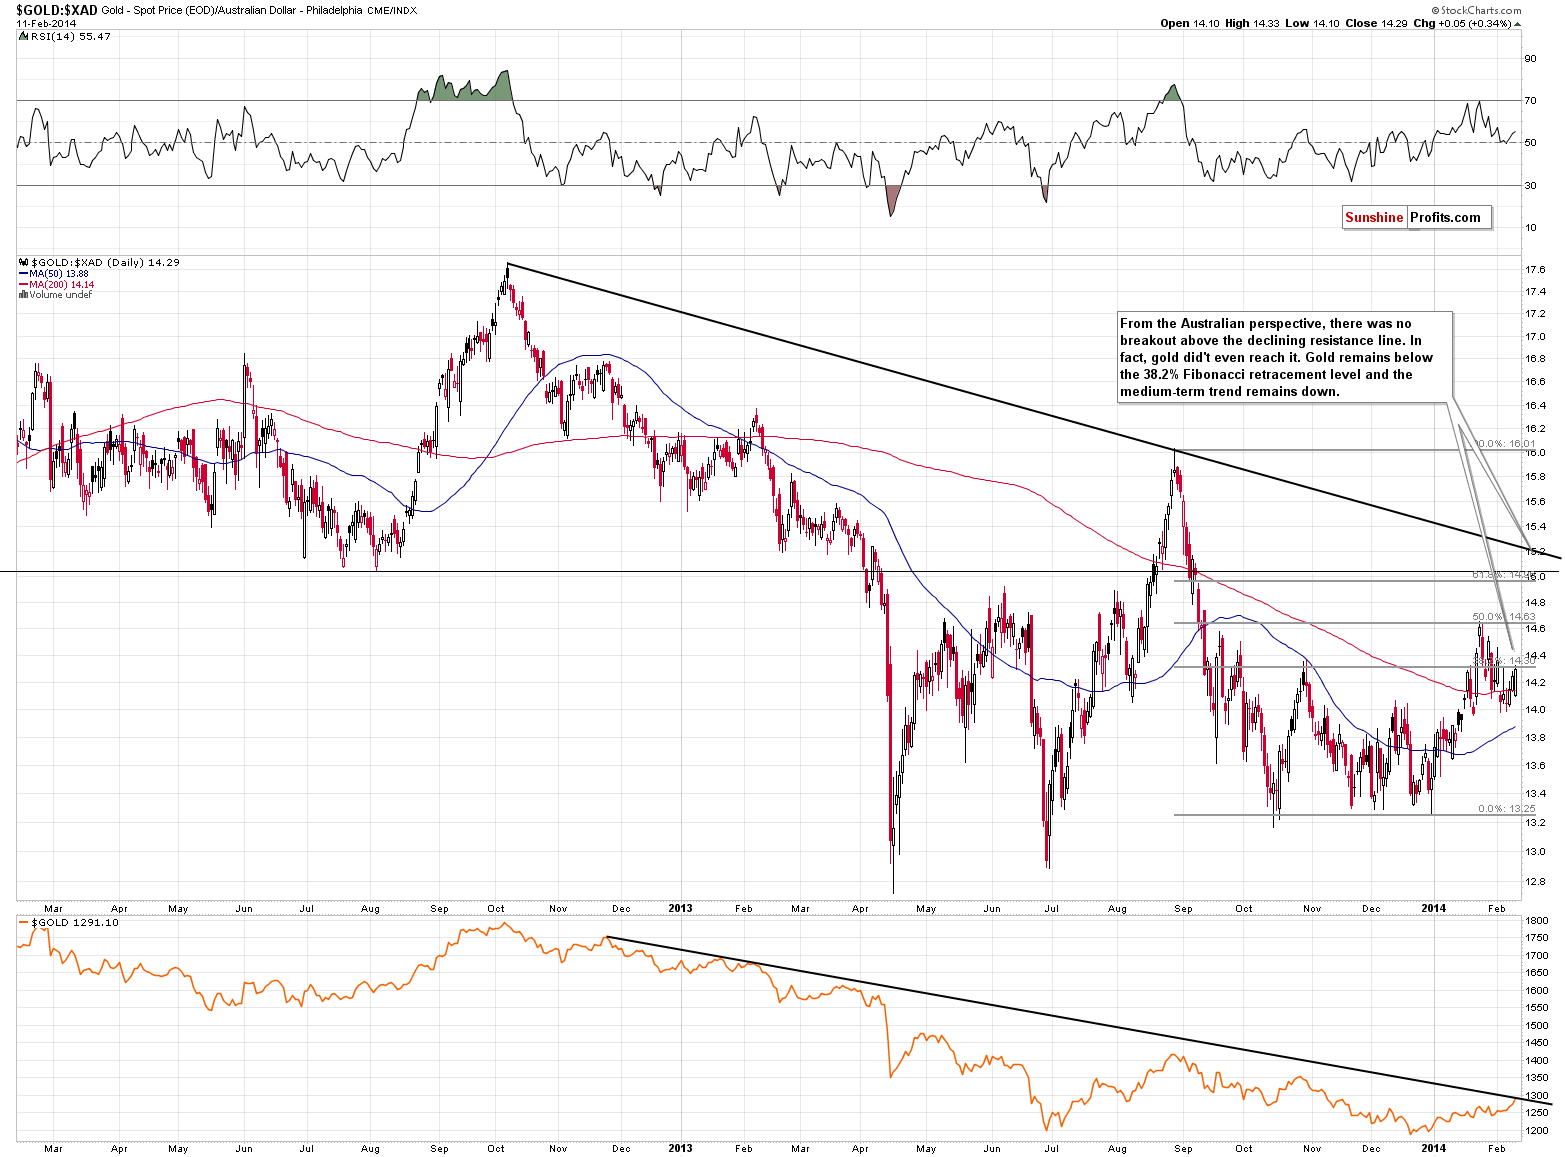
We were asked to specifically comment on gold priced in the Australian dollar, so here we are. From this perspective, the situation is more bearish than it is from our regular USD perspective. Here, gold didn’t move above the declining resistance line – it’s well below it. Gold simply corrected 50% of its August – December decline and is now even lower – at the 38.2% retracement. The medium-term trend is down and since gold didn’t move above its January high, from this perspective, it might drop particularly significantly vs. the Australian dollar, should the precious metals market move lower in general.
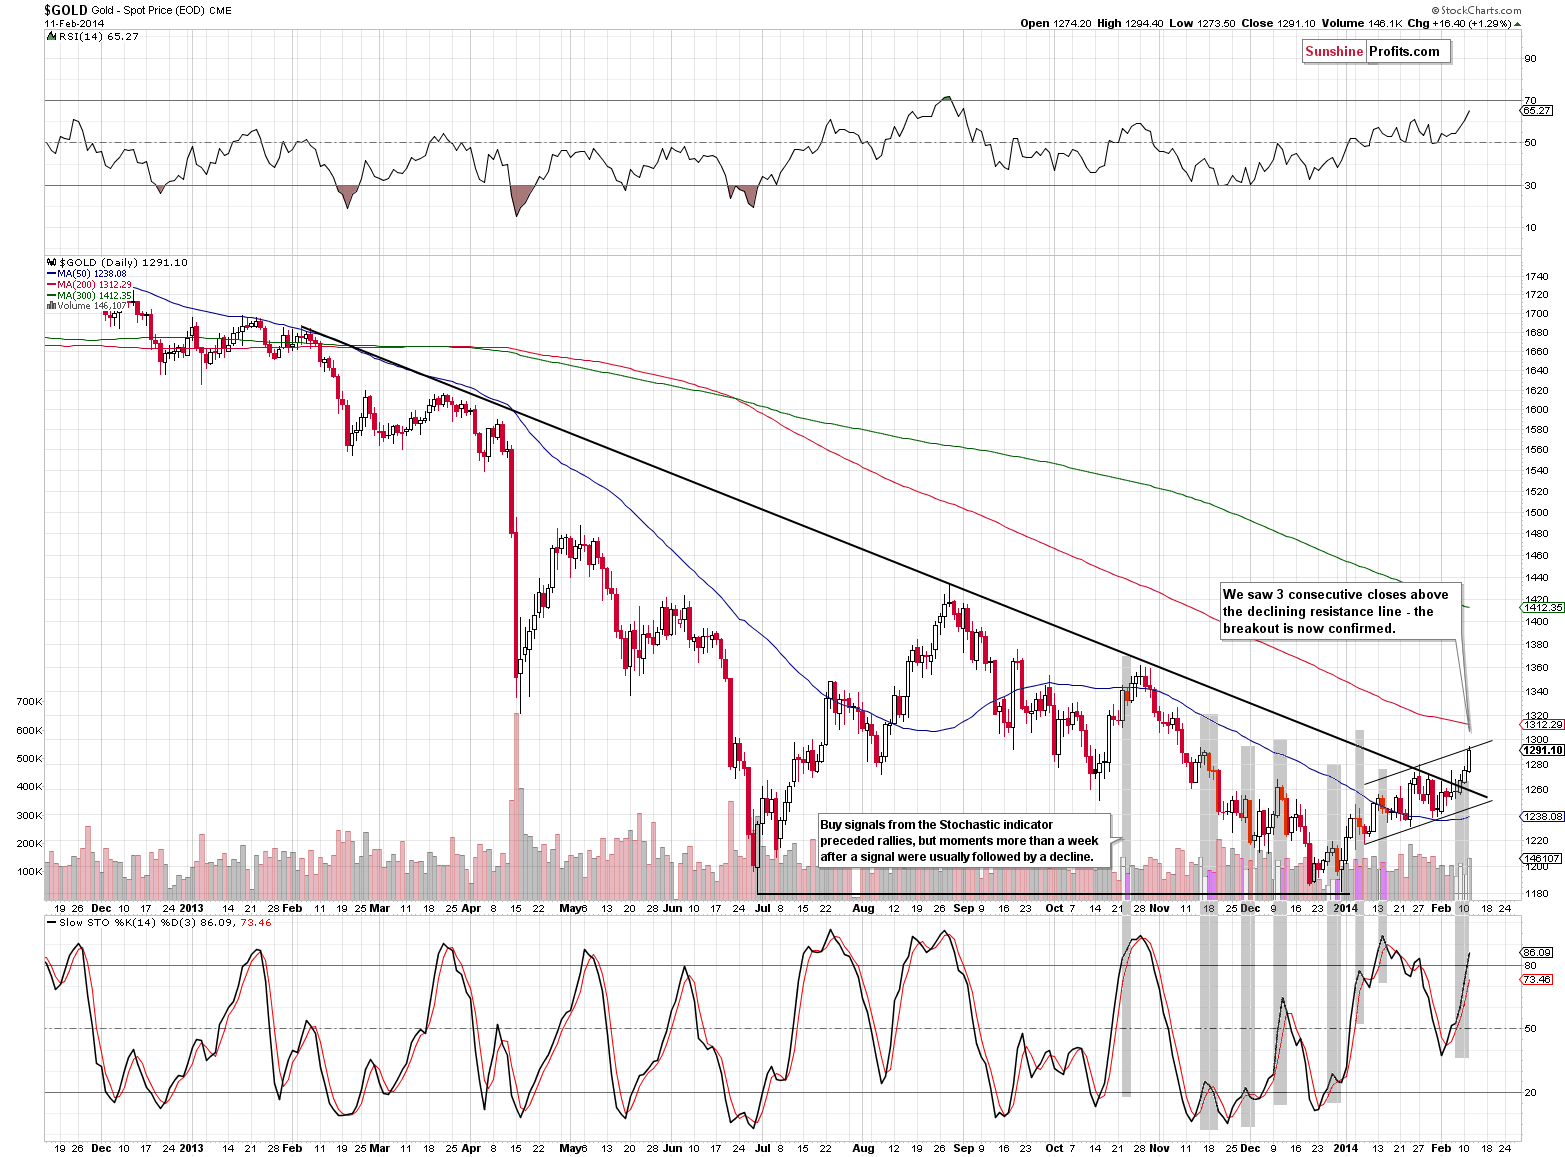
Gold moved higher on Tuesday once again and from this perspective the situation became more bullish as we saw a third consecutive close above the declining medium-term resistance line.
Let’s keep in mind, however, that the long-term resistance lines / levels and breakouts are more important than medium-term ones (and medium-term ones are more important than short-term ones), so the points that we made regarding the 38.2% Fibonacci retracement level based on the entire bull market are the ones that we should focus on, not the bullish signal coming from the above chart.
As far as silver is concerned, the situation didn’t change much yesterday and much of what we wrote in yesterday’s alert remains up-to-date.
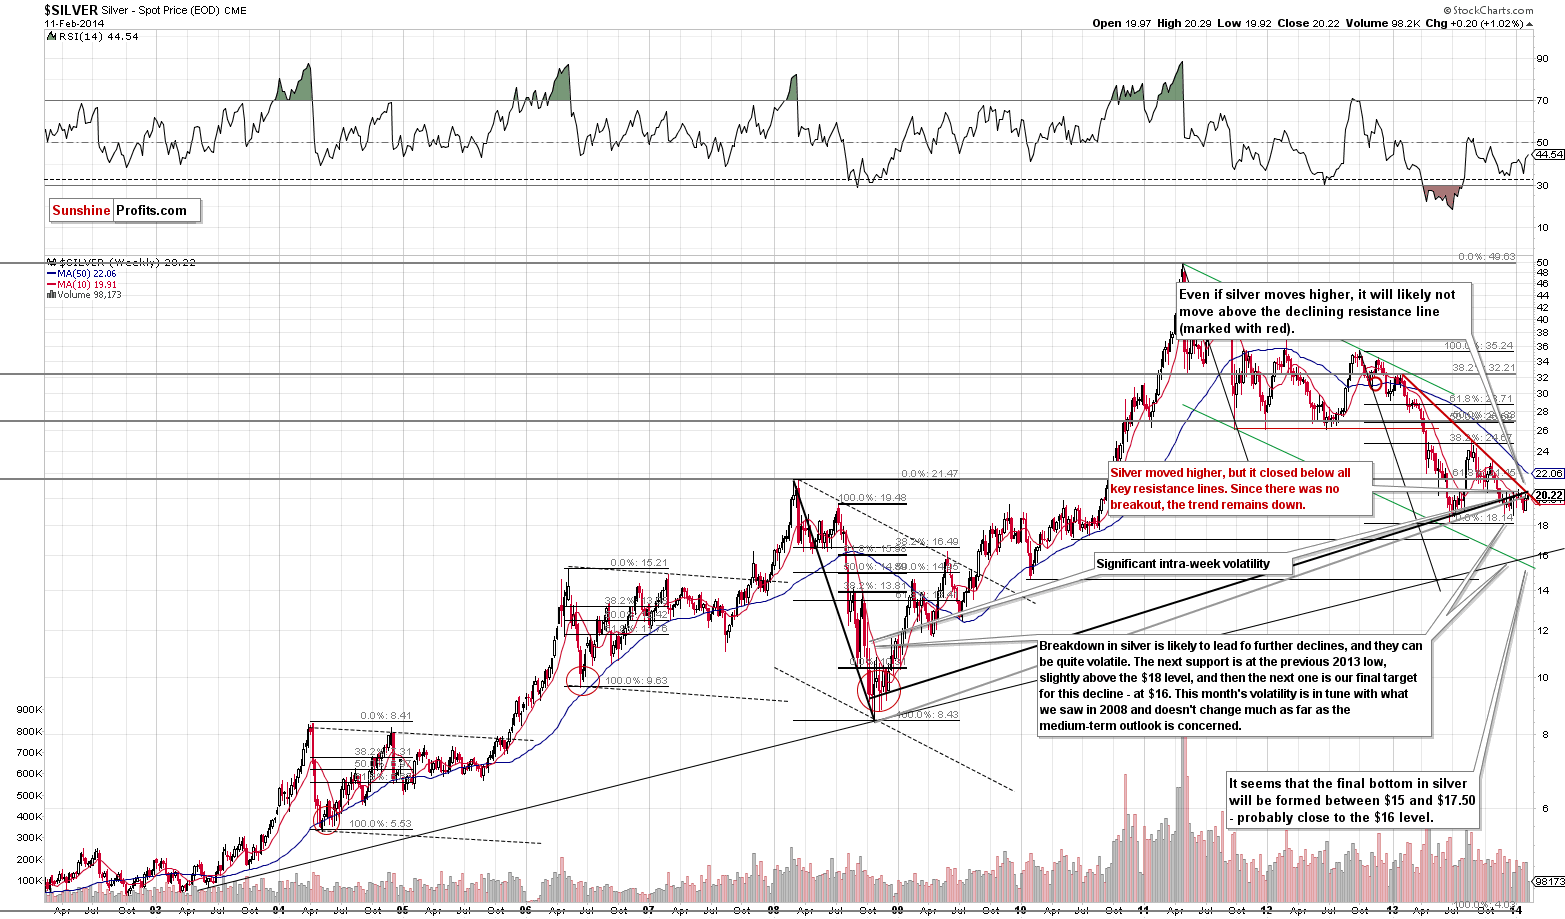
Silver remains below key support lines, which means that the downtrend remains in place and that actually nothing changed in this market in the past few days.
Tuesday’s price action didn’t change anything.
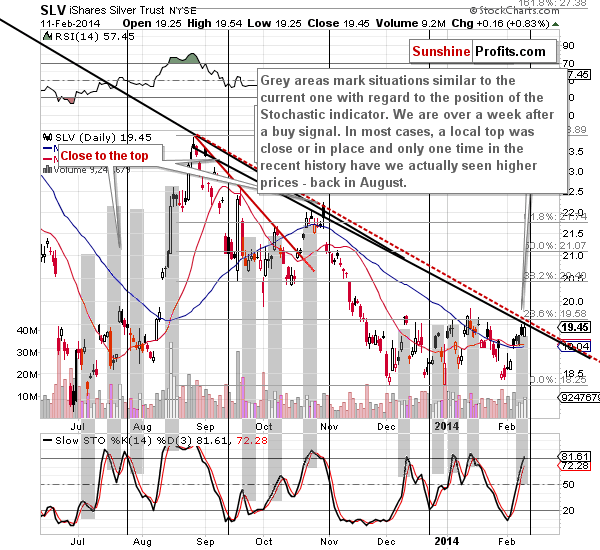
The SLV ETF moved only slightly higher in the last few days. It almost reached the declining resistance line – there was no breakout, and the move higher materialized on low volume. The action seen in the silver market is not bullish.
In fact, we have a bearish sign in the form of the upcoming cyclical turning point. The most recent short-term move has been up, so the turning point heralds a decline.
As mentioned earlier, we were asked to comment on the Stochastic indicator for silver. As it was the case with gold, we marked situations similar to the one we have today with grey rectangles. In most cases, similar situations with regard to the Stochastic indicator (meaning being over a week after a buy signal) meant that a local top was about to be formed or had already been in.
With bearish outlook for silver, let’s take a look at silver stocks:
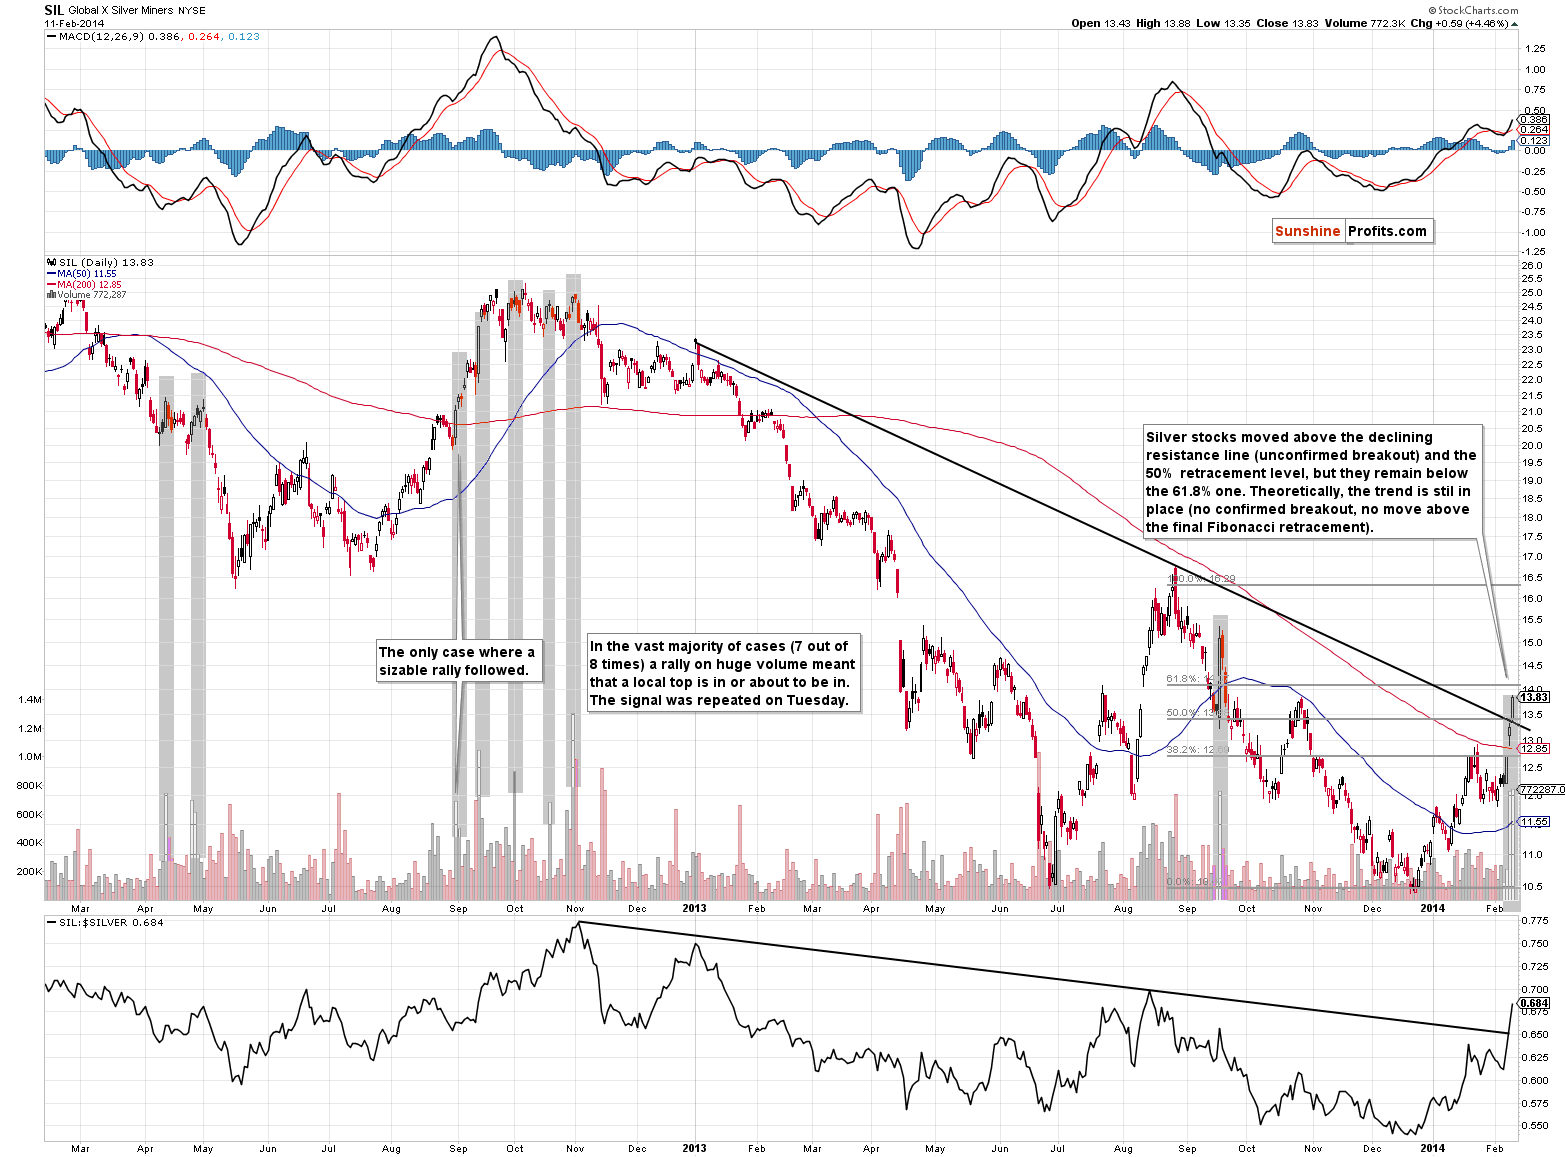
Silver stocks moved above their declining resistance line – the breakout is unconfirmed. The move took place on huge volume, which is normally a bullish sign. By normally, we mean in other markets. In this case, a huge-volume day being bullish would mean that “this time is different” and you know that this is the phrase traders need to be afraid of.
Quoting our yesterday’s comments:
On Monday, silver stocks rallied on huge volume, huge enough for us to examine if similar cases had meant something in the past. After all, if a similar thing followed multiple times and something contrary didn’t, we could view the huge volume as some kind of signal.
It turns out that 7 out of 8 times that silver stocks rallied on huge volume marked a local top and there was only one case when a rally followed. In mid-September 2013 we saw a small rally but a bigger decline followed after just several days and as it turned out later, the top that formed right after the huge-volume session, was a major one.
Consequently, the implications are bearish.
We also wrote the following and it’s still up-to-date:
As long as they [silver stocks] remain below the 61.8% retracement, the recent rally will continue to look like a correction. It’s particularly clear when we factor in the declining resistance line.
As mentioned above, there’s been a breakout above the declining resistance line, but it’s not confirmed so far, which means that its implications are still limited.
Based on the above charts (except for the ones featuring silver and the SLV ETF) we can conclude that the situation in the precious metals market has at least improved, based on what happened on Tuesday. However, these are not the only charts that one should keep in mind. There are also two, which might have a more bearish impact on the precious metals’ future: juniors and the USD Index.
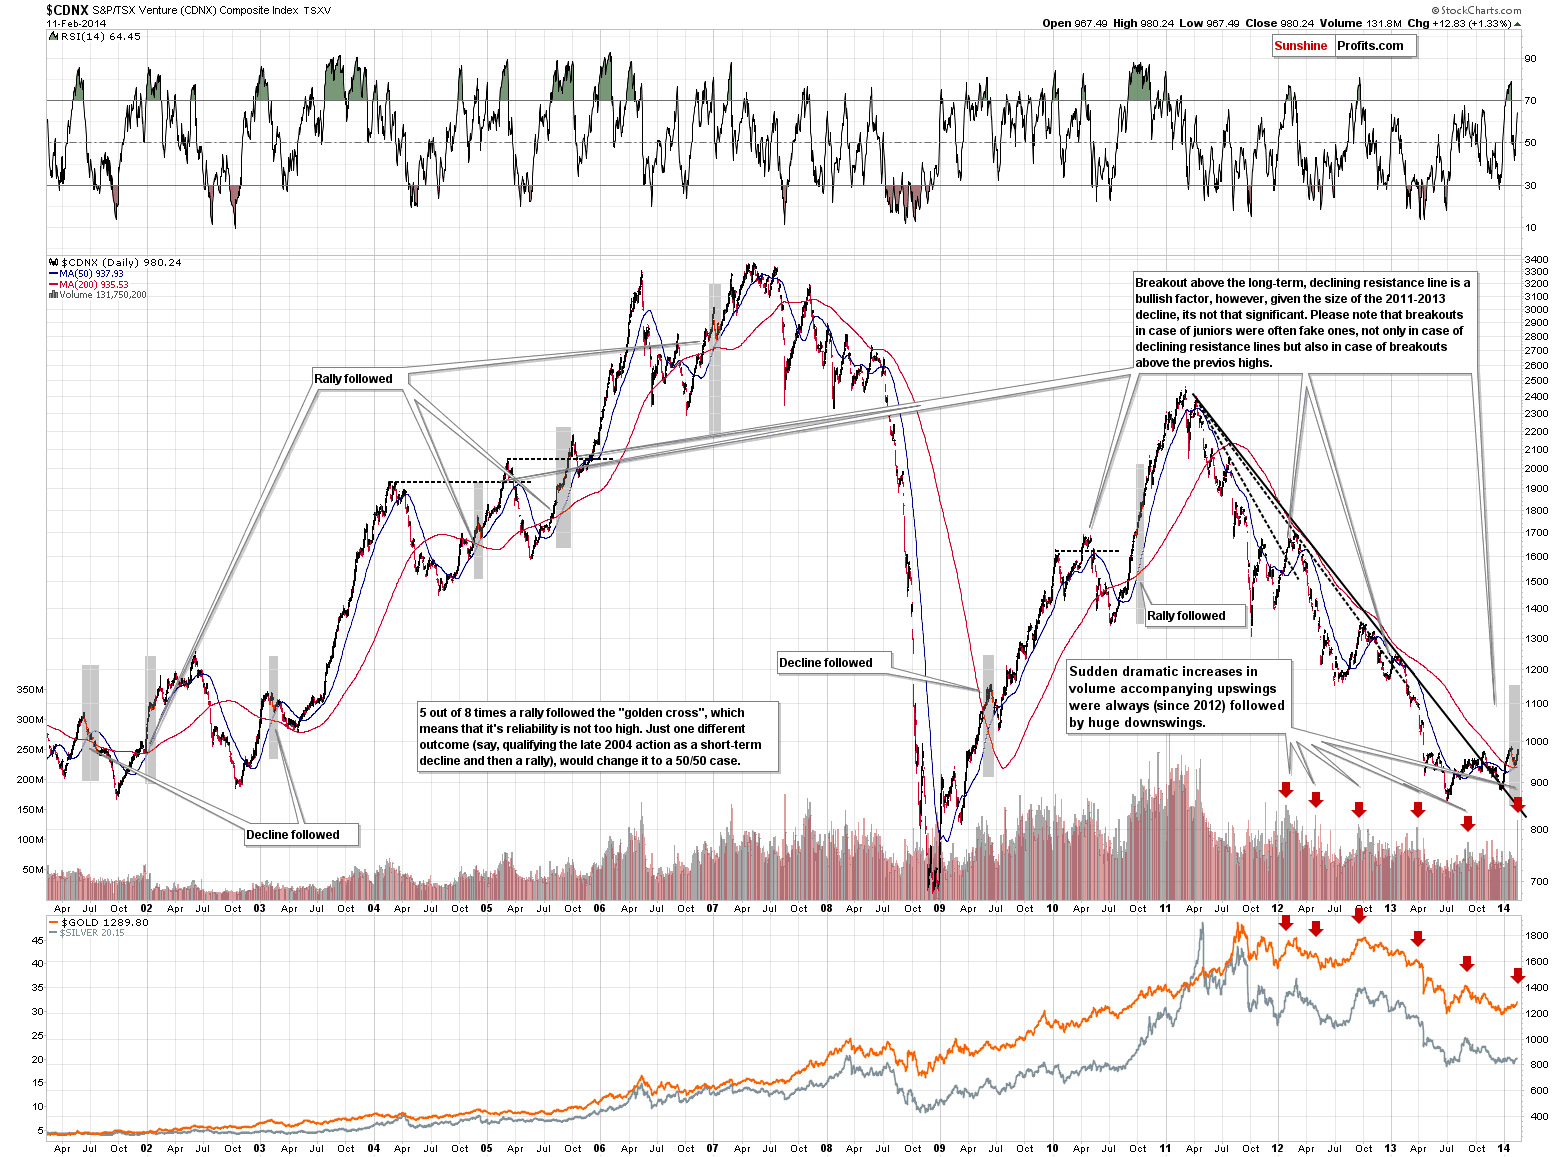
Basically, what we wrote about juniors yesterday (regarding the golden cross and the breakout) remains up-to-date, so today we would like to focus on what happened on Tuesday alone.
What happened was that we saw a 1.33% rally on huge volume. The thing that makes yesterday’s session so special is the fact that the volume jumped very suddenly. It was not a gradual increase that we saw when major rallies began. No – it was a sharp spike, which was not preceded by any increase in volume whatsoever. That’s what makes yesterday’s session very specific.
Guess what happened when we saw similar spikes in the past. Significant (!) declines followed. The only time since 2012 that a big decline didn’t follow immediately was at the beginning of 2012, but that was also the case when the volume spike was least visible (we can notice the increase in the volume even before the spike).
This is a "sell" signal on its own.
Yesterday, we commented on the USD Index chart in the following way:
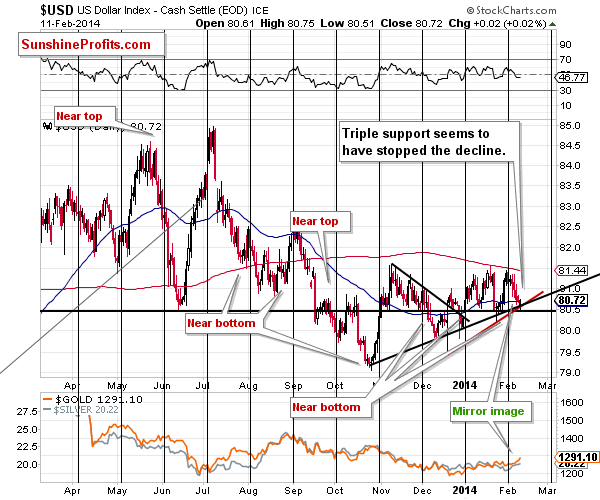
The USD Index didn’t move below the rising support line, which means that it’s likely to reverse direction and head north any day now. In fact, the index moved to the 80.50 level earlier today, which means that the bottom might already be in. This means that gold and the rest of the precious metals sector will likely soon have a “reason” to decline.
The USD Index indeed reversed direction before the end of the session and it appears set to rally once again. There was even a short-term (unconfirmed, but still) breakout:
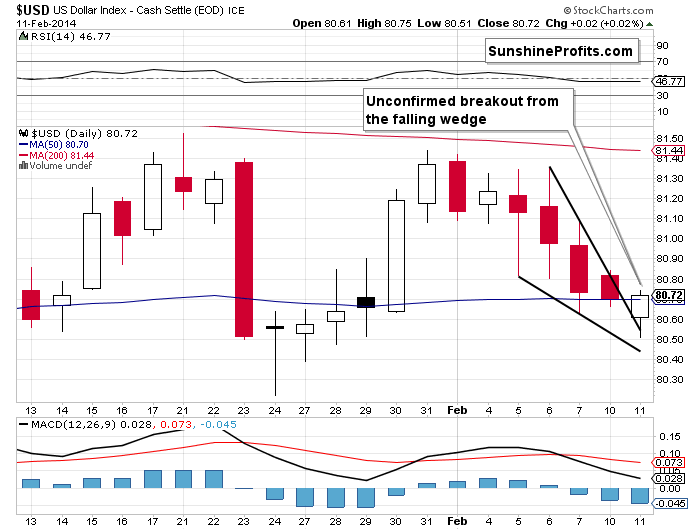
On the previous chart you could see that USD and precious metals have been moving in opposite directions lately. The post-turning-point decline in the USD took place simultaneously with the rally in gold, silver and mining stocks. This means that a rally in the USD Index is likely to at least trigger a corrective decline in metals and miners.
Let’s combine the improved outlook (based on unconfirmed breakouts in gold and mining stocks) with the bearish indications from the volume spike in juniors and the situation in the USD Index.
The breakouts are unconfirmed, which means that if we see more weakness, they will be invalidated. The invalidations of breakouts would serve as a bearish signal and something that would make adding to the short positions a good idea (probably), as the invalidations would make further – significant – declines very likely. Volume spikes in juniors and silver stocks suggest that we will see at least a temporary decline in metals and miners and the situation in the USD Index serves as confirmation. Based on the current situation in USD Index, metals and miners, it seems quite likely that we will see a small decline which will then turn into a much bigger decline (based on the invalidations of breakouts). It seems the most likely outcome in our view.
Summing up, taking all of the above into account, we arrive at the same conclusion at which we arrived previously – namely, in our opinion it’s a good idea to use a small part of the speculative capital to trade the (likely) coming decline in precious metals.
We have previously described the nature of this position (and the stop-loss orders reflect it) – it’s not about small moves to the upside or downside. It’s about a final, major downswing that is likely to take the entire precious metals sector much lower. We’re not closing the position in order not to be out of the market when it starts, as the initial move can be very volatile. In a way, we’re letting smaller fish go in order to catch a really big one.
If we see a meaningful confirmation of the bearish case (for instance, the invalidations of breakouts), we will likely think that increasing the size of the short position might be a good idea. Naturally, in case of an invalidation of the bearish outlook, we will keep you – our subscribers - informed as well.
To summarize:
Trading capital: In our opinion a short position (half) in gold, silver and mining stocks is justified from the risk/reward point of view. We are planning to profit on a significant downswing, so the stop-loss orders that are appropriate in our opinion are not that close (however, if something invalidates the bearish outlook, we will let you know ASAP, even if stop-loss orders are not reached).
Stop-loss orders for the short position:
- Gold: $1,307
- Silver: $21.20
- GDX ETF: $27.20
Long-term capital: No positions.
As always, we'll keep you - our subscribers - updated should our views on the market change. We will continue to send out Gold & Silver Trading Alerts on each trading day and we will send additional Alerts whenever appropriate.
The trading position presented above is the netted version of positions based on subjective signals (opinion) from your Editor, and the automated tools (SP Indicators and the upcoming self-similarity-based tool).
As a reminder, Gold & Silver Trading Alerts are posted before or on each trading day (we usually post them before the opening bell, but we don't promise doing that each day). If there's anything urgent, we will send you an additional small alert before posting the main one.
Thank you.
Sincerely,
Przemyslaw Radomski, CFA

