
Briefly: In our opinion short speculative positions (half) in gold, silver and mining stocks are justified from the risk/reward perspective.
In the previous Gold & Silver Trading Alert we outlined multiple reasons, which made us think that we were very close to the next local top in the precious metals. They remain up-to-date, so if you haven’t had the chance to read yesterday’s alert, we encourage you to do so. In today’s alert we will provide a follow-up on some of the points that we made.
Let’s start with the GLD ETF chart (charts courtesy of http://stockcharts.com.)
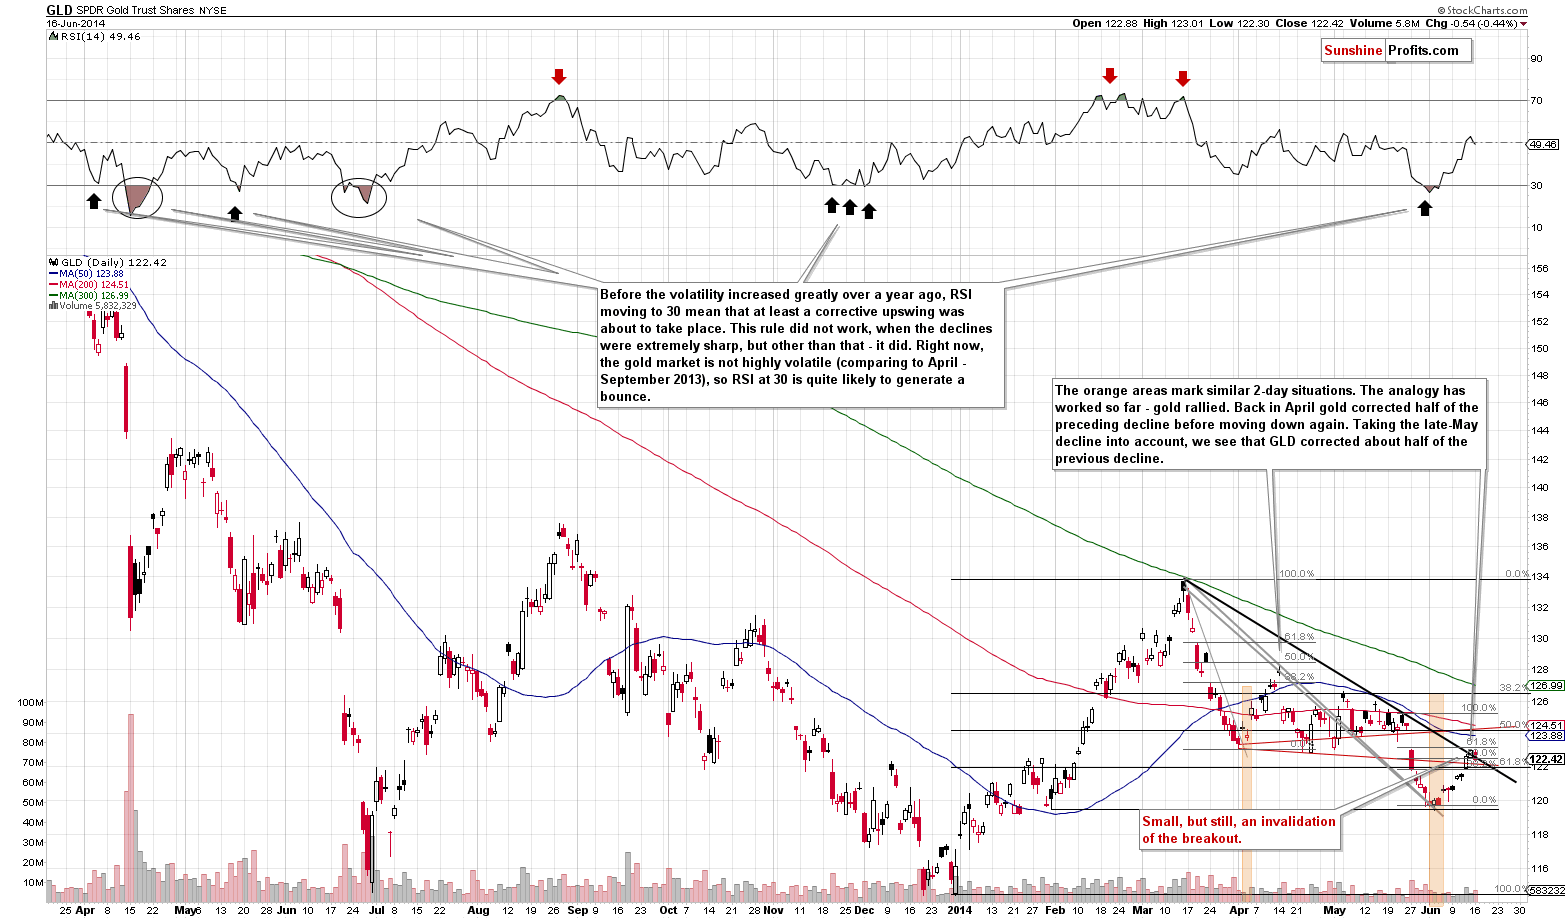
Yesterday, we wrote how weak the “breakout” above the declining resistance line was, and how it was likely to be invalidated. We didn’t have to wait much for the confirmation of our views – the breakout was invalidated yesterday. Naturally, that’s a bearish sign, but yesterday’s price action in spot gold is even more profound.
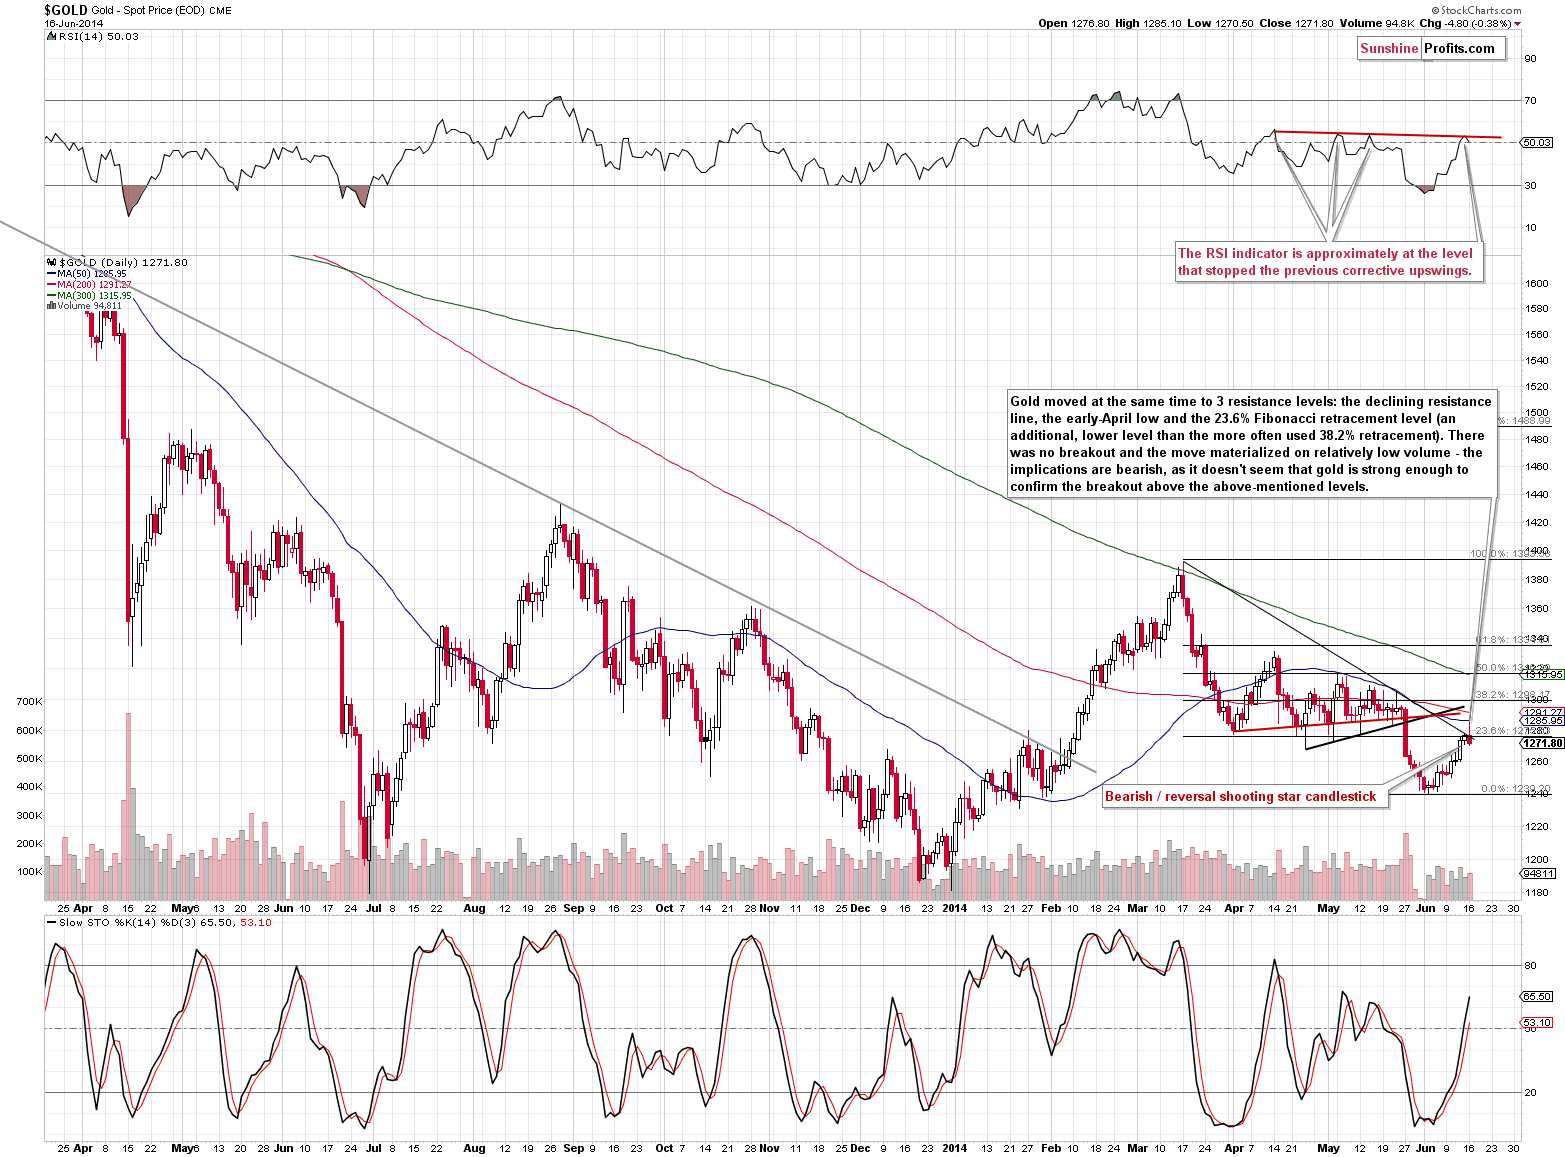
It’s so profound because of yesterday’s intra-day price action. Gold moved above the declining resistance line temporarily but then declined and finally closed below the previous day’s close, thus creating a bearish shooting star candlestick. It’s a classic reversal sign at the end of a rally. The short-term outlook has just deteriorated.
We have an additional confirmation of the above from the chart featuring gold priced in the Australian dollar.
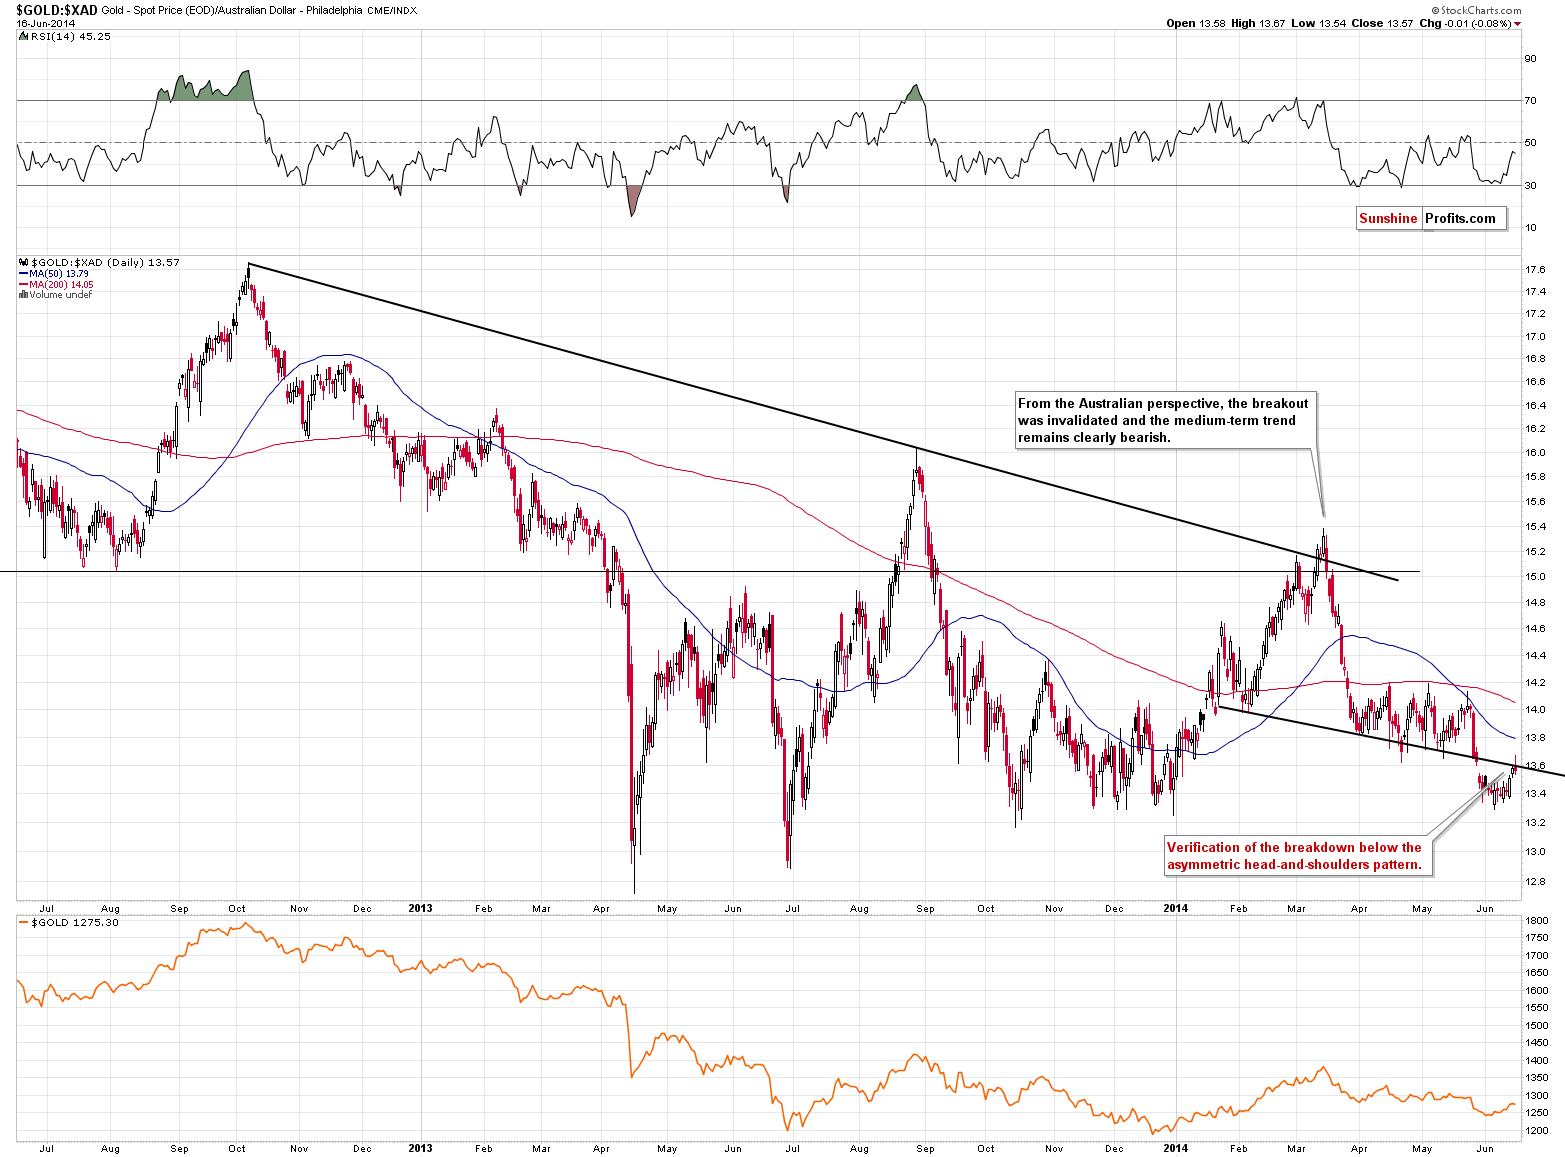
From this perspective, we also saw gold move temporarily back above the previously broken support line, which is also the neck level of the asymmetric head-and-shoulders pattern. The price moved back down before the end of the session and, overall, there was no invalidation of the breakdown. The failure to move above it is by itself a bearish indication.
All in all, the situation in gold deteriorated.
What about silver?
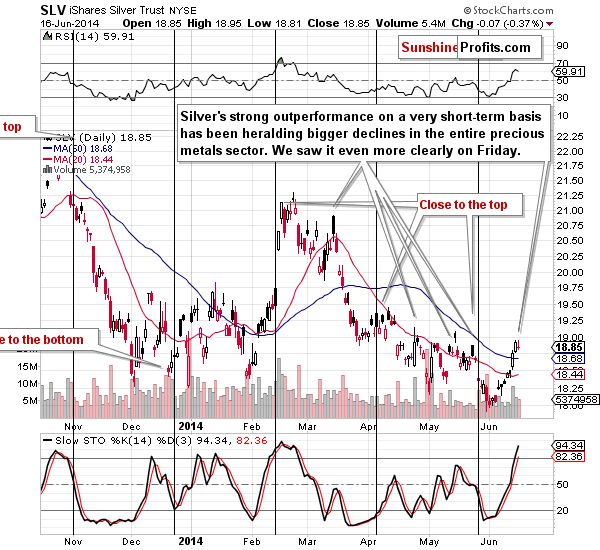
It moved a bit lower yesterday, but that’s not really significant. What’s significant, is the white metal’s outperformance that we had seen in the previous days. The bearish (!) implications of this phenomenon remain in place. Here’s why:
Those, who have been following our analysis for some time, know that it’s usually best not to take silver’s strength at face value. In the early years of the current great bull market in the precious metals sector one could say that the “whites lead the yellow” meaning that silver and platinum were showing strength before gold and they indicated another rally (and the same went for mining stocks).
However, that’s not how things have worked in the past months. There has been a different and quite strong short-term relationship in place between silver and gold and its implications are the opposite to these mentioned above. In the past months silver has been outperforming gold on a very short-term basis right before taking another dive. We marked some cases on the above chart – please note that silver usually rallied quickly right before a big decline. These fake moves caught many long-term investors by surprise as that’s exactly the opposite of what one might have expected. Anyway, we definitely saw significant price/volume action yesterday and it’s either a sign of a bigger rally or – as it worked in the vast majority of cases – another fake move that will be followed by declines. We think the latter is much more probable, but we will monitor the market to see any bullish confirmations or something that could invalidate the bearish outlook.
Having said that, let’s turn to mining stocks.
We will once again start by quoting our previous comments:
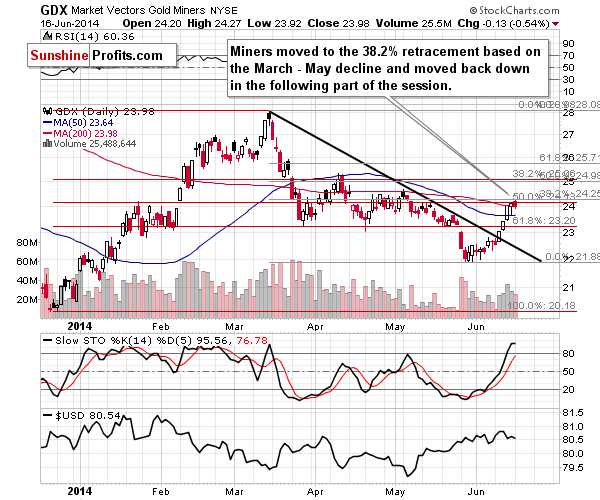
We have previously written about the possibility of mining stocks reaching the 50% Fibonacci retracement level and that’s what happened on Friday – nothing unexpected here. We have added an additional retracement (marked in grey) that’s based on the March – May decline – and in this case we saw a move to almost the 38.2% retracement. Still, the most recent rally in mining stocks seems to be a correction, not a new rally just yet – at least the size of the move doesn’t suggest anything more than that. Miners did not outperform gold on Friday. That could have been the reason for some analysts to become bearish or less bullish – remember that you had read about the bearish implications earlier – before the Friday’s session, not after it.
Miners moved to the 38.2% Fibonacci retracement level yesterday and then moved back down. It seems to us that the correction is complete and that miners are ready to move lower. There are no guarantees, though; we are still monitoring the market for signs of strength.
What’s so significant about the last days’ performance is the mining stocks’ strength relative to gold. However, we saw a reversal also from this perspective.
The ratio between miners and gold moved slightly lower. The size of the decline is not impressive but the fact that it was the first decline in several days – is.
Consequently, what we wrote on Friday remains up-to-date:
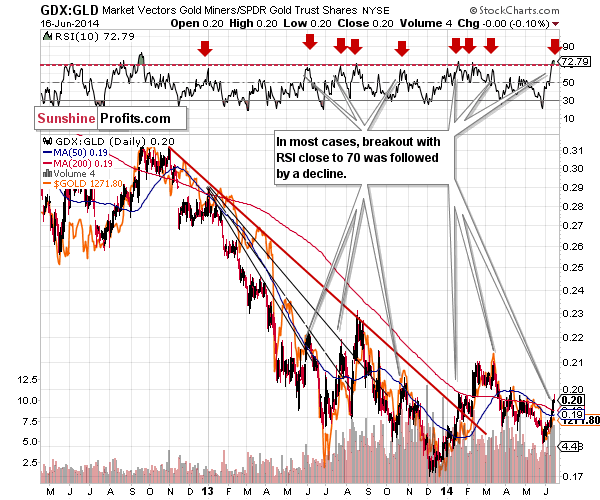
On a short-term basis (we used the GDX ETF as a proxy for the mining stocks this time) the miners’ outperformance is clearly visible, but the implications don’t have to be bullish just yet. The RSI indicator based on the ratio suggests a significantly overbought condition and in fact we just saw a sell signal as the indicator moved above the 70 level.
The way the mining stocks performed relative to gold is very significant. The rally in the GDX to GLD ratio was strong and sharp. With something as visible as that, one might expect it to mean something. We think it does. While in the past, strong performance of the mining stocks relative to gold used to herald more gains, it doesn’t seem to be the case at this time anymore. In most cases, in the past months, the times when the miners to gold ratio rallied particularly strongly – and by that we mean when the RSI indicator moved close to the 70 level – heralded either a consolidation in the precious metals sector, or a decline.
What do we make of all the above? It seems to us that the days of the rally in the precious metals market are numbered. The resistance in case of the GLD ETF is very close, and even though miners rallied quite strongly, they too have a resistance level (50% retracement) that can prevent further gains. Additionally, the extent of the miners’ outperformance suggests that at least a pause is likely.
Please note that the USD Index moved a bit lower yesterday, and yet, gold, silver and mining stocks moved slightly higher. If this was a real, big rally, we would have likely seen another huge daily upswing. But we didn’t. Instead, the precious metals sector moved slightly lower. It seems that precious metals corrected what needed to be corrected and are now ready to move lower once again, according to their current medium-term trend.
Before summarizing, let’s take a look at our Correlation Matrix:
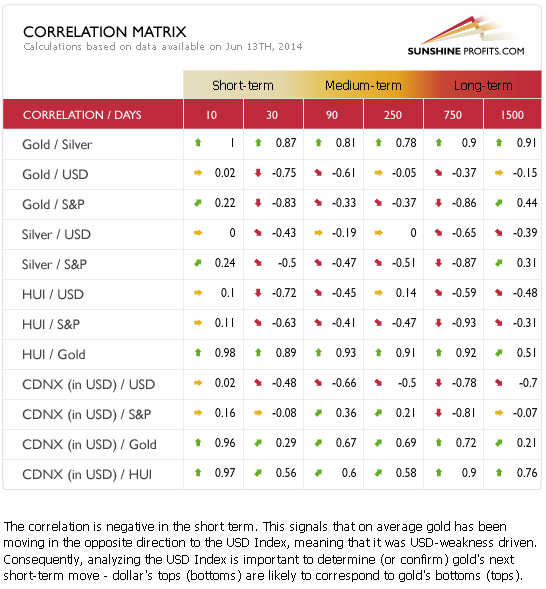
The thing that we would like to emphasize are the negative values across the precious metals sector (gold, silver, gold stocks) compared with the USD Index and the general stock market. In the short- and medium term, precious metals and mining stocks are the anti-assets. The “problem” here is that the general stock market is in a medium-term uptrend, and the USD Index has already verified important breakouts. The bullish outlook for the USD and stocks is bearish for the precious metals sector.
Summing up, it seems that we are at or quite close to a local top in the precious metals sector. While the medium-term trend in the precious metals market is down, we were likely to see a corrective upswing – and we have. While in the past days it seemed that the corrective upswing was not over yet, we have some signs that it is over now. We have gold at a significant resistance line (and forming a reversal candlestick during an attempt to move above it), we have short-term outperformance in silver, and gold has made the headlines. Miners moved higher relative to gold but after examining the situation more closely it turns out that it’s much less bullish than it seems at first sight.
To summarize:
Trading capital (our opinion): Short positions (half) in gold, silver and mining stocks with the following stop loss orders:
- Gold: $1,306
- Silver: $20.20
- GDX ETF: $25.6
Long-term capital: No positions
Insurance capital: Full position
Please note that a full position doesn’t mean using all of the capital for a given trade. You will find details on our thoughts on gold portfolio structuring in the Key Insights section on our website.
As always, we'll keep you - our subscribers - updated should our views on the market change. We will continue to send out Gold & Silver Trading Alerts on each trading day and we will send additional Alerts whenever appropriate.
The trading position presented above is the netted version of positions based on subjective signals (opinion) from your Editor, and the automated tools (SP Indicators and the upcoming self-similarity-based tool).
As a reminder, Gold & Silver Trading Alerts are posted before or on each trading day (we usually post them before the opening bell, but we don't promise doing that each day). If there's anything urgent, we will send you an additional small alert before posting the main one.
Thank you.
Sincerely,
Przemyslaw Radomski, CFA
Founder, Editor-in-chief
Gold & Silver Trading Alerts
Forex Trading Alerts
Oil Investment Updates
Oil Trading Alerts

