

Briefly: In our opinion (full) speculative long positions in gold, silver and mining stocks are currently justified from the risk/reward perspective. Getting back on the long side of the precious metals market with half of the long-term investment capital seems justified from the risk/reward perspective.
Gold moved visibly higher yesterday and this goes double for mining stocks. The rally was significant not only because of its size and the corresponding volume, but also because it took place without the USD’s help. Is this rally just starting or about to end?
Based on yesterday’s repeat of the previous bullish patterns, it seems that the rally is just beginning. Our comments from yesterday’s alert remain up-to-date:
We [were] aiming to profit on the next decline in the precious metals market after a confirmation of the market’s weakness, most likely after a correction and continuation of a rally in the USD Index. However, the USD Index is already very high – well above the 90 level and very close to the resistance at 92.33. Since gold is not declining (its actually rallying), it could be waiting for a bigger sign of weakness in the USD Index in order to start at a bigger short-term rally. Yesterday, we wrote that this means that we might see an opportunity to go long very soon. It seems that yesterday’s session was the thing that was needed to push the risk/reward ratio to the levels justifying opening a long position.
The precious metals sector (especially gold stocks) rallied strongly shortly after the above was published, which made the situation even more bullish. Let’s see why and start with the USD Index chart (charts courtesy of http://stockcharts.com).
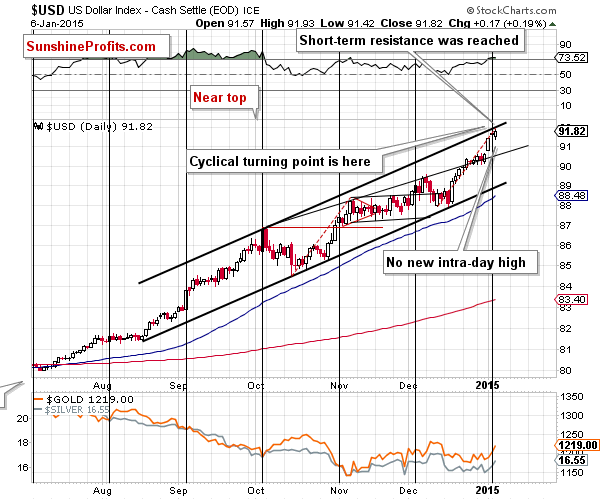
In short, the outlook for the USD Index remains unchanged. Our yesterday’s comments remain up-to-date with an additional note that even though there was a higher daily close, there was no new intra-day high:
- The RSI indicator is as overbought as it was in early November 2014, when we saw a local top.
- The cyclical turning point is here and the previous move was definitely up.
- The mid-Dec. rally is just as big as the mid-Oct. – Nov. one, which suggests that this rally may be already over or close to being over.
- We just saw an intra-day reversal.
The above is a bearish combination for the short term.
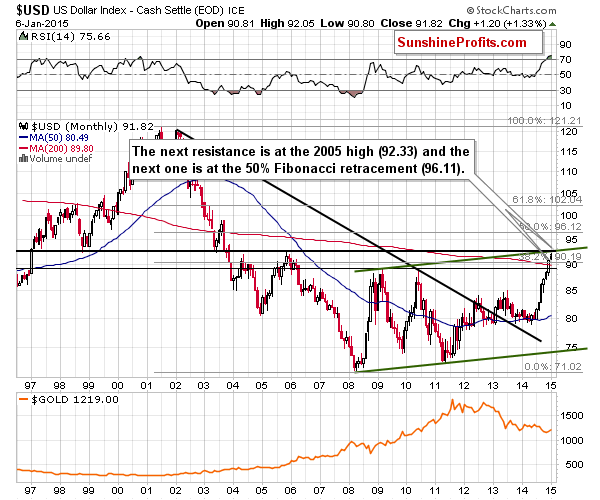
The combination of both long-term resistance levels was almost reached [on Monday]. The USD Index moved to the 92.05 level, which is only 0.28 below the 92.33 level – the 2005 high. The USD Index could move even higher, but there is little room for further gains before a correction / decline.
Combining the implications of both charts suggests that we will either see a local top in the USD Index very soon or that it’s already in.
More importantly, for us – precious metals investors and traders – gold has already started to respond positively without waiting for the final “go” signal (USD’s decline). This increases the odds of a rally in gold in the coming days.
Yesterday was another day of strength in precious metals, which confirms the above. Gold and silver moved a bit lower in today’s pre-market trading and right after the open as the USD Index moved slightly above 92, which doesn’t change the above relationship. When the USD rallies, the declines in gold are small or nonexistent, and when it just stops to rally, gold rallies. Either way, gold is showing strength. This means that it’s likely to show even greater strength when the USD Index declines.
The situation in the USD Index is a very important issue at this time, so we’ll feature the long-term chart once again, but with more details in it. Please expand it and take a closer look at it – it’s the most important of today’s charts.
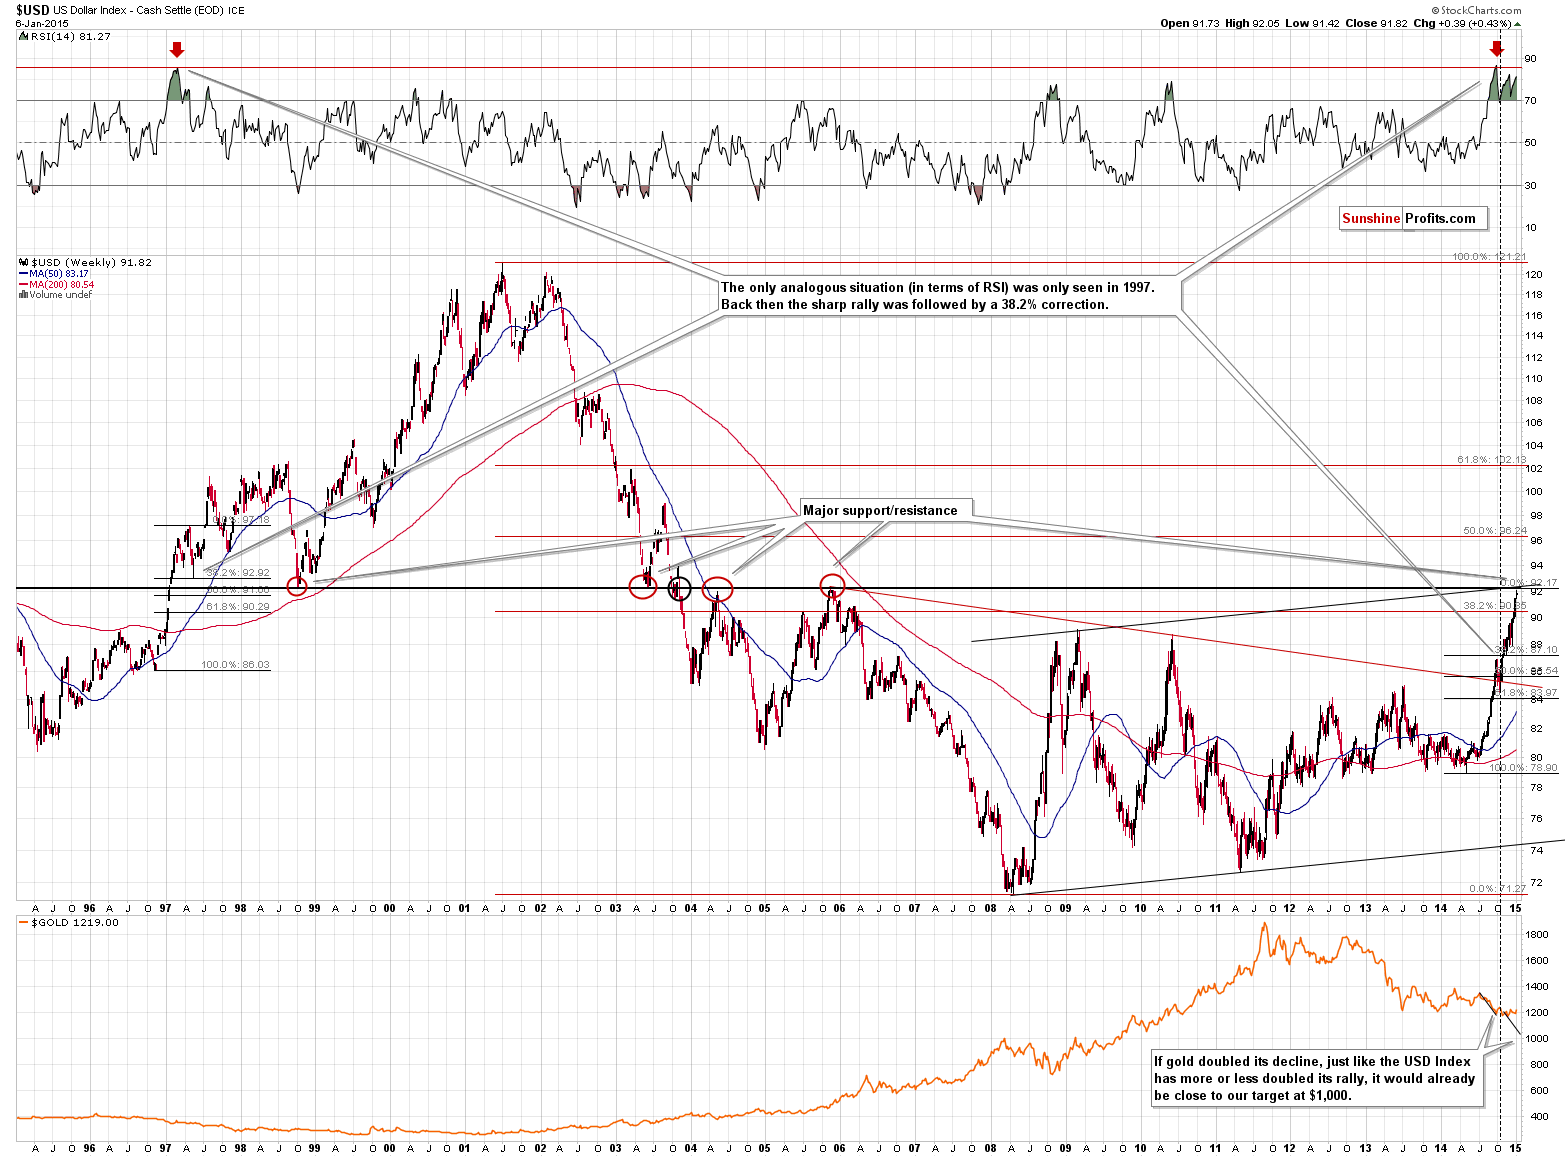
On the above chart we see that several things. One of them is that the horizontal resistance that is about to be reached is even more important that it seemed as it stopped major rallies and declines several times in the past 20 years.
The second thing is that we see that there was only one time when the weekly RSI was as overbought in the past 20 years as it is now – it was in 1997. Back then the USD Index corrected to the first Fibonacci retracement level – 38.2%. If the history repeats itself, we might see a move to 87.10 or so. In other words, the USD Index could slide 5 index points and still remain in a medium-term uptrend. In fact, it could also decline to the 61.8% retracement and remain in an uptrend, but the 38.2% seems to be a more probable target.
The third thing is that the above chart clearly shows that gold’s strength is not a one-day or one-week event. It has been refusing to decline more visibly for more or less half of the dollar’s rally.
The fourth thing is that the above gold – USD analogy shows that, in a way, gold “reached” the $1,000 -$1,100 target that we were writing about. If gold hadn’t stopped reacting to the dollar’s strength and had also doubled its previous decline, it would be very close to the $1,000 level. Of course, the price didn’t move as low, but in a way (from the gold-USD link perspective), it’s as likely to move higher as it would be if it had indeed declined as low.
The fifth thing is that the above chart shows that getting back on the long side of the precious metals market before today’s session was not justified from the risk/reward perspective. The USD Index was likely to rally which was a major threat to any rally in gold. Consequently, even by buying a bit lower, one would be taking on significant risk. It was likely that big rally in the USD Index would translate into lower gold prices. It turned out that the less likely type of reaction had been seen in the previous several weeks, but that doesn’t mean that betting on the less likely scenario would have been a better choice in the first place – it wouldn’t.
Months ago we wrote that we were waiting to see several things in the precious metals market before saying that getting back on the long side of the market with the long-term investment capital would be a good idea. There were several things to look at, but the HUI moving to its 2008 low, the HUI to gold ratio moving to an important support level (the 2000 low was reached), the juniors sector moving to an important support (the breakdown below the 2008 low was just invalidated) and the USD Index reaching an important long-term resistance were among them. While we have not seen all of them (silver hasn’t underperformed in a major way, the HUI to S&P ratio is not at an important support, and the same goes for the gold stocks to oil stocks ratio, and gold is not extremely hated in the mass media), seeing two major factors (with gold’s strength relative to the USD Index being the most recent development) is enough for the medium-term outlook to improve.
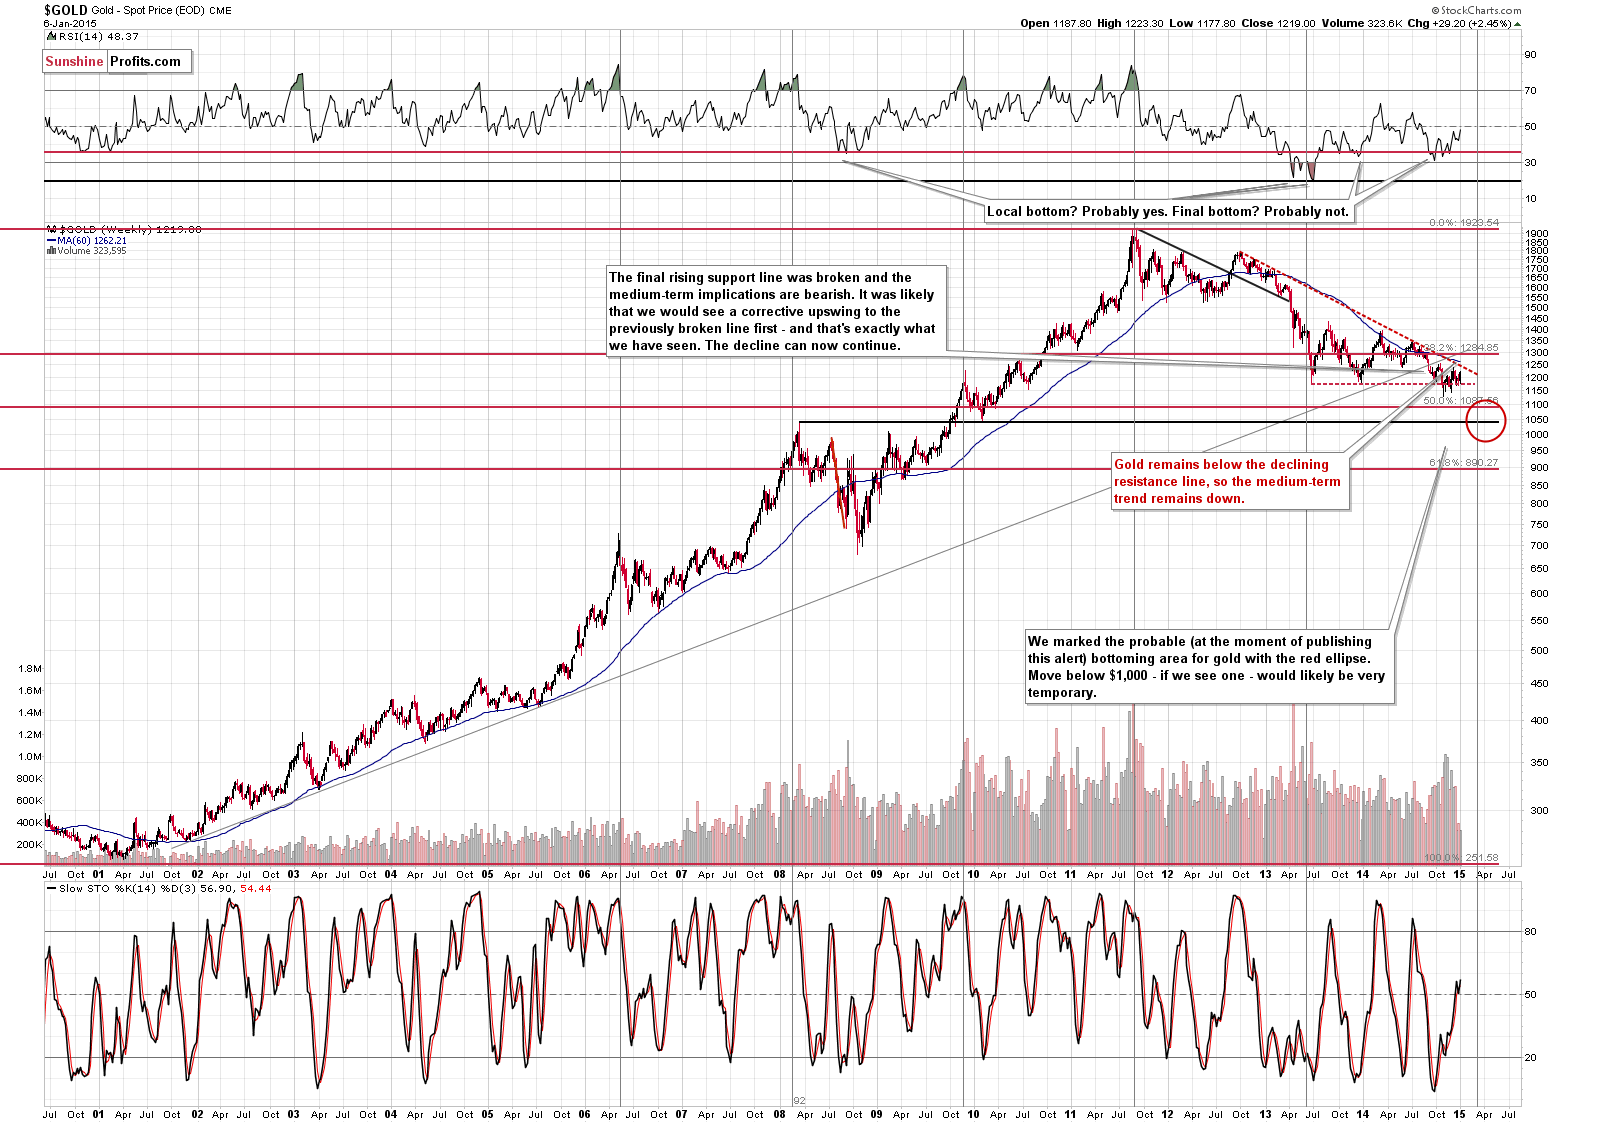
On the long-term gold chart nothing changed and the trend remains down. The declining medium-term resistance line is close to the $1,250 level. Even if this level is broken (it seems likely that it will be the case), the next resistance – the 38.2% Fibonacci retracement or the 2014 highs would be likely to keep the rally in check.
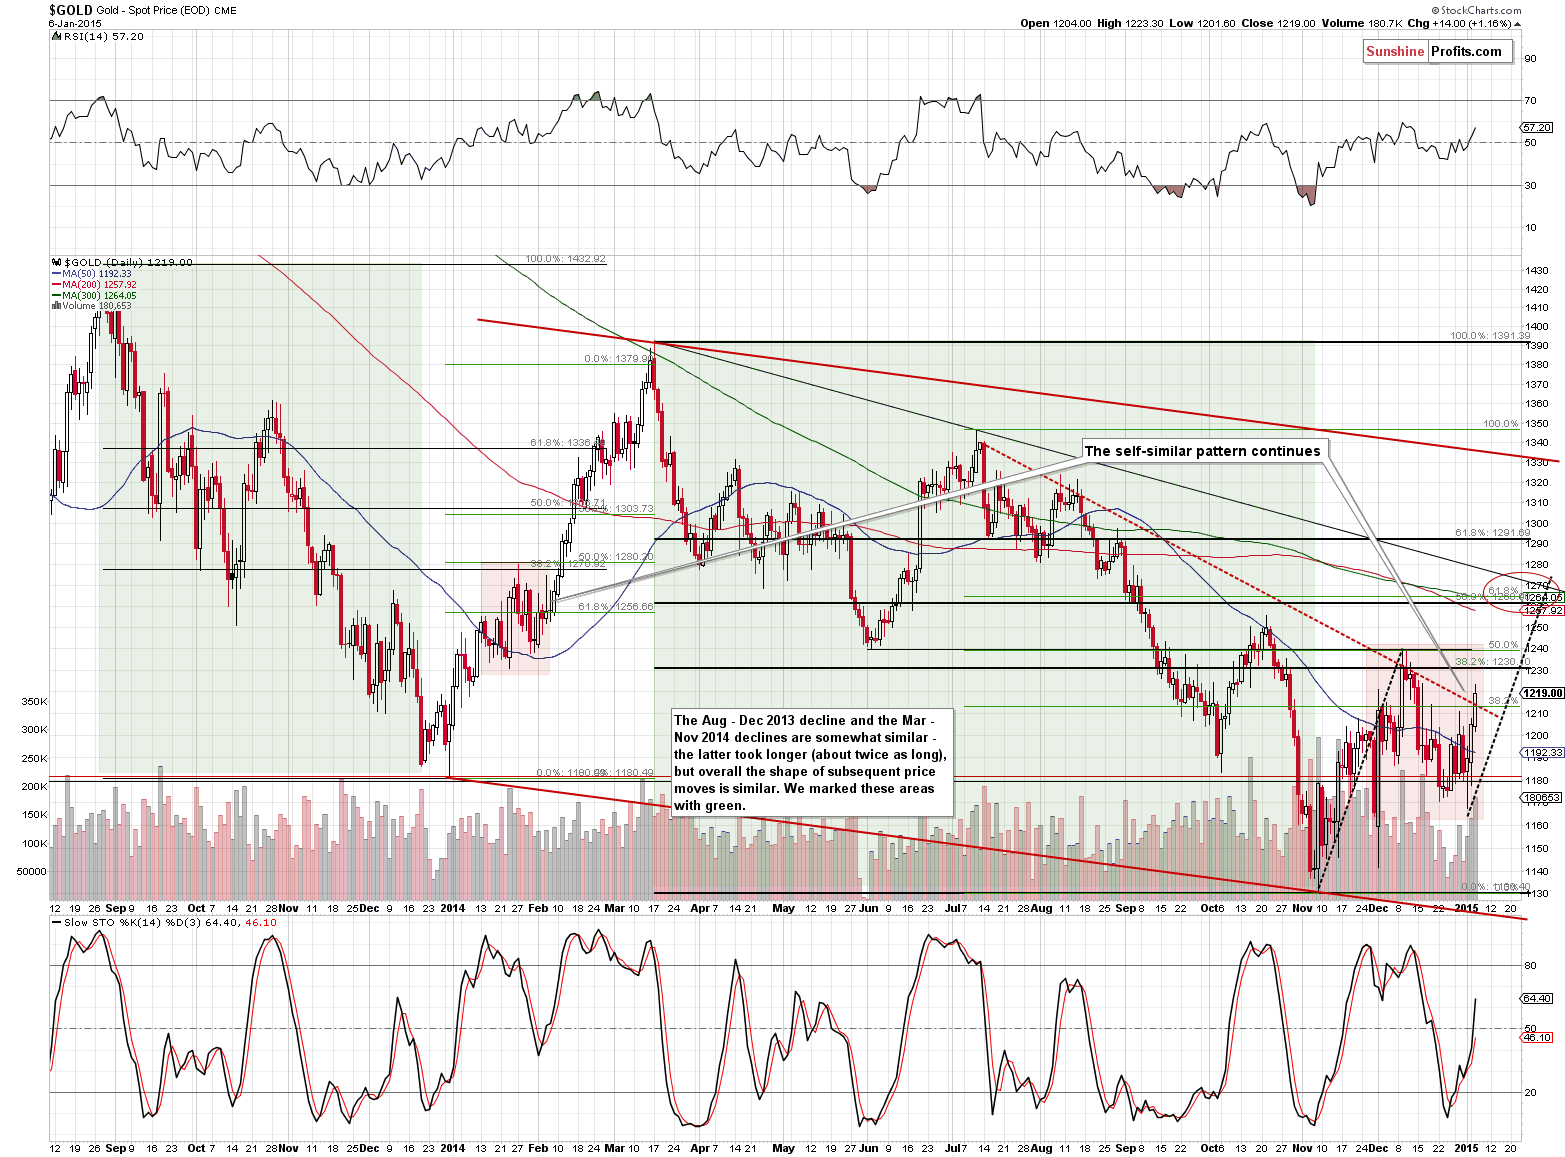
Our yesterday’s comments on the short-term chart remain up-to-date:
(…) In a way (…) gold looks like it’s about to rally as what happened in the areas marked with red rectangles is similar and both red areas follow green areas that are also similar. The more recent decline (green area) took more time than the previous one, so it’s no wonder that the post-decline consolidation took more time as well. Please note that in both cases we saw gold declining initially around the 50-day moving average, then rallying some more (above the previous high) and then a decline that didn’t take gold below the first local low. In Feb 2014, gold rallied shortly thereafter. Consequently, the implications are bullish.
How high could gold go? Probably at least to the previous local top, close to the $1,250 level, which is also where the declining medium-term resistance line is.
On the above chart we marked another – more probable – target price. The red ellipse points to targets around the $1,260 - 1,270 range.
Still, that’s just our initial target. Much will depend on the way gold reacts to the dollar’s decline and the way gold stocks react to gold’s performance – we will be monitoring the situation.
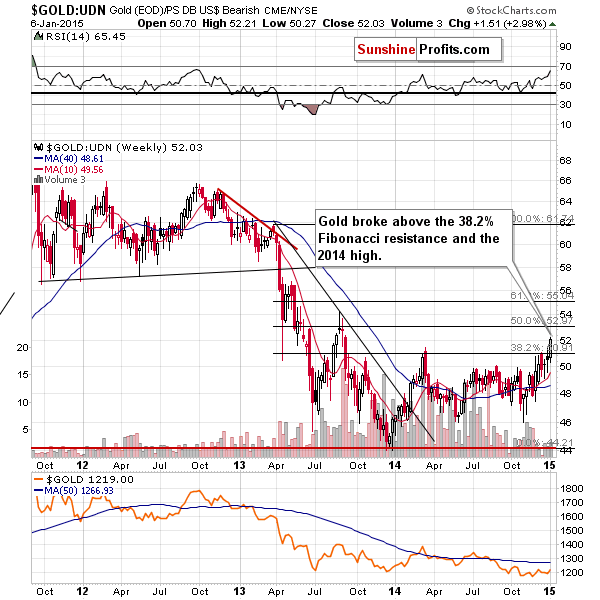
The breakout above the 2014 high in the non-USD gold price is another short-term bullish factor that points to higher gold prices in the coming days/weeks.
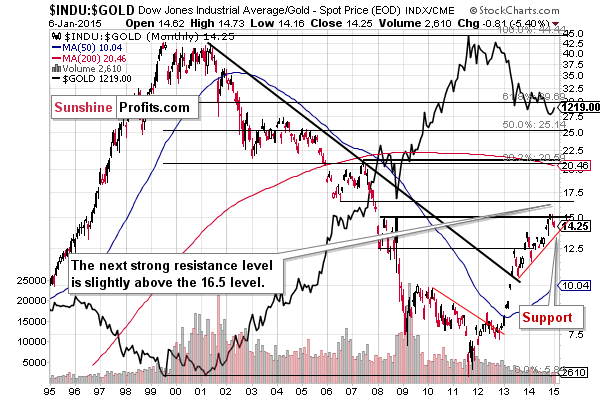
The Dow to gold ratio moved to its 2008 high so we have another factor pointing to higher gold prices – the ratio could move lower after reaching such an important resistance and gold moves inversely to this ratio. The ratio could move even higher as well, and overall the strength of this signal is not that significant. The most interesting thing that it tells us at this time is that the medium-term support (the rising red line) has not been reached yet, so gold could move higher and still decline after this support is reached.
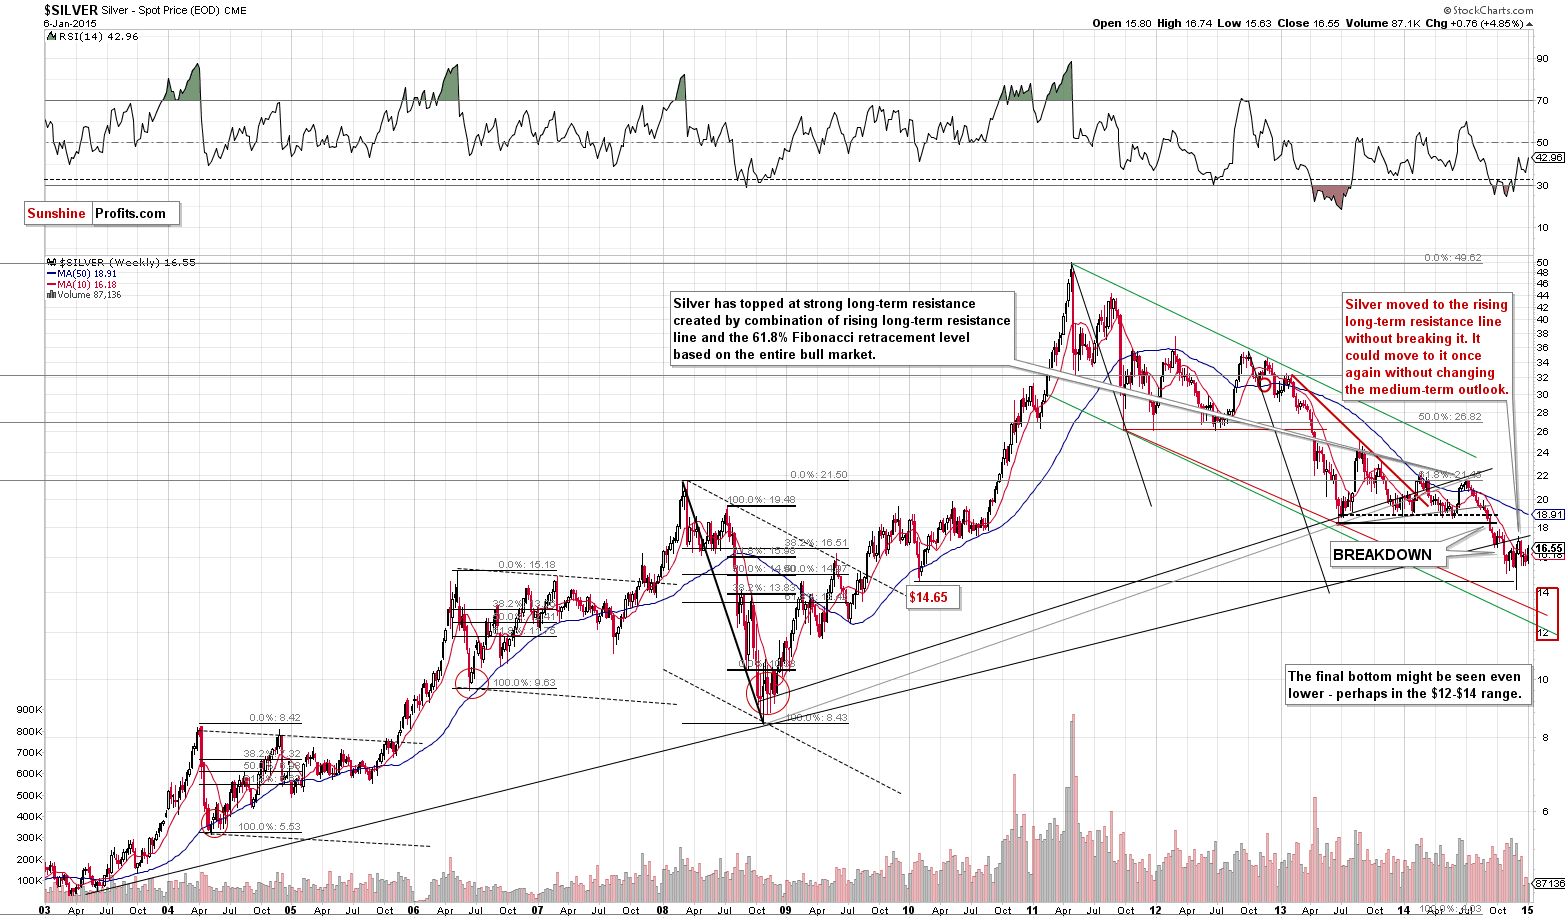
The long-term silver chart shows that the next resistance is at the recent local high and the long-term rising resistance line. Even if silver moves above this level, but stays below the 2013 lows, the medium-term outlook will remain bearish. Still, at this time it seems that silver will move higher in the short term.
Please note that both silver and mining stocks tend to be affected negatively by falling stock market prices. We’ve seen a selloff in stocks recently but silver and miners have showed strength by rallying instead of declining along with the main stock indices.
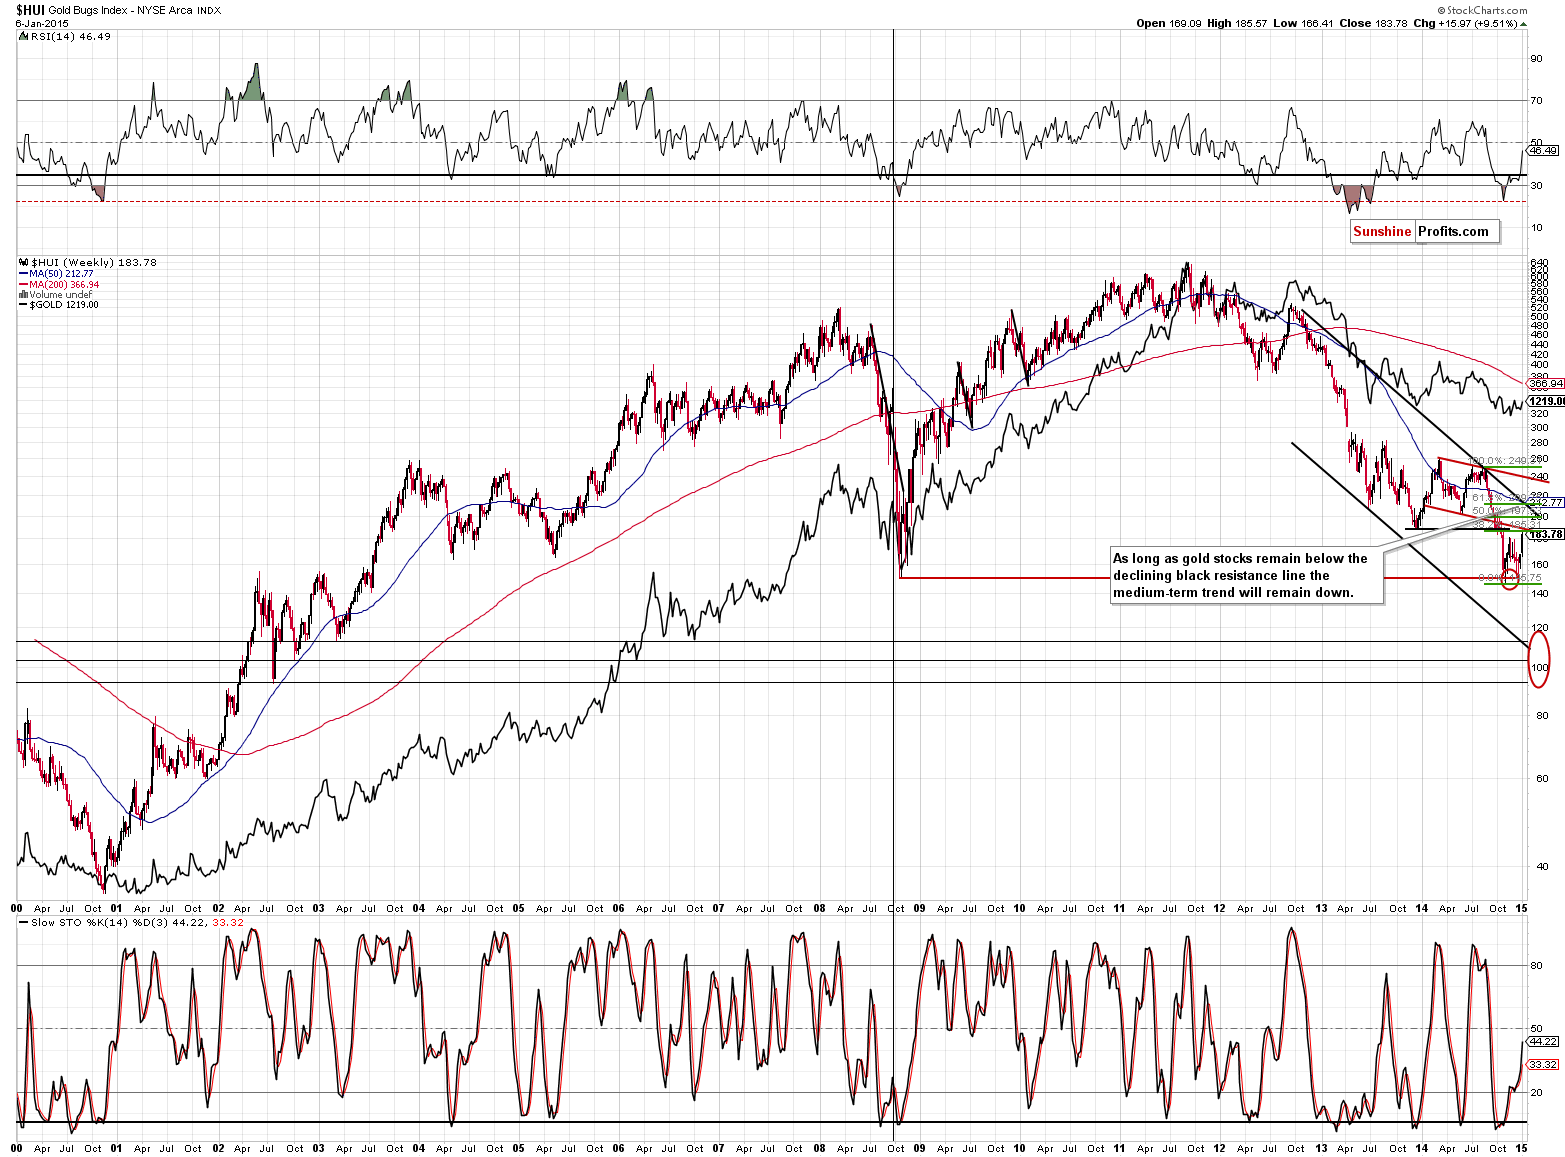
Speaking of gold stocks, They – the HUI Index - moved once again close to their 2013 low, so we wouldn’t be surprised to see a pause. However, at this time it seems that miners will move above it, because they have already showed great strength by managing to rally despite a rallying USD and declining stock market.
How high could they go? At this time it seems likely – given their recent strength – that they will move to the 213 level or so. Actually, based on their recent strength alone, they could move even higher, but there are 2 important resistance levels close to the 213 level: the 61.8% Fibonacci retracement based on the most recent decline and the declining resistance line based on the late-2013 high and the mid-2014 high.
If the HUI Index manages to confirm the breakout above this combination of resistance levels, we could see another big rally shortly after that, so this would be one of the signs that we would like to see before getting fully back in with the long-term investment capital. Please note that other factors will need to be considered as well.
Summing up, gold’s and mining stocks’ strength (another day proving it) combined with the likelihood of a relatively big corrective downswing in the USD Index made the situation more bullish not only from the short-term perspective, but also from the medium-term one. The trends in gold, silver and mining stocks remain down, so we are likely to see even lower values of precious metals and mining stocks. However, the odds that this will not be the case have increased. Does the risk/reward ratio still favor staying completely out of the precious metals market with the long-term investment capital? While it’s tempting to aim for buying back exactly at the bottom or extremely close to it, the prudent answer to this questions is “no”. The odds that this rally will become something bigger than just a corrective upswing are too high at this time (we subjectively guesstimate these odds at about 40%). Not everything is in place, but enough happened (or is about to happen, like the likely top in the USD Index) to get back in with half of the long-term investment capital.
On a short-term note, the precious metals market continues to show strength also today. The USD Index moved visibly higher once again today and is now almost right at the long-term resistance levels. Gold decline by only $8 (it’s at $1,212 at the moment of writing these words) and silver declined by only 13 cents (it’s at $16.43 at the moment of writing these words). The GDX ETF corrected about 61.8% of yesterday’s rally – it didn’t even erase it – and moved back up. The speculative full long positions are already profitable and continue to be justified in our view as it seems that they will become even more profitable.
To summarize:
Trading capital (our opinion):
It seems that having speculative (full) long positions in gold, silver and mining stocks is a good idea:
- Gold: initial target level: $1,277; stop-loss: $1,179, initial target level for the UGLD ETN: $ 14.00; stop loss for the UGLD ETN $11.10
- Silver: initial target level: $17.46 ; stop-loss: $15.44, initial target level for the USLV ETN: $25.69 ; stop loss for USLV ETN $17.91
- Mining stocks (price levels for the GDX ETN): initial target level: $21.46 ; stop-loss: $18.38 , initial target level for the NUGT ETN: $17.14 ; stop loss for the NUGT ETN $10.93
In case one wants to bet on lower junior mining stocks' prices, here are the stop-loss details and initial target prices:
- GDXJ: initial target level: $28.96 ; stop-loss: $23.87
- JNUG: initial target level: $42.46 ; stop-loss: $23.84
Long-term capital (our opinion): Half positions in gold, half positions in silver, half position in platinum and half position in mining stocks.
We continue to favor senior mining stocks over junior mining stocks, but this will likely change relatively soon as the SP Junior Long Term Indicator is already below the lower of the signal lines and as soon as it turns back up, we will see a “move from seniors to juniors” signal.
Insurance capital (our opinion): Full position
Please note that a full position doesn’t mean using all of the capital for a given trade. You will find details on our thoughts on gold portfolio structuring in the Key Insights section on our website.
As a reminder – “initial target price” means exactly that – an “initial” one, it’s not a price level at which we suggest closing positions. If this becomes the case (like it did in the previous trade) we will refer to these levels as levels of exit orders (exactly as we’ve done previously). Stop-loss levels, however, are naturally not “initial”, but something that, in our opinion, might be entered as an order.
Since it is impossible to synchronize target prices and stop-loss levels for all the ETFs and ETNs with the main markets that we provide these levels for (gold, silver and mining stocks – the GDX ETF), the stop-loss levels and target prices for other ETNs and ETF (among other: UGLD, DGLD, USLV, DSLV, NUGT, DUST, JNUG, JDST) are provided as supplementary, and not as “final”. This means that if a stop-loss or a target level is reached for any of the “additional instruments” (DGLD for instance), but not for the “main instrument” (gold in this case), we will view positions in both gold and DGLD as still open and the stop-loss for DGLD would have to be moved lower. On the other hand, if gold moves to a stop-loss level but DGLD doesn’t, then we will view both positions (in gold and DGLD) as closed. In other words, since it’s not possible to be 100% certain that each related instrument moves to a given level when the underlying instrument does, we can’t provide levels that would be binding. The levels that we do provide are our best estimate of the levels that will correspond to the levels in the underlying assets, but it will be the underlying assets that one will need to focus on regarding the sings pointing to closing a given position or keeping it open. We might adjust the levels in the “additional instruments” without adjusting the levels in the “main instruments”, which will simply mean that we have improved our estimation of these levels, not that we changed our outlook on the markets. We are already working on a tool that would update these levels on a daily basis for the most popular ETFs, ETNs and individual mining stocks.
Our preferred ways to invest in and to trade gold along with the reasoning can be found in the how to buy gold section. Additionally, our preferred ETFs and ETNs can be found in our Gold & Silver ETF Ranking.
As always, we'll keep you - our subscribers - updated should our views on the market change. We will continue to send out Gold & Silver Trading Alerts on each trading day and we will send additional Alerts whenever appropriate.
The trading position presented above is the netted version of positions based on subjective signals (opinion) from your Editor, and the automated tools (SP Indicators and the upcoming self-similarity-based tool).
As a reminder, Gold & Silver Trading Alerts are posted before or on each trading day (we usually post them before the opening bell, but we don't promise doing that each day). If there's anything urgent, we will send you an additional small alert before posting the main one.
=====
Latest Free Trading Alerts:
On Tuesday, crude oil lost 3.88% as expectations of growing supplies and concerns over the pace of global growth weighed on the price. In this way, light crude dropped to its lowest level since Apr 2009, slipping well below $50 per barrel. What’s next?
Oil Trading Alert: Crude Oil Below $50
We just saw an interesting development. This development combine with the recent slump and rebound might suggest a trading position in the Bitcoin market. Read more in the alert.
Bitcoin Trading Alert: Price Stands Still but the Outlook Might Have Changed
=====
Hand-picked precious-metals-related links:
Asian disenchantment with Western gold market manipulation
Silver Wheaton grants yet another extension to Pascua-Lama agreement
No Proof JPMorgan Not the Big Buyer of Silver Eagles
=====
In other news:
Euro zone slips into deflation, pressure on ECB
How $50 Oil Changes Almost Everything
Fed Minutes Guide: Limits of Patience, Pace of Rate Increases
UK, Greek election anxiety may see Brexit feed Grexit
=====
Thank you.
Sincerely,
Przemyslaw Radomski, CFA
Founder, Editor-in-chief
Gold & Silver Trading Alerts
Forex Trading Alerts
Oil Investment Updates
Oil Trading Alerts

