
Briefly: In our opinion speculative long positions (full) in gold, silver and mining stocks are justified from the risk/reward perspective.
The USD Index finally declined yesterday, but there was little reaction in the case of the precious metals sector. Why? Aren’t metals and miners supposed to rally given the signal from the currency market and in light of PMs’ strength in recent days (they haven’t declined despite the dollar’s rally)?
Not really. The move lower in the USD Index might have simply been too small to really make a difference. Let’s take a look at the short-term USD chart and find out (charts courtesy of http://stockcharts.com).
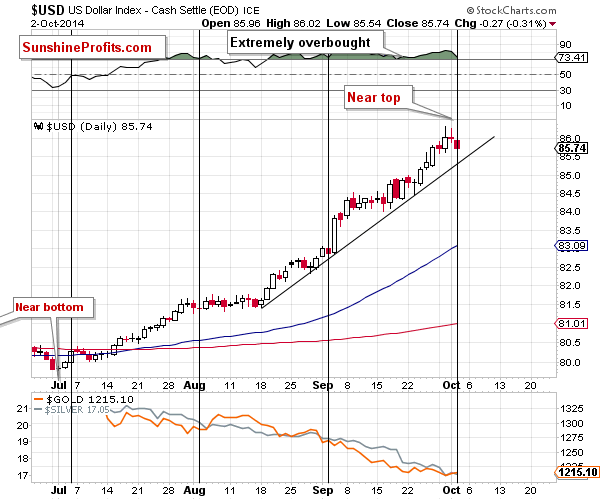
The USD Index indeed moved lower, but it didn’t decline below the rising, short-term support line. Since the trend remains up, it’s no wonder that many traders didn’t take yesterday’s decline seriously. Plus, the index declined by less than 0.5%.
Consequently, just because metals and miners didn’t react to yesterday’s decline, doesn’t mean that they won’t react significantly if the decline in the USD continues.
It seems quite likely that this will be the case. First of all, unless the USD rallies visibly tomorrow, a weekly reversal (shooting star) candlestick will be formed. This would be a particularly bearish sign given that the USD hasn’t declined (in weekly terms) for more than 10 weeks. Such a reversal (which is quite likely to be seen) is might be followed by a rather visible decline – highly likely taking the USD back below the 85 level.
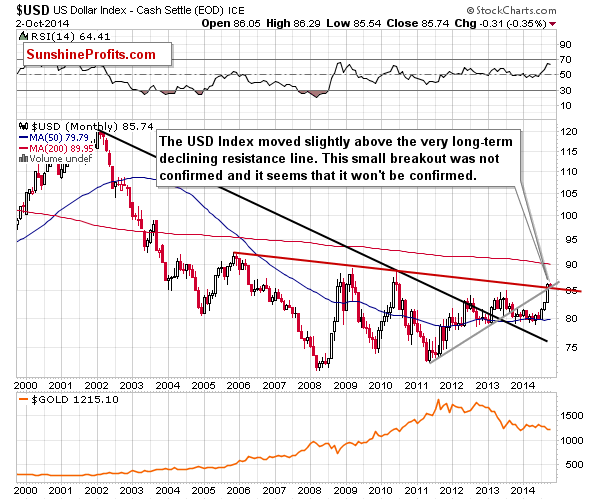
As you can see on the above chart, a move below 85 would in turn mean an invalidation of the breakout above the declining red resistance line, which would trigger further declines. Connecting the dots, it seems that the turning point was indeed the thing that started a bigger corrective downswing in the USD Index.
What about the precious metals market? It’s likely to rally temporarily (yet visibly) in our view.
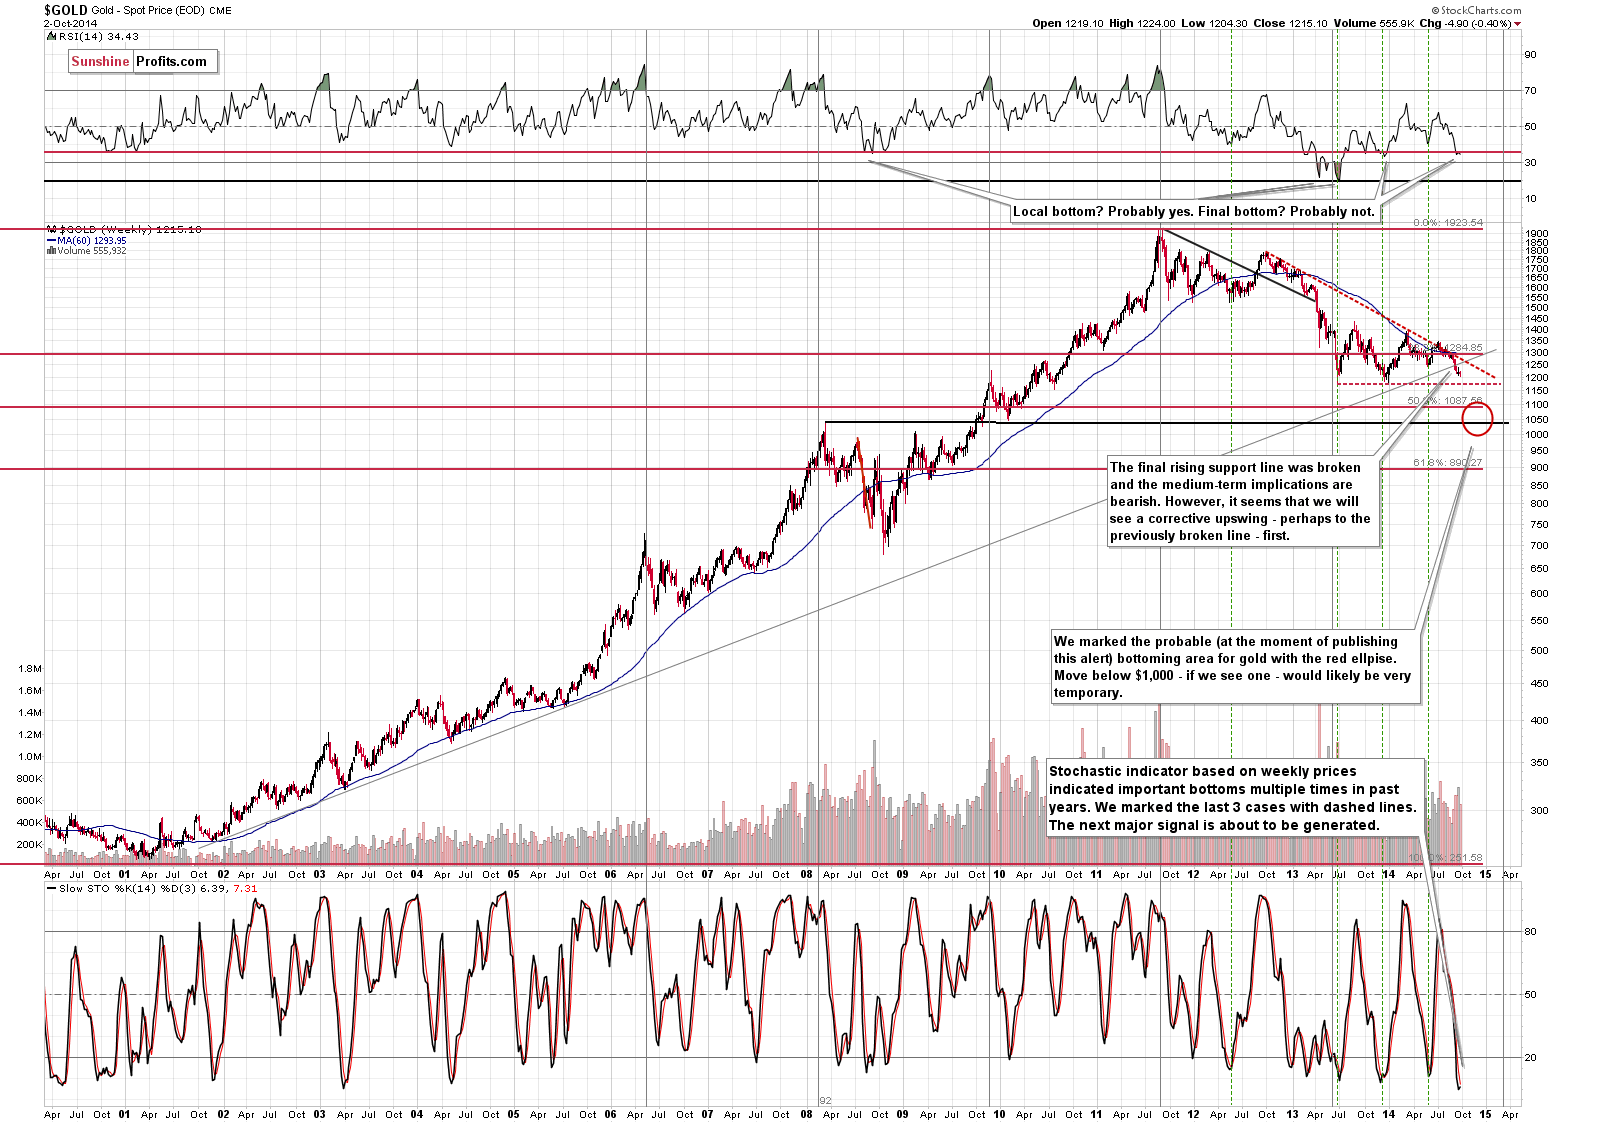
The outlook hasn’t changed in the past few days and the comments that we made in the previous alerts remain up-to-date. Today we would like to comment on an additional fact – the position of the Stochastic indicator. It’s heavily oversold and about to move above its moving average (only a little strength in gold is required), thus generating a buy signal.
Weekly buy signals from the Stochastic indicator (especially those that were generated when the indicator was below the 20 level) were exceptionally often followed by rallies that were visible from the long-term perspective (translation: tradable ones). Consequently, there is yet another reason for which we are bullish on gold in the short term.
Here’s another one:
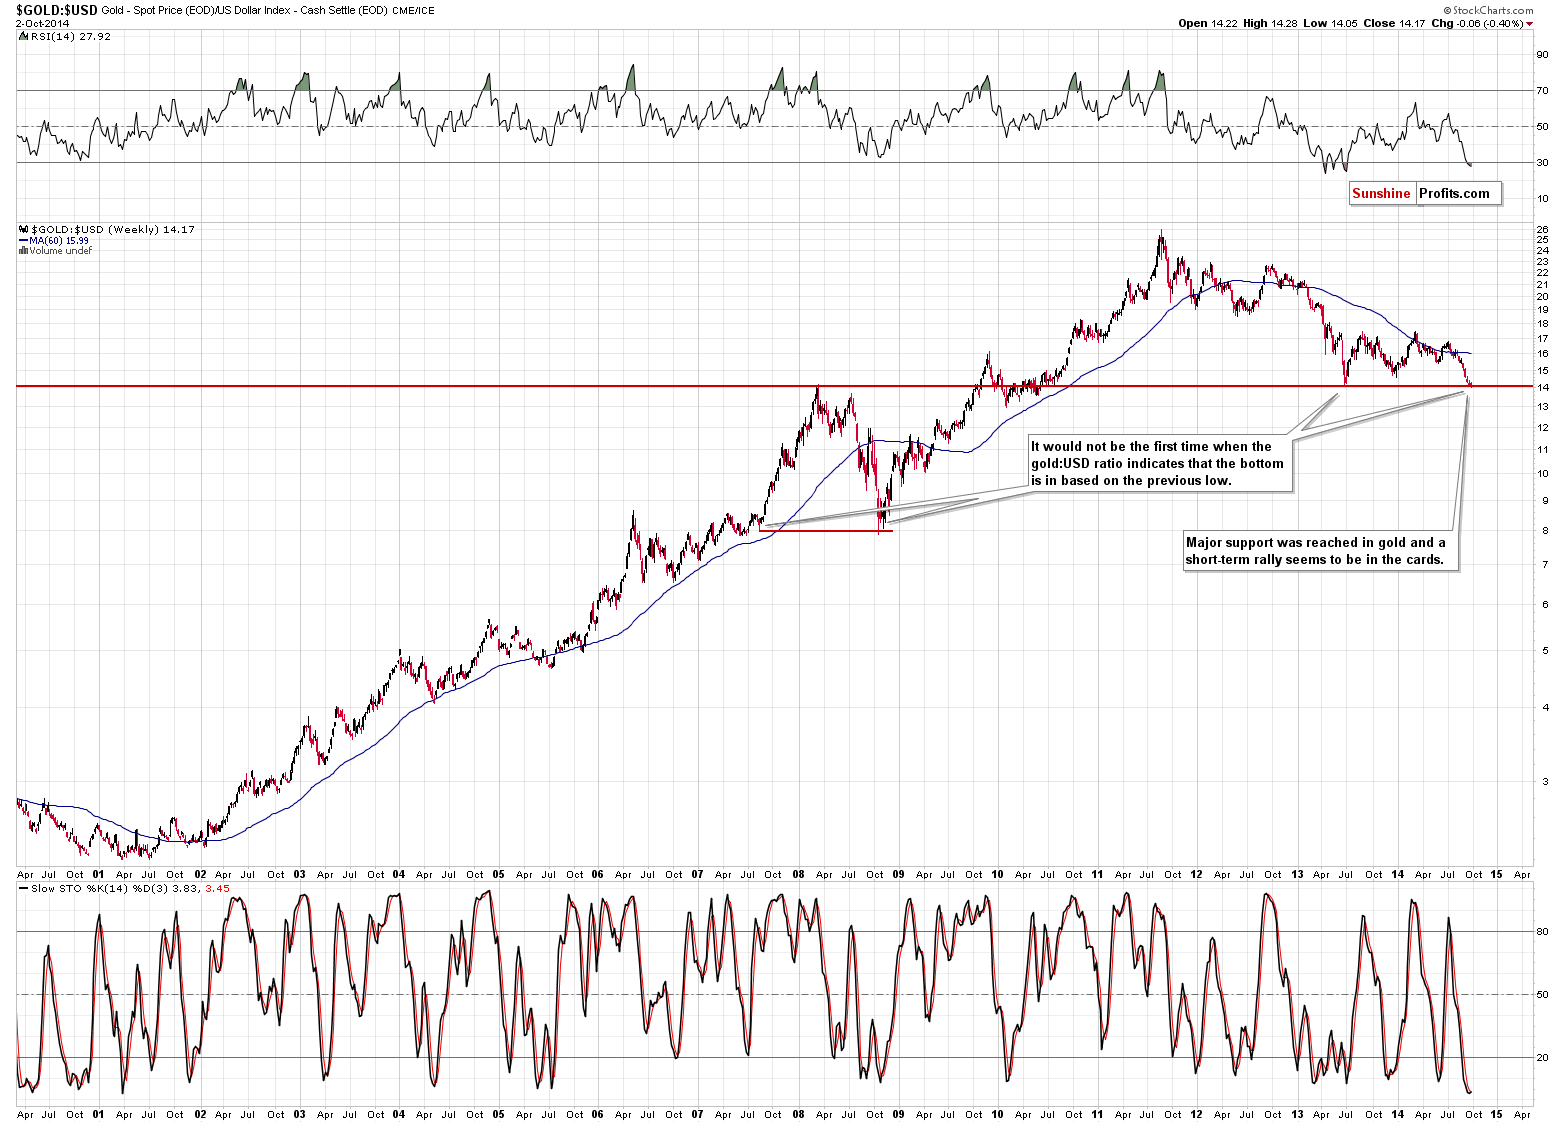
While we often comment on the gold:UDN ratio (UDN ETF trades inversely to the USD Index) as it’s the non-USD gold price (the average of gold prices in terms of currencies other than the U.S. dollar), this time we will do something opposite. The above chart features the ratio between gold and the USD Index. It doesn’t have a particular economic meaning, but it does have a technical one. Since gold – on the above chart – is priced in U.S. dollars (thus, on average and in the long run it has to move in the opposite way to the USD Index), then by dividing it by the USD Index, we make gold’s price even more sensitive to the dollar’s movement. (On a side note, today’s Oil Investment Update will feature this technique applied to the crude oil market.)
Why? Because that could help us detect gold’s turning points. Please note that back in 2008 the ratio moved to the mid-2007 bottom and turned back up. On a regular gold chart no clear support was reached (and definitely not a horizontal one). At this time the gold to USD ratio moved to a much more important support. The level that was just reached is where the ratio bottomed in 2013 and where it topped in 2008. It seems quite likely that we will see a move higher in the precious metals sector based on this chart alone, and there are also other reasons to believe so.
Take silver stocks.
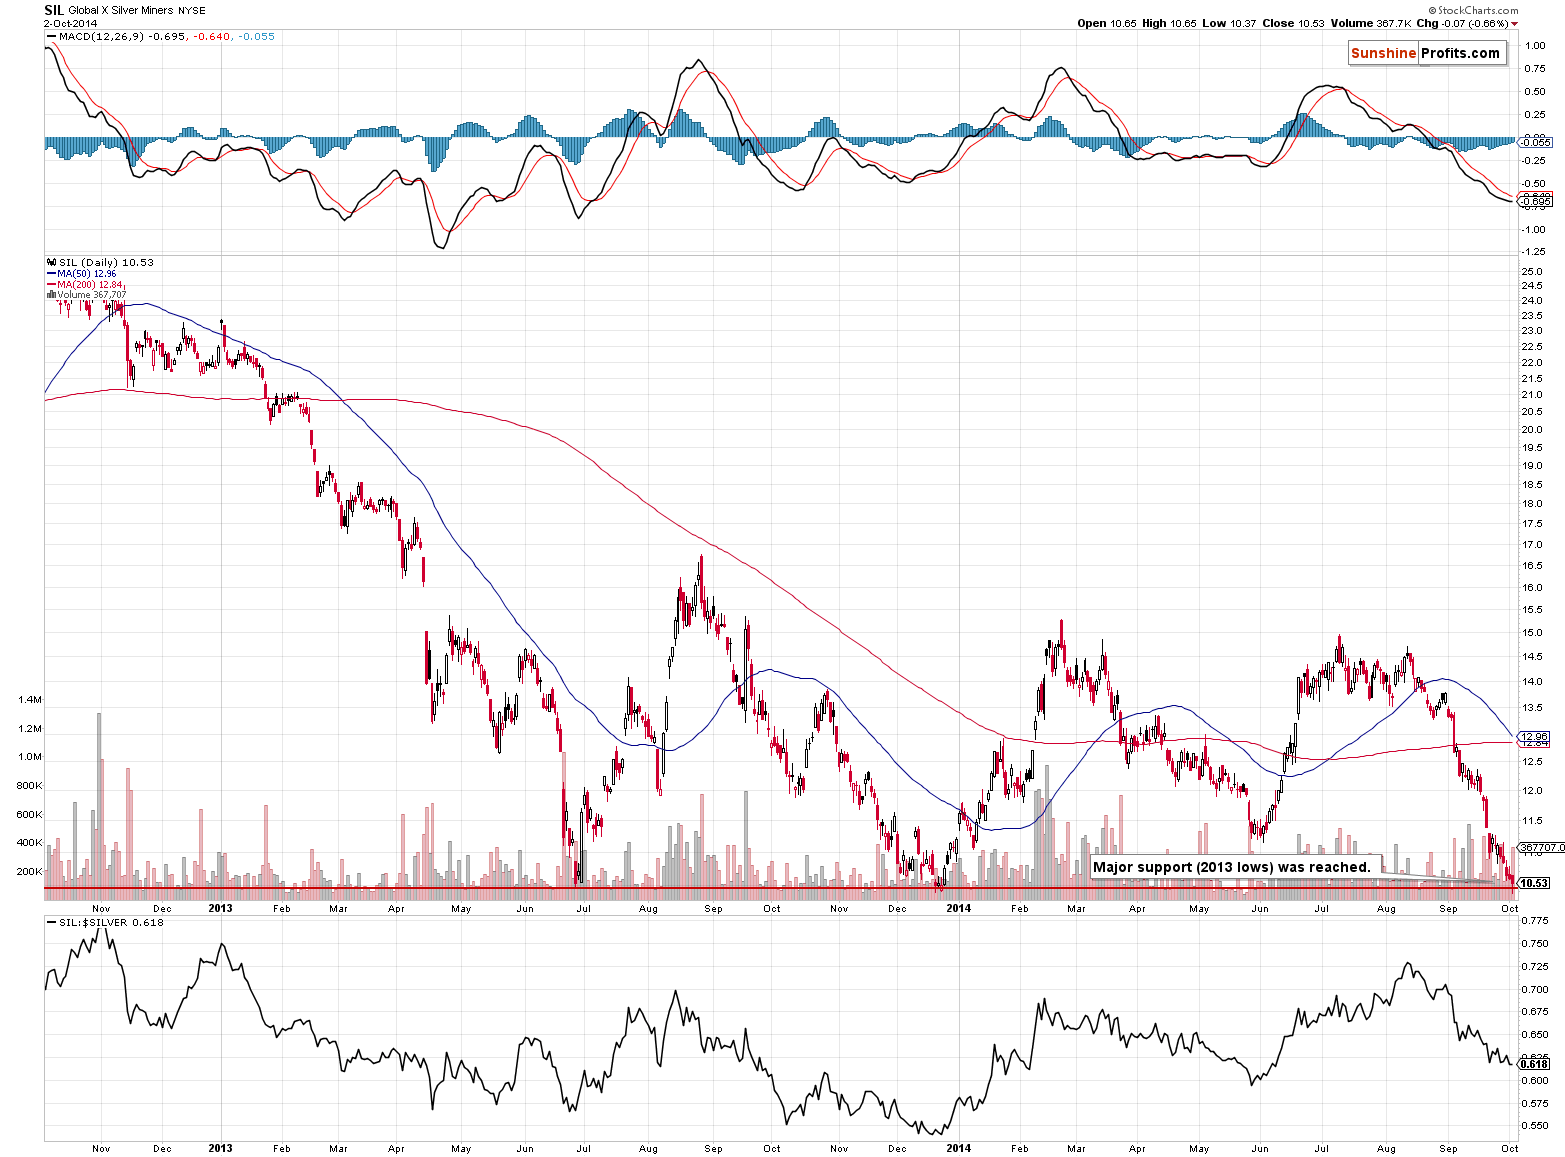
The SIL ETF (a proxy for silver stocks) just moved to the 2013 lows and reversed back up. The intra-day reversal on significant volume is bullish on its own, and this is particularly the case since silver miners reached such an important support level.
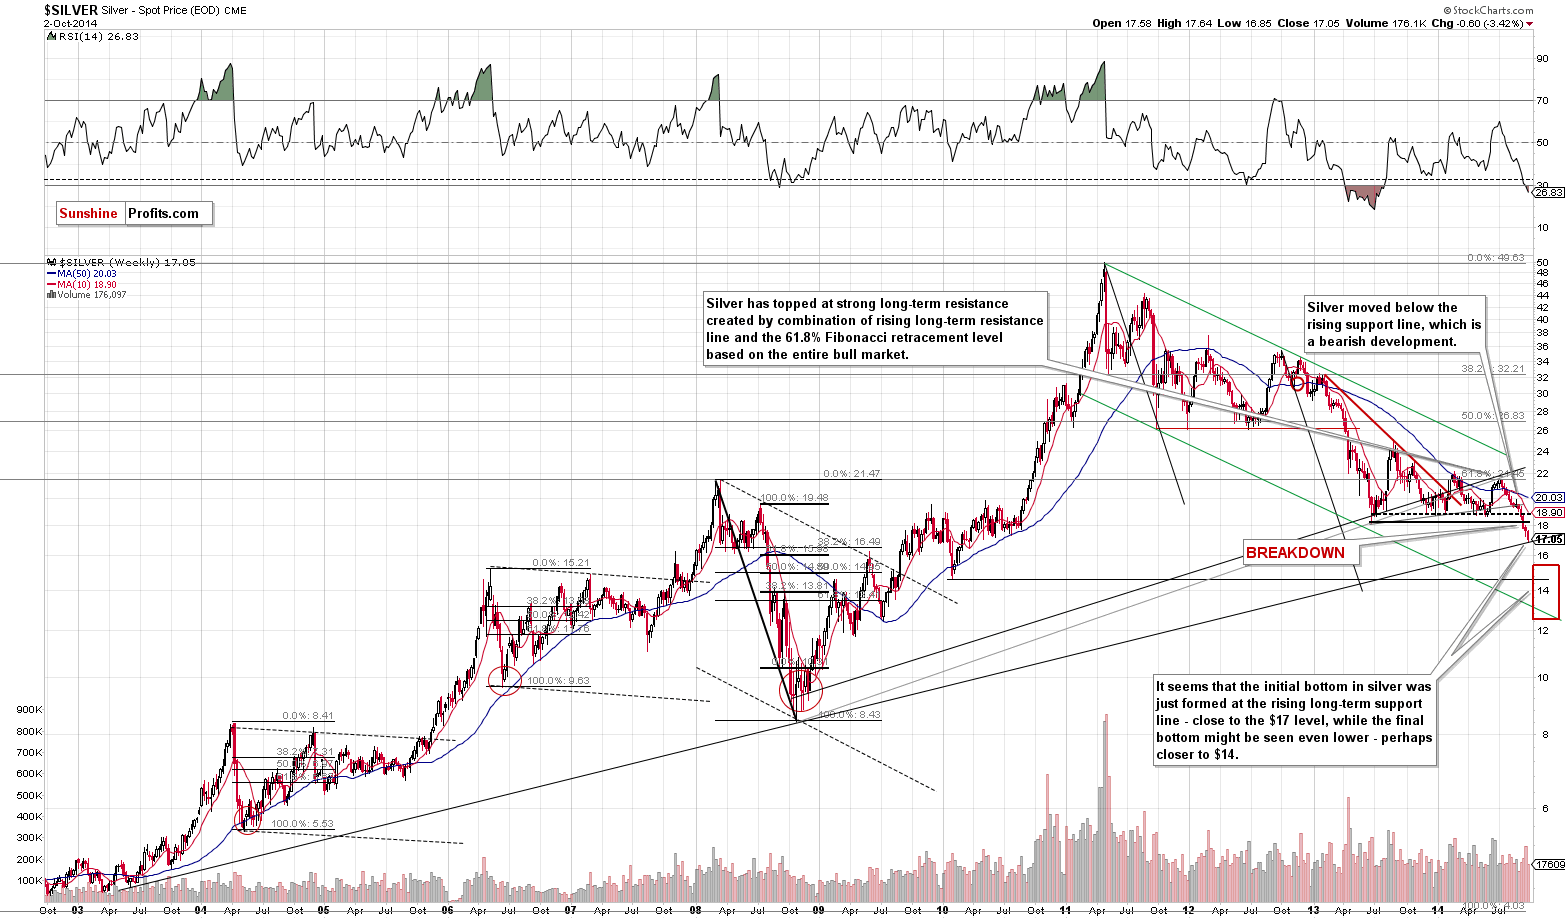
Speaking of silver, the picture remains unchanged from yesterday – the white metal is likely to move higher based on its heavily oversold status and because it reached a major, long-term support line.
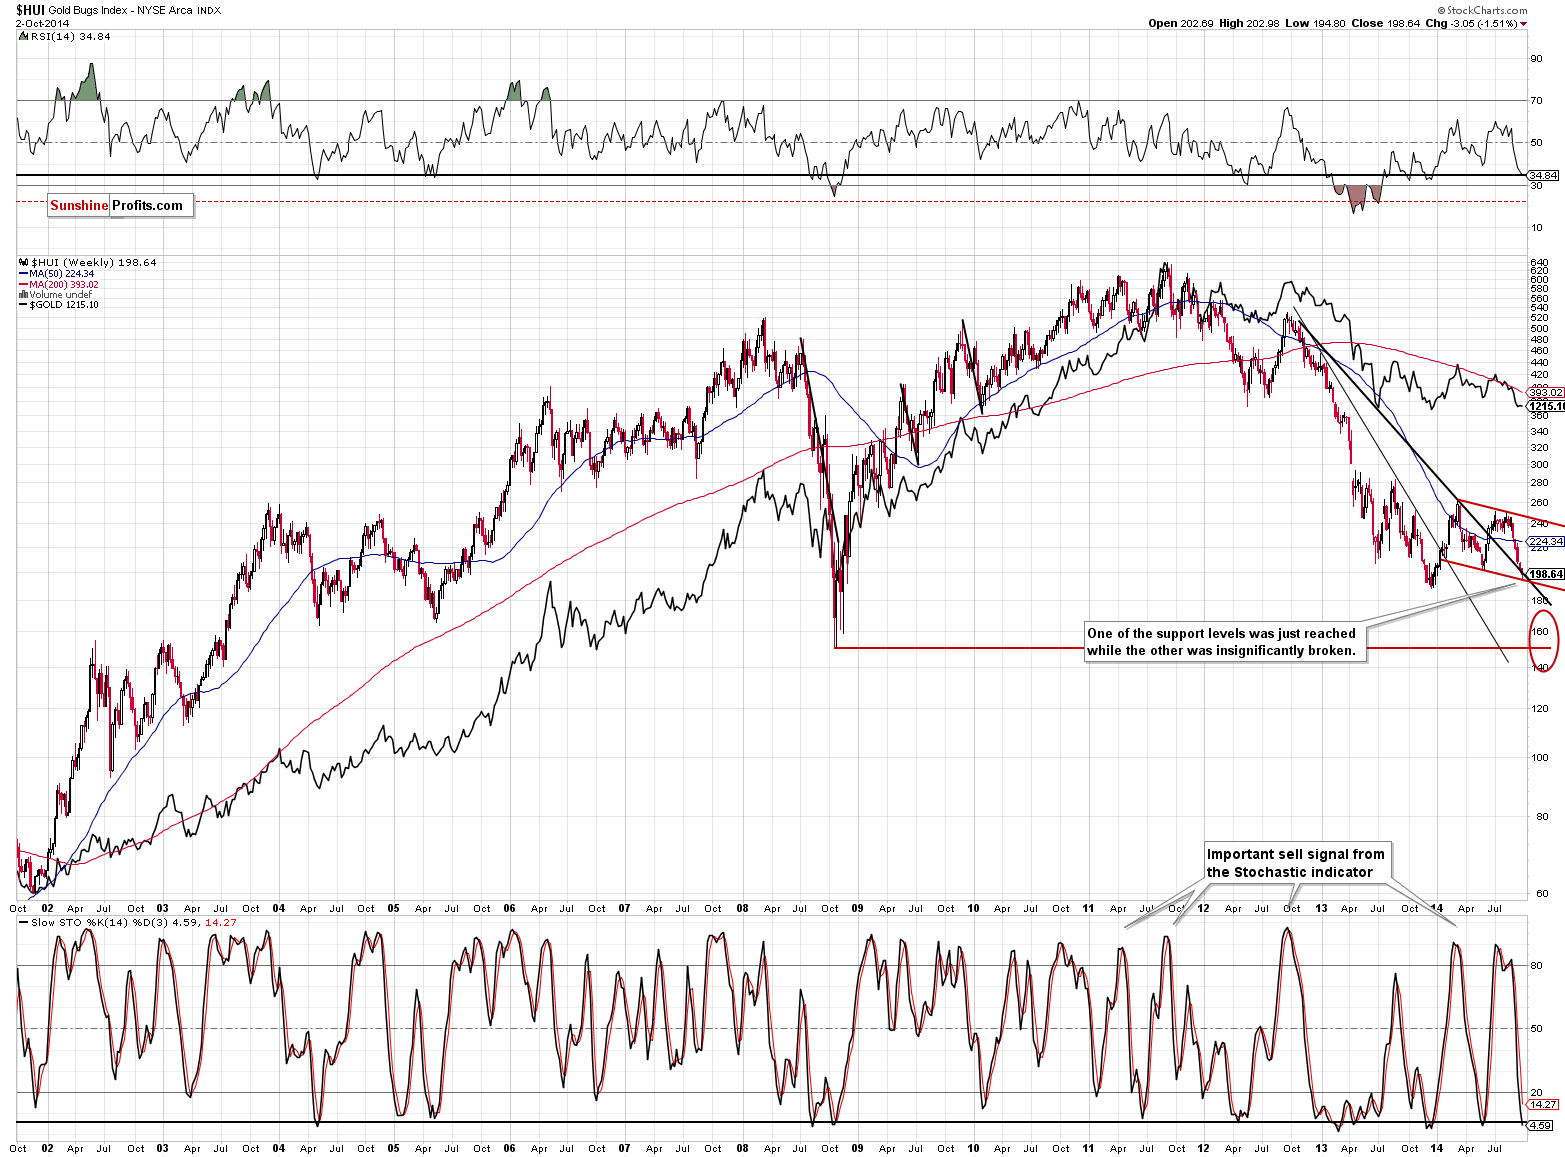
Gold stocks reversed on Thursday, almost invalidating the breakdown below the declining black support line. If we see more strength on Friday, the HUI Index will form a bullish weekly reversal hammer candlestick. It would have bullish implications for the following weeks, and it’s quite likely to take place.
Our previous comments regarding the above chart remain up-to-date:
The HUI Index moved to the declining red support line, which is created as a parallel line to the declining resistance (based on this year’s highs). Gold stocks tend to form zigzags and it seems that we are seeing the final days of the big 2014 zigzag pattern. The declining black support line was insignificantly broken, but unless we see a weekly close below this level, it doesn’t seem that this breakdown should be treated as meaningful.
Moreover, the RSI indicator based on the HUI Index provides us with a similar signal as it does in the case of silver. The RSI moved to the level that corresponded to local bottoms many times in the past, including the final bottoms in 2004 and 2005. Gold stocks are quite likely to move higher at least temporarily.
Summing up, the situation in the precious metals market is even more bullish for the short term than it was earlier this week. It seems that a bigger corrective downswing is about to be seen in the USD Index and the same goes for a bigger corrective upswing in the precious metals sector.
To summarize:
Trading capital (our opinion):
It seems that having speculative long positions in gold, silver and mining stocks is a good idea:
- Gold: stop-loss: $1,187, initial target price: $1,249
- Silver: stop-loss: $16.57, initial target price: $18.07
- Mining stocks (price levels for the GDX ETF): stop-loss: $20.94, initial target price: $23.37
In case one wants to bet on higher junior mining stock ETFs, here are the stop-loss details and initial target prices:
- GDXJ stop-loss: $32.80, initial target price: $37.14
- JNUG stop-loss: $10.94, initial target price: $16.34
Long-term capital (our opinion): No positions
Insurance capital (our opinion): Full position
Please note that a full position doesn’t mean using all of the capital for a given trade. You will find details on our thoughts on gold portfolio structuring in the Key Insights section on our website.
Our preferred ways to invest in and to trade gold along with the reasoning can be found in the how to buy gold section. Additionally, our preferred ETFs and ETNs can be found in our Gold & Silver ETF Ranking.
As always, we'll keep you - our subscribers - updated should our views on the market change. We will continue to send out Gold & Silver Trading Alerts on each trading day and we will send additional Alerts whenever appropriate.
The trading position presented above is the netted version of positions based on subjective signals (opinion) from your Editor, and the automated tools (SP Indicators and the upcoming self-similarity-based tool).
As a reminder, Gold & Silver Trading Alerts are posted before or on each trading day (we usually post them before the opening bell, but we don't promise doing that each day). If there's anything urgent, we will send you an additional small alert before posting the main one.
Thank you.
Sincerely,
Przemyslaw Radomski, CFA
Founder, Editor-in-chief
Gold & Silver Trading Alerts
Forex Trading Alerts
Oil Investment Updates
Oil Trading Alerts

