
In short: In our opinion, no positions are currently justified from the risk/reward perspective.
As you know, we generally publish / send out alerts on each trading day, and the markets are closed in the US today, but we thought you might appreciate an update earlier. Consequently, we’re posting tomorrow’s alert today.
Let’s start with gold (charts courtesy of http://stockcharts.com.)
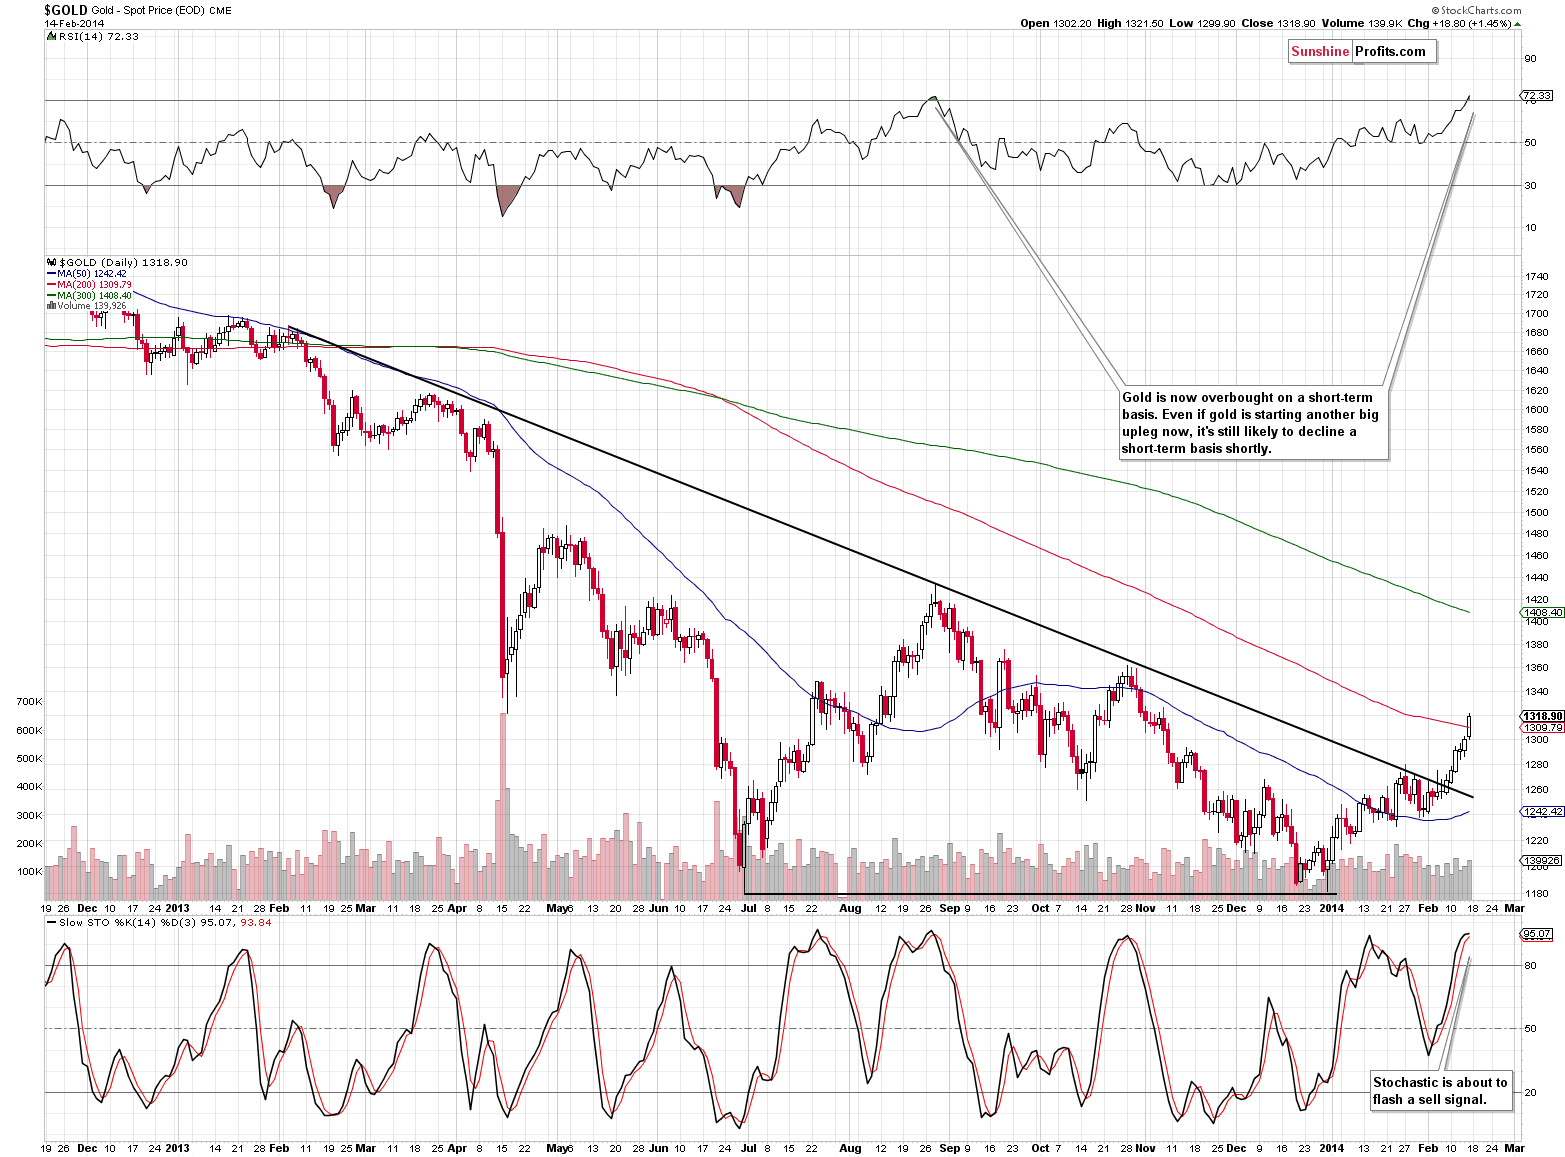
Gold moved higher and the rally above the declining resistance line is now quite significant. However, it’s overbought on a short-term basis. Taking the RSI indicator into account, it’s as overbought as it was in August 2013, when it was trading $100 higher. The Stochastic indicator is about to flash a sell signal as well. This suggests that we will likely see either a beginning of a new big decline or a correction in the rally (if one has really already begun). Either way, it looks like there soon will be a much better opportunity to go long than the one we have right now.
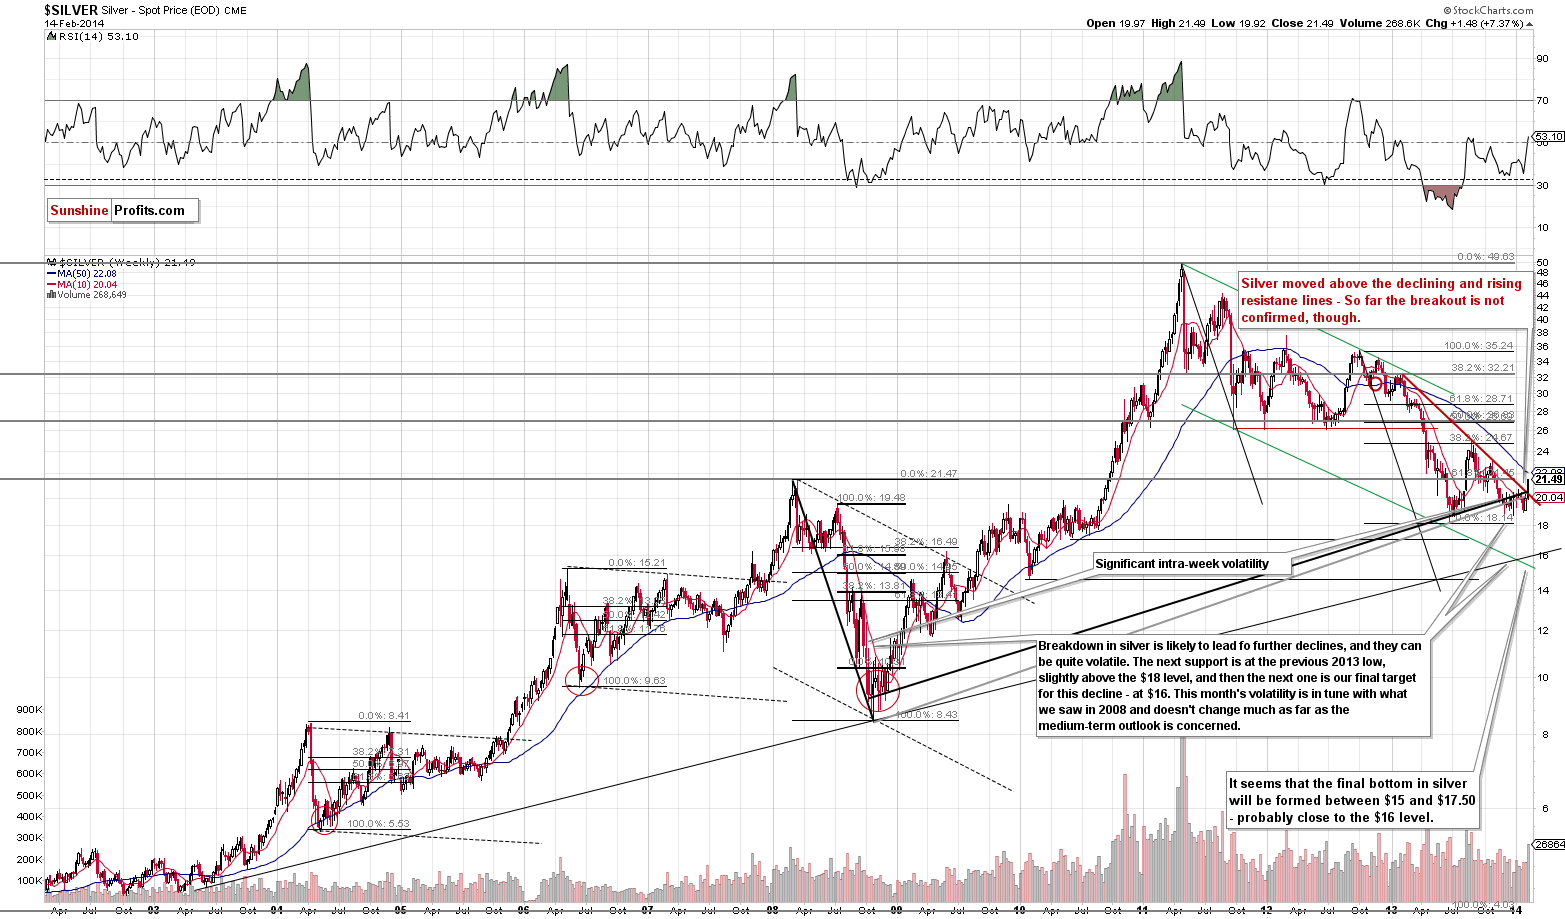
Silver has finally moved visibly higher. Friday’s rally took the white metal above both the rising and declining resistance lines. Has the outlook changed substantially based on that? Not yet, because that was just one daily close and we’re discussing resistance lines that have formed for months and years.
Speaking of unconfirmed breakouts, we also have one in gold from the non-USD perspective.
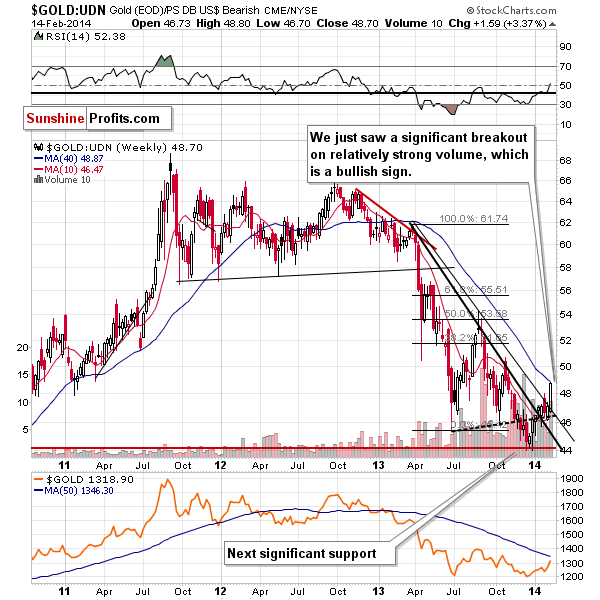
We saw a significant move above the declining resistance line, similarly to what we see on the chart with gold priced in the U.S. dollar. In this case, we only have one weekly close, so it’s unclear just how significant the breakout really is.
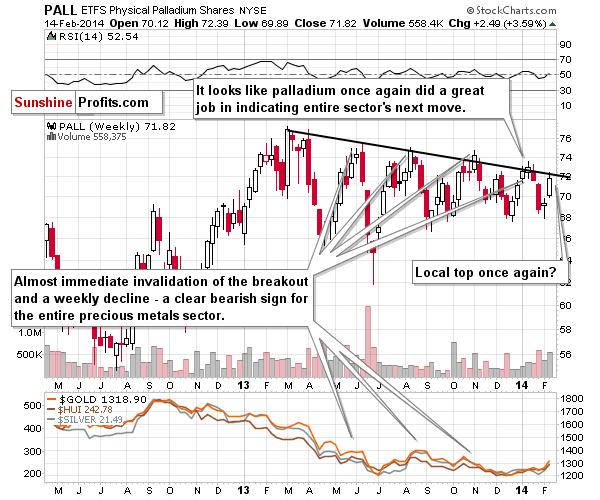
Palladium, on the other hand, moved to its declining resistance line without breaking it, and if you’ve been following our analyses for some time, you know that this has been signaling local tops in the entire precious metals sector. Consequently, whatever happens months from now, it still seems that we will see a short-term downswing shortly.
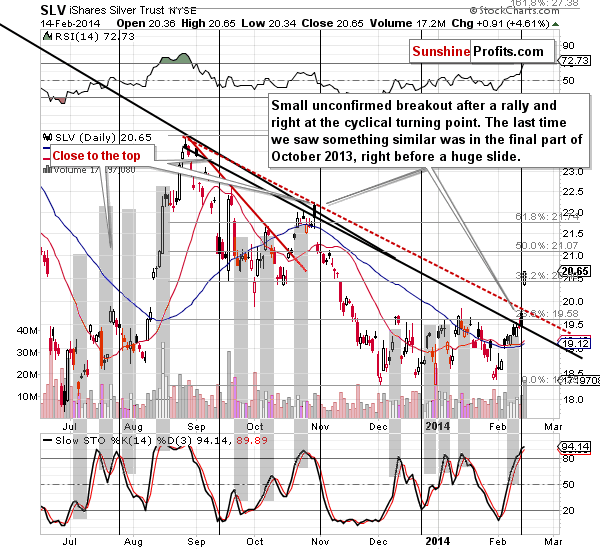
Moving back to silver, let’s keep in mind that even though silver rallied strongly on Friday, it did so very close to the turning point, which means that its still quite likely to decline in the coming days. Please note that similar action took place in September 2013 – silver rallied very sharply only to top on the following trading day and decline just as substantially on the third day.
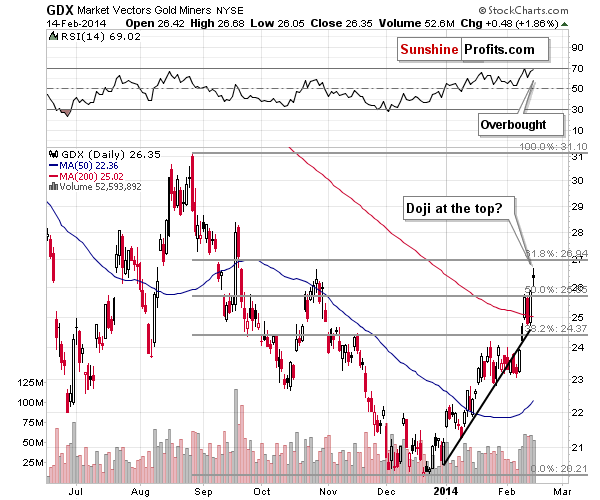
Mining stocks have rallied significantly in the past weeks and are now at their October 2013 high (which serves as resistance) and the RSI level suggests an overbought condition. Please note that we just saw a doji candlestick (the ETF closed where it had started the session and there was intra-day volatility), which is a reversal formation. It looks like either a big slide or a correction will be seen shortly.
Based on the metals’ and miners’ charts, it looks like we are very likely to see a correction or another big decline soon. Let’s see if this outlook is consistent with the situation in the currency markets.
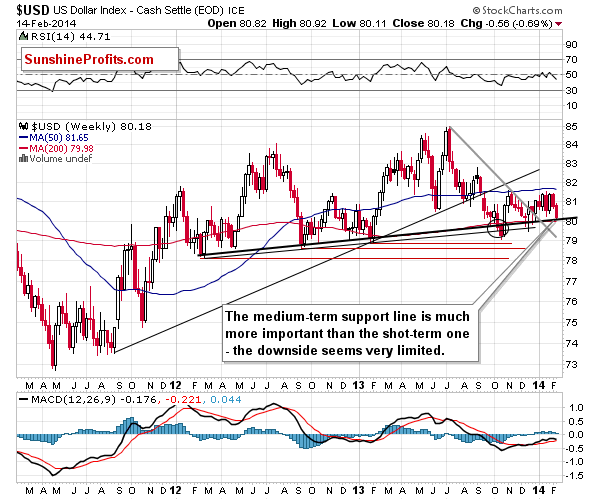
The USD Index is at the medium-term support line and the psychologically important 80 level. It definitely supports at least a correction in the precious metals sector, but it’s even more likely to cause a bigger decline.
Much of what we wrote on Friday remains up-to-date:
It’s been over a year now since the USD Index broke above the long-term resistance line, which is now support. The index is therefore likely to move much higher, probably to the 85 level. The last time we saw a rally of similar magnitude was in the first half of 2013, which is also when the precious metals sector plunged.
On the previous chart, we see that the rally could begin shortly and on the above chart we see that when it really starts, it can be quite significant.
The impact on the precious metals market is likely to be major and negative, unless metals and miners prove – and do so for more than a week or two – that they can rally along with the dollar’s upswing (like it was the case in early 2010).
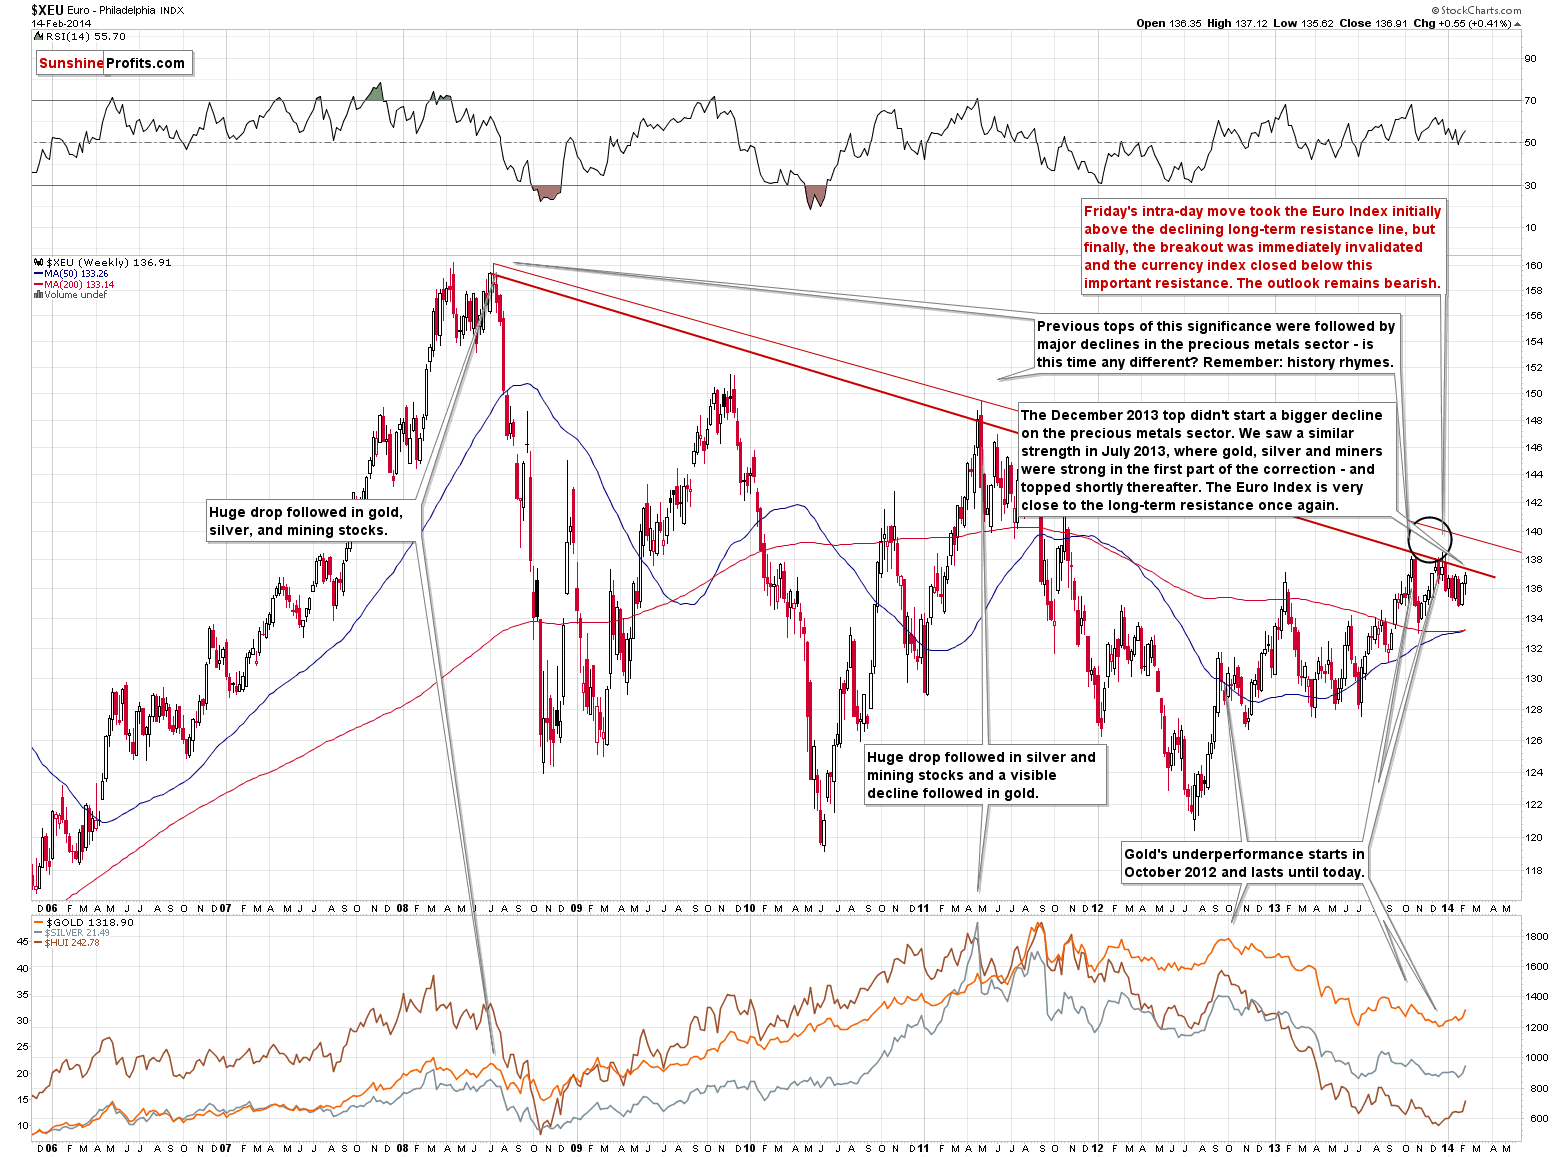
The Euro Index is very close to its long-term resistance line. This further supports the bearish outlook for the precious metals market – in the recent weeks short-term moves in the Euro Index and in gold, silver and mining stocks have been quite in tune with each other.
At this time precious metals are amplifying euro’s gains but if the decline in the euro is huge, the above strength will likely not be enough to prevent a decline in metals and miners. The point is that the resistance is significant enough to generate a big downswing.
Overall, what we wrote about the current situation on Friday remains up-to-date:
The “problem” with gold’s rally is that it is very unlikely to continue unless the USD Index gives in and declines below the medium-term line. We already saw a move very close to it yesterday and in today’s pre-market action. The USD is after a long-term breakout, and at medium-term support, which is a powerful bullish combination for the coming weeks.
If the USD Index breaks lower or it rallies strongly (not a daily rally, but at least a weekly one) and gold refuses to decline, then we will have a good indication that it’s safe to jump back into the precious metals market. At this time, we have an encouraging rally, but we also see a major threat (the USD is likely to start a significant rally) that is just waiting to impact the market.
If the USD rallies – and it seems likely that it will relatively soon – we will quite likely see invalidations of breakouts and subsequent plunges. This will be likely until either the USD breaks below the medium-term support or precious metals prove that the dollar’s substantial rally is not a major threat.
Even if the next big upswing in the precious metals market is underway, we are still likely to see a decline shortly as the situation in gold is now overbought on a short-term basis and we have bearish indications from silver’s cyclical turning points, and a doji reversal candlestick for mining stocks. We’ll be monitoring metals’ and miners’ strength during the decline to see if this is indeed a big drop or a correction.
To summarize:
Trading capital: No positions.
Long-term capital: No positions.
As always, we'll keep you - our subscribers - updated should our views on the market change. We will continue to send out Gold & Silver Trading Alerts on each trading day and we will send additional Alerts whenever appropriate.
The trading position presented above is the netted version of positions based on subjective signals (opinion) from your Editor, and the automated tools (SP Indicators and the upcoming self-similarity-based tool).
As a reminder, Gold & Silver Trading Alerts are posted before or on each trading day (we usually post them before the opening bell, but we don't promise doing that each day). If there's anything urgent, we will send you an additional small alert before posting the main one.
Thank you.
Sincerely,
Przemyslaw Radomski, CFA

