
Briefly: In our opinion short speculative positions (half) in gold, silver and mining stocks are justified from the risk/reward perspective.
Gold, silver and mining stocks didn’t do much yesterday in terms of the closing prices – they closed almost exactly where they had closed on Monday. Consequently, what we wrote in yesterday’s alert remains up-to-date. Today we will update you on 2 charts that might seem perplexing at this time – gold and mining stocks – and we will comment on gold’s (lack of) volatility. The fact that nothing changed also tells us something, but we’ll move to that in the following part of the alert.
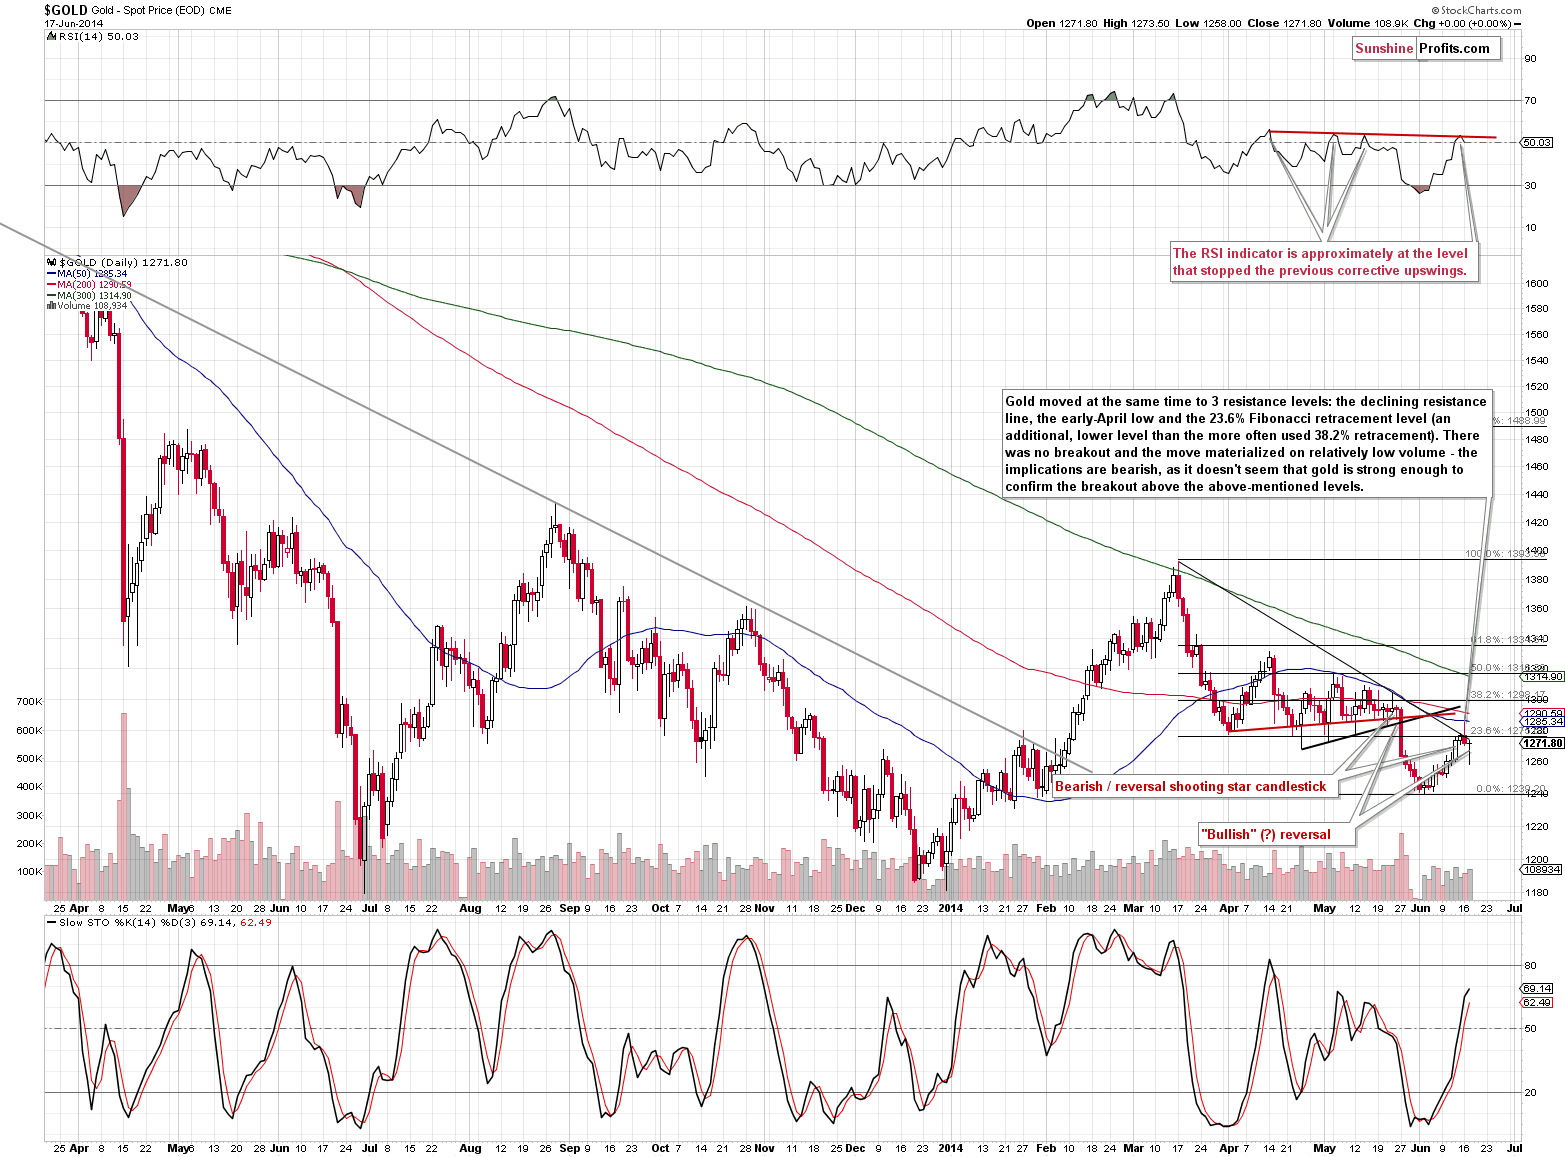
Let’s start with the gold chart (charts courtesy of http://stockcharts.com.)
Yesterday, we wrote the following:
Gold moved above the declining resistance line temporarily but then declined and finally closed below the previous day’s close, thus creating a bearish shooting star candlestick. It’s a classic reversal sign at the end of a rally.
Yesterday, we saw a mirror image of the intra-day action as gold declined initially, but then came back and closed more or less at the previous day’s closing level. If the previous intra-day move was bearish, then one might expect yesterday’s move to be bullish, and that’s what we would like to comment on. It is indeed bullish by itself (the reversal), but we now have an interesting combination of 2 subsequent reversals, which might mean something on its own as well.
It seems that it does – we saw the same pattern almost a month ago right before gold declined significantly. Interestingly, back then the intra-day upswing touched the 50-day moving average and the same was the case also this time. Overall, we don’t think yesterday’s session should really be viewed a bullish, as there are some bearish signs based on it as well.
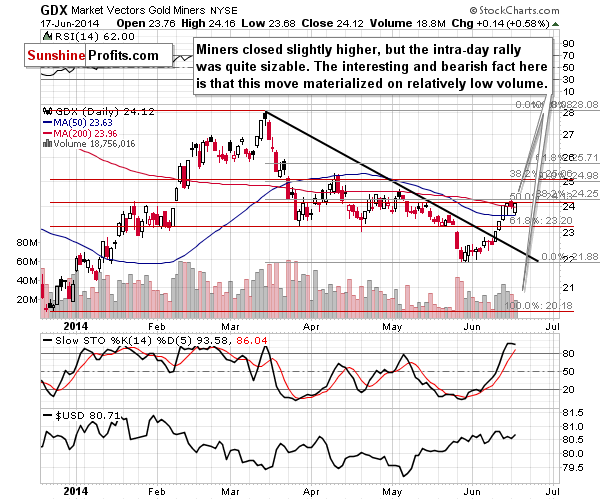
Mining stocks closed a bit higher yesterday but their daily rally is what is actually significant. The significant thing is not really the price action itself, but the volume that accompanied it – it was much lower than what we saw during the previous daily rallies and also lower than what we saw during yesterday’s small decline. At this time it looks like the buying power is drying up. The implications are bearish.
On a side note, the Golden StockPicker tool suggests considering purchasing only 3 gold stocks if one wants to profit on a short-term long position (which is not what we are suggesting at this time) – the rest of the sector (remaining 16 gold stocks) doesn’t seem to provide any advantage over owning gold. That’s also a slight indication that the sector is not yet showing real strength.
The final chart for today features gold’s volatility index.
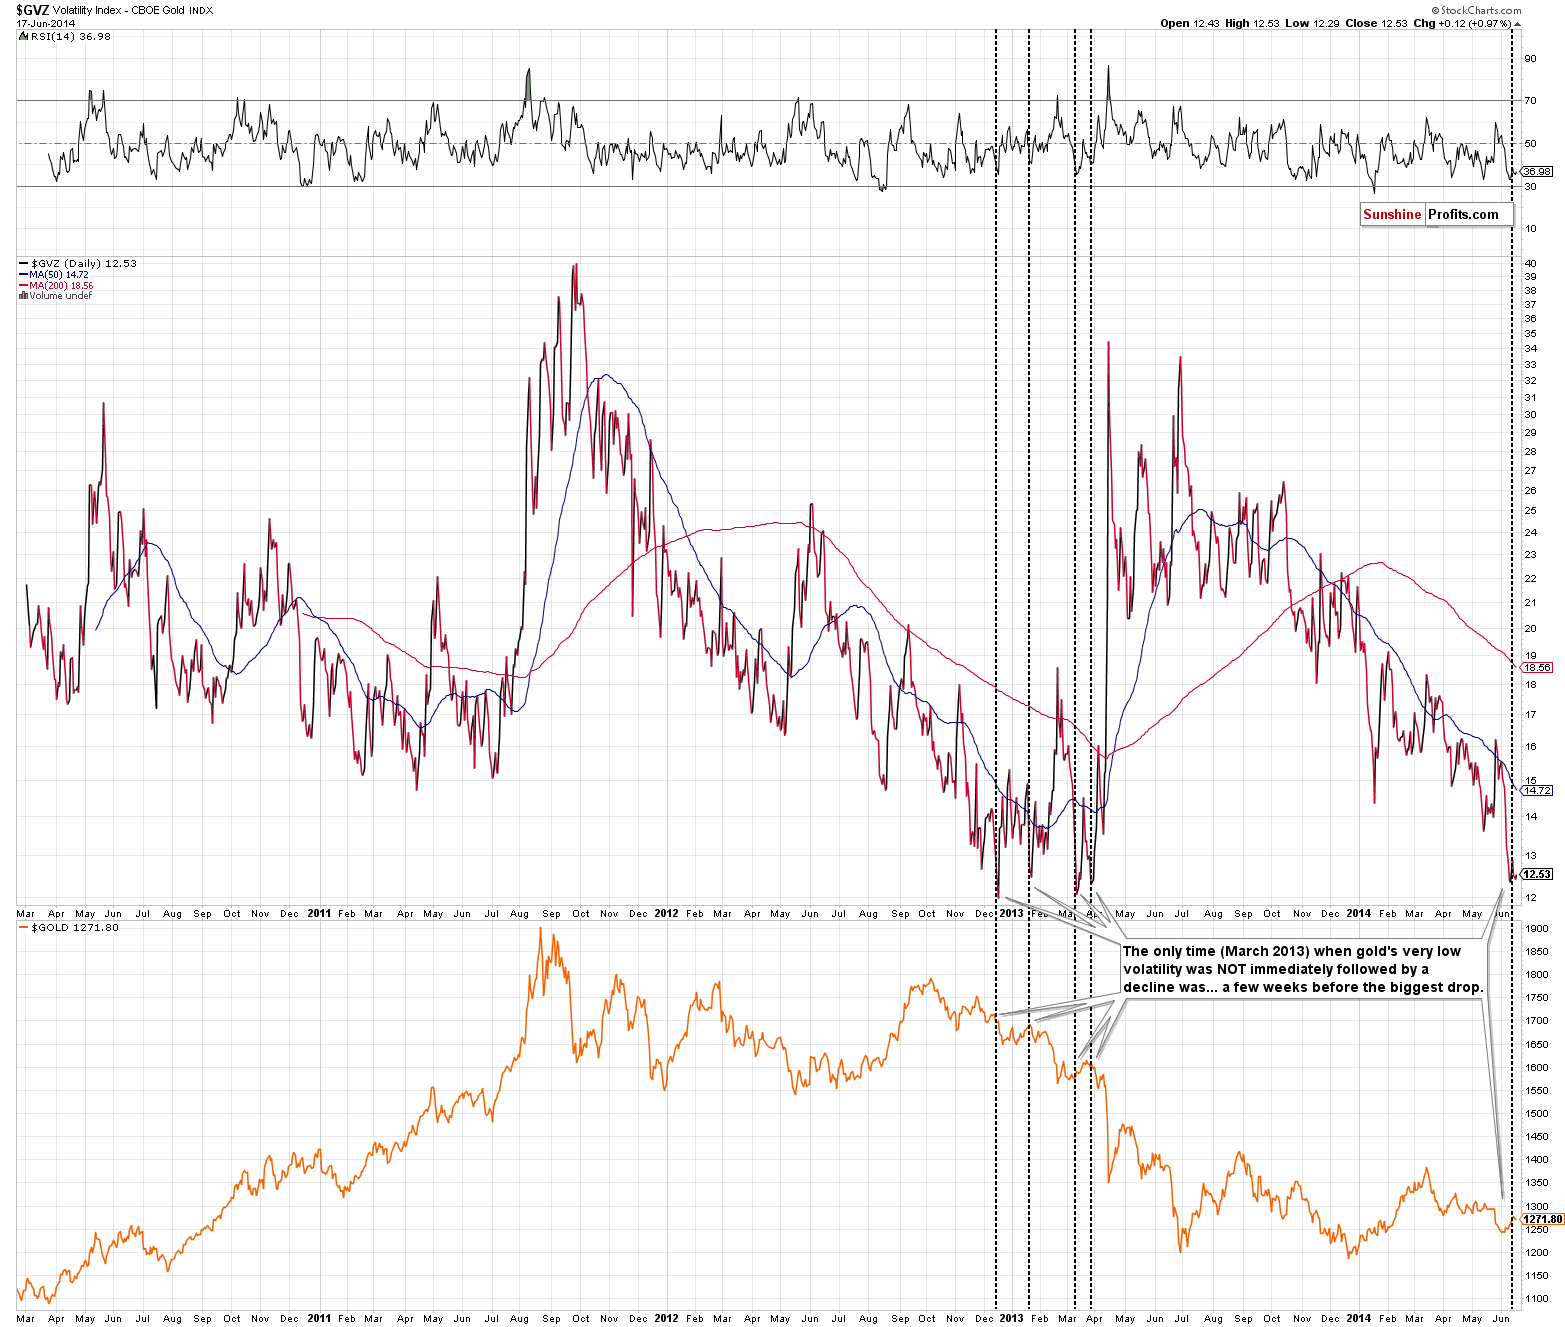
Extreme and very specific values, events, etc. are something that we are always looking for. The reason is that if there have been some similar cases and all of them or the vast majority of them have resulted in a certain outcome, then the odds are that we will see this outcome once again. Of course the more (on a relative basis) situations are followed by the same outcome, the more reliable the analogy is. Also, the more instances have been seen, the more reliable the analogy is.
In the case of gold’s volatility index we have an extremely low value, which is very specific. Gold has been this calm only a few times in the past few years, so there are not many observations to make this analogy very strong, but it’s still rather significant.
Basically all 4 times were followed by some kind of decline. In 3 out of 4 times the decline was seen immediately and the remaining time was in March 2013, just a little before the April plunge.
The likely reason is investor’s lack of interest in gold. When gold doesn’t do anything for a while, it gets… boring. Traders don’t tend to buy boring assets, simply because they don’t think they can make money on something that doesn’t move either way. They prefer to jump into a market that is already rising (or declining, but most individual traders focus on long positions). As traders leave the market, the price of gold drops. As gold drops, some long-term investors lose hope and sell their assets – and gold drops further. Why are there only a few buyers? Because they already entered the market, which didn’t make gold move to new highs. This had resulted in gold moving only a little higher, then coming a bit back down, and then rallying just a little more and so on and so forth – this is quite likely what caused the low volatility in the first place.
Generally, low volatility is not a cause of a move – it’s a visible sign of something else – the investors’ unwillingness to buy more at the current price levels and the traders’ unwillingness to bet on higher gold prices. The nature of this sign is more medium- than short-term and it’s quite interesting that at this time it’s in tune with the short-term indications coming from the price-volume analysis for mining stocks. Based on the low volatility, the precious metals sector seems to be ready to move considerably lower in the coming weeks, and based on the relatively low volume during yesterday’s upswing, it seems that we may not have to wait for long for the next decline.
Before we summarize, we would like to reply to the question that we received after posting yesterday’s alert.
Yesterday we commented on the readings from our Correlation Matrix in the following way:
The thing that we would like to emphasize are the negative values across the precious metals sector (gold, silver, gold stocks) compared with the USD Index and the general stock market. In the short- and medium term, precious metals and mining stocks are the anti-assets. The "problem" here is that the general stock market is in a medium-term uptrend, and the USD Index has already verified important breakouts. The bullish outlook for the USD and stocks is bearish for the precious metals sector.
We were asked to elaborate on the influence of the crash of the stock market which everyone is predicting in near future and of which the first hidden signs can be seen.
Our first comment is that not everyone is predicting a stock market crash in the near future. There are some signs of the coming weakness, but there are bullish signs as well. Just a few days ago we saw a survey on finance.yahoo.com with the following question: Are you bullish, bearish or neutral on the stock market three months out? 39% of respondents were bullish, 39% were bearish and 31% were neutral. This tells us that the sentiment is nowhere near the extremely positive levels, which would indicate that we are indeed likely at a major top at this time. If anything, the fact that “everyone is predicting a move lower” is a bullish factor, as it suggests a situation in which everyone who were considering moving out of the stock market, have already done so. We saw a local high – yes – but it doesn’t seem too likely, let alone clear, that the next big move in stocks is going to be to the downside.
However, if we do see a major crash in stocks, we could see a major move higher in gold or… we could see a major move lower in gold. The correlation values tell us that under normal circumstances we can expect to see the opposite move in gold to the move in stocks, however we have to point out that a “crash” might not be something normal. The question is what would trigger the decline on the stock market. If it’s something related to tightening of the monetary policy – say, an unexpected, big hike in the interest rates – then we will likely see both gold and stocks move lower. However, if stocks decline based on something related to fear, like a military conflict or bankruptcies of major institutions / companies, then we could easily see gold rally along with stocks’ decline.
For now, the uptrend in stocks and downtrend in gold remain in place and the situation is "normal".
Summing up, it seems that we are at or quite close to a local top in the precious metals sector. While the medium-term trend in the precious metals market is down, we were likely to see a corrective upswing – and we have. While in the past days it seemed that the corrective upswing was not over yet, we have some signs that it is over now. We have gold at a significant resistance line, we have short-term outperformance in silver, we have miners moving higher on low volume, and gold has made the headlines and its volatility is very low – and these are all bearish signs.
To summarize:
Trading capital (our opinion): Short positions (half) in gold, silver and mining stocks with the following stop loss orders:
- Gold: $1,306
- Silver: $20.20
- GDX ETF: $25.6
Long-term capital: No positions
Insurance capital: Full position
Please note that a full position doesn’t mean using all of the capital for a given trade. You will find details on our thoughts on gold portfolio structuring in the Key Insights section on our website.
As always, we'll keep you - our subscribers - updated should our views on the market change. We will continue to send out Gold & Silver Trading Alerts on each trading day and we will send additional Alerts whenever appropriate.
The trading position presented above is the netted version of positions based on subjective signals (opinion) from your Editor, and the automated tools (SP Indicators and the upcoming self-similarity-based tool).
As a reminder, Gold & Silver Trading Alerts are posted before or on each trading day (we usually post them before the opening bell, but we don't promise doing that each day). If there's anything urgent, we will send you an additional small alert before posting the main one.
Thank you.
Sincerely,
Przemyslaw Radomski, CFA
Founder, Editor-in-chief
Gold & Silver Trading Alerts
Forex Trading Alerts
Oil Investment Updates
Oil Trading Alerts

