
Briefly: In our opinion speculative short positions (full) in gold, silver, and mining stocks are justified from the risk/reward perspective.
Finally! Something big happened in the precious metals market. After weeks of back and forth movement without a clear direction, the precious metals market moved and it moved decisively. Let’s take a closer look (charts courtesy of http://stockcharts.com.)
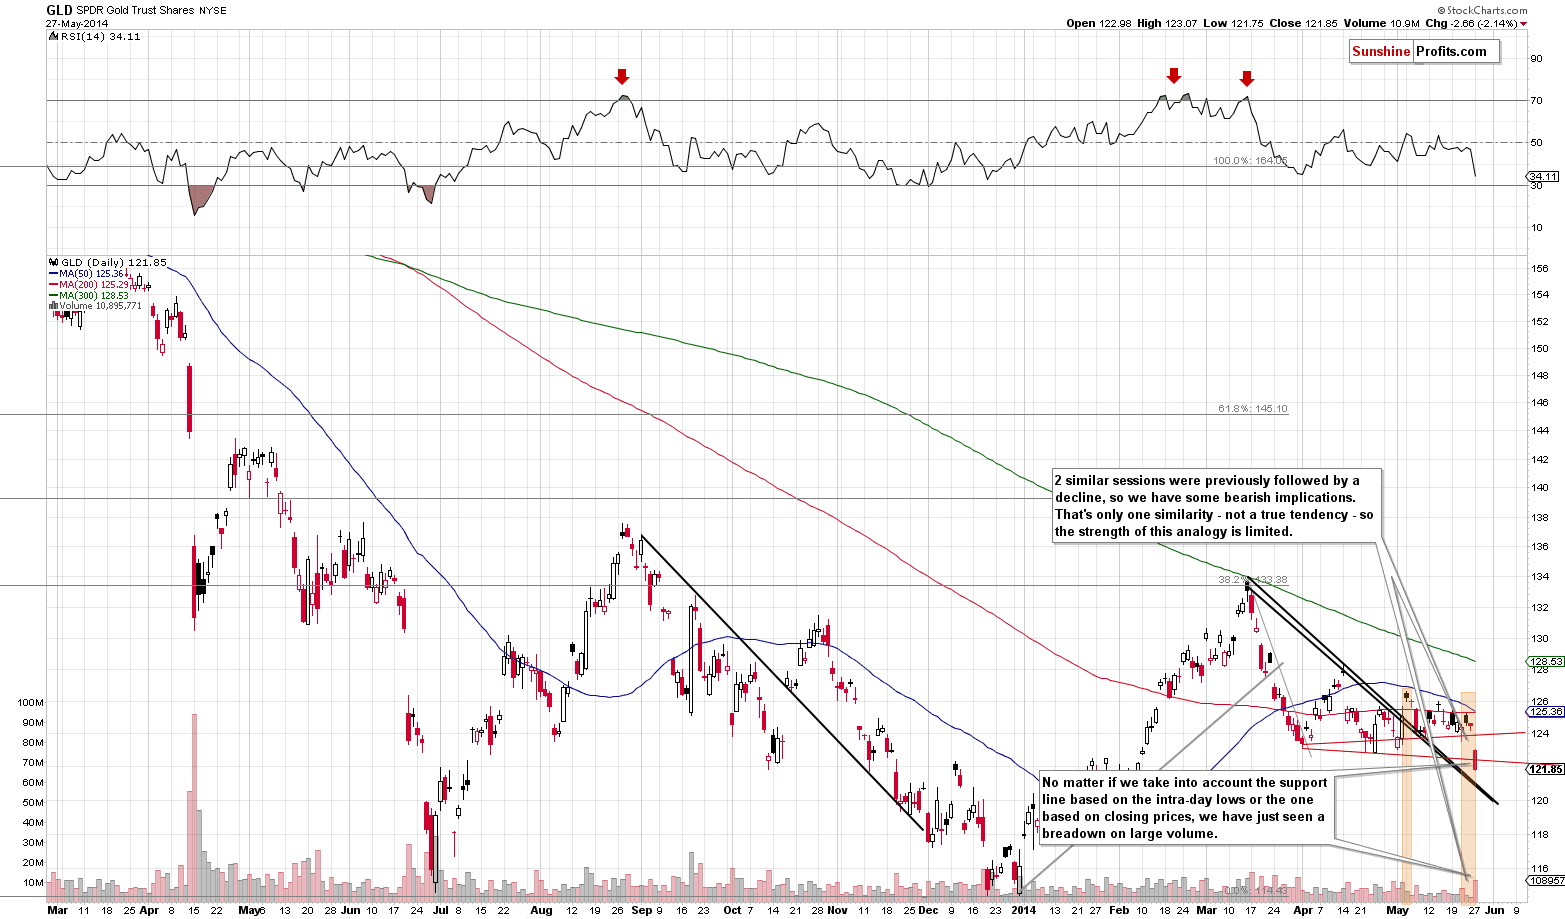
We saw a breakdown. Perhaps it will be called “the breakdown” in a few weeks when we will be looking back at this move. The reason that makes it so significant is the combination of several factors:
- Gold is still in a medium-term downtrend, which means that bigger moves to the downside are to be expected – this by itself makes yesterday’s move more believable
- Gold was in a consolidation since the beginning of April, so a breakout or breakdown from this pattern is quite significant (because the consolidation was rather significant as well)
- The move that preceded the consolidation was down (the decline in the second half of March), which means that the move following it, was also likely to be down (thus making the breakdown more believable)
- The breakdown itself took place on huge volume, which confirms the move
- GLD didn’t correct before the end of the session, thus creating a bearish candlestick pattern. In other words, it seems that GLD didn’t stop declining because it showed some strength – it only stopped declining because the session ended and it couldn’t decline more
- The breakdown was actually 2 breakdowns – below support lines created by daily lows and daily closing prices.
As you can see, there are quite a few reasons to think that yesterday’s move is indeed a bearish phenomenon, not a fake move. In fact, we think that the above combination of factors make the breakdown verified even without waiting for 2 more closes below the support/resistance lines that were just broken.
What we wrote about gold in the previous alert remains up-to-date:
We wrote that the strength that we could see here would likely be temporary. It turned out that the rally that this reversal generated was indeed very small and temporary. We saw another lower intra-day high in gold, and the move higher materialized on low volume. We’re once again seeing this bearish combination. If the USD Index confirms its breakout, gold might finally break below the short-term support.
How far can it go initially? Our best guess at this particular moment (this might change as the situation develops) is the $1,200 level or close to it. One of the ways to estimate the size of a given move is to assume that the move following the consolidation (which we’ve been seeing since the beginning of April) will be similar to the one preceding it. In this case, the move following the breakdown could be similar to the March decline, and such a move would take gold close to the $1,200 level. This level is very close to the 2013 lows, so we expect gold to pause there (but not to end the decline).
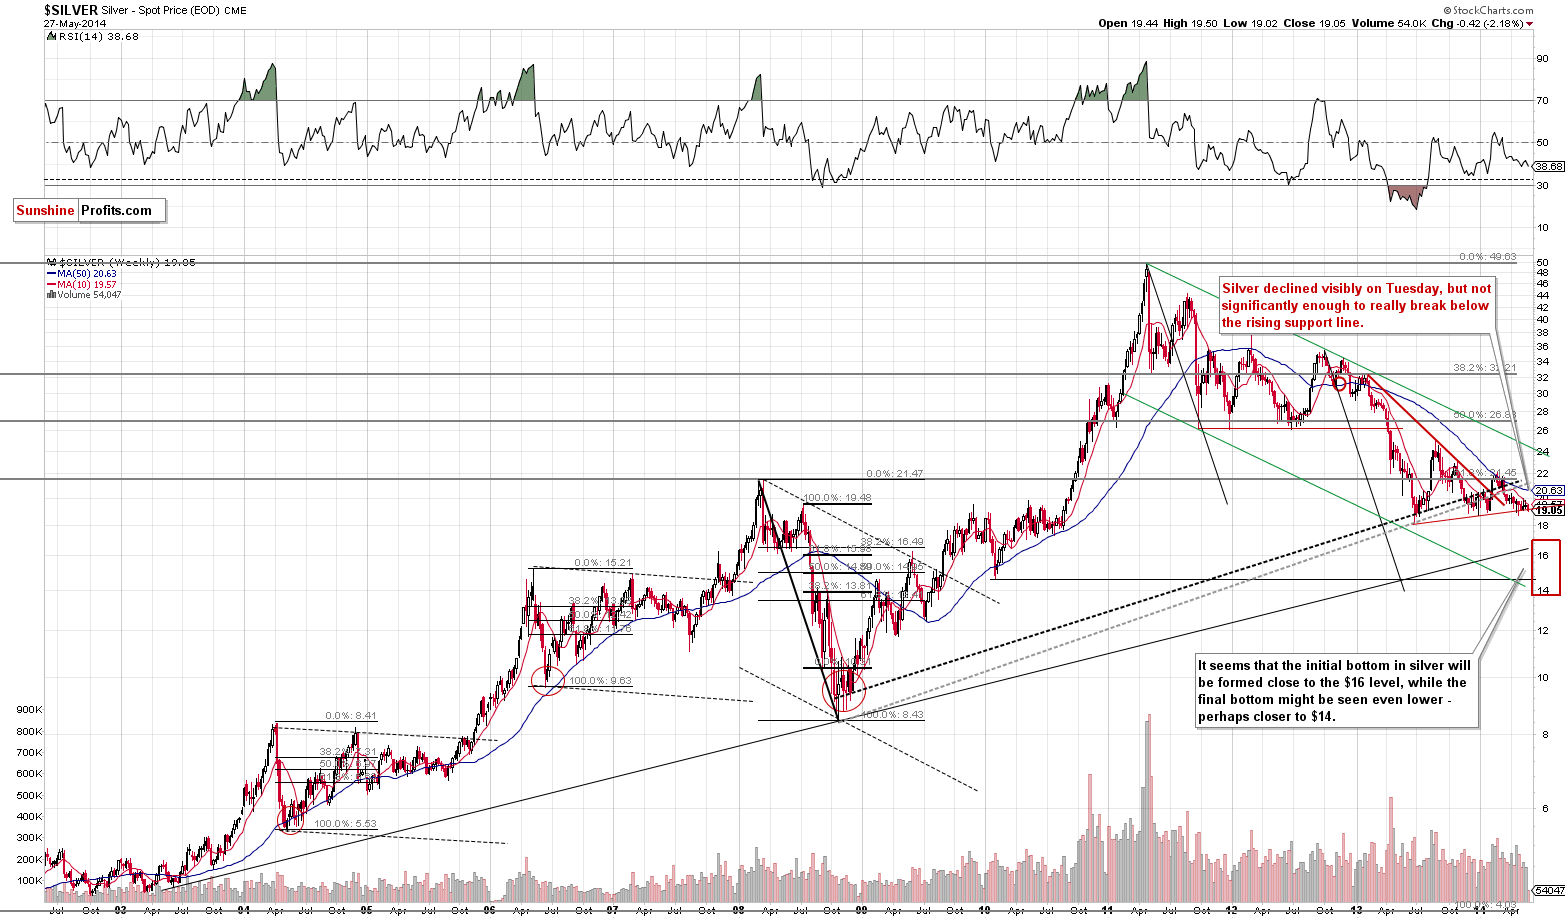
Silver declined as well, but not significantly enough to create a real breakdown below the support line. As we wrote yesterday, there is a good reason for this support to be as strong as it currently is:
In addition to the 2013 lows this is the key support level that prevents silver from moving much lower – to the $14 - $16 target area. Once this level is broken, silver may and likely will move sharply lower. Being this significant, it’s no wonder that this support line is not easy to break. Since gold, silver, and mining stocks are highly correlated in the short term, it’s also no wonder that silver’s refusal to move lower already is accompanied by a similar refusal in the case of gold and mining stocks.
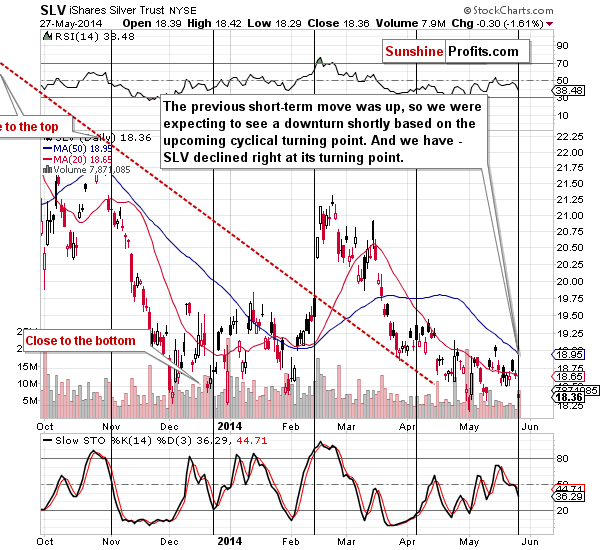
On a short-term basis we see that silver declined right at its cyclical turning point. The previous very short-term move was up, so that’s the normal reaction that we had expected to see here.
Overall, it seems that the move lower in the precious metals sector was not significant enough to generate a breakdown in silver but it was enough to generate a breakdown in gold – simply because the support in silver was stronger. It was also stronger than the support in the mining stocks, and thus it’s no wonder that the miners declined visibly, just like gold did.
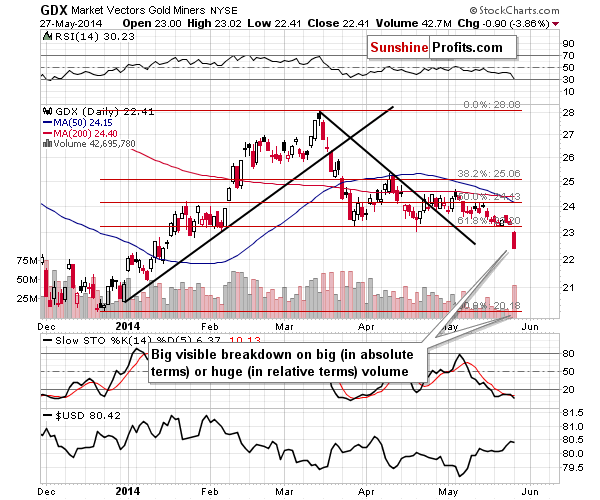
The slide in the mining stocks was even more visible than the one in gold. The volume was huge and so was the drop. The GDX ETF declined almost 4% in just one day. The (bullet) points that we made about the breakdown in gold apply to mining stocks as well. These two markets confirm each other’s breakdown.
What about the situation seen from the big perspective? Has the decline changed anything?
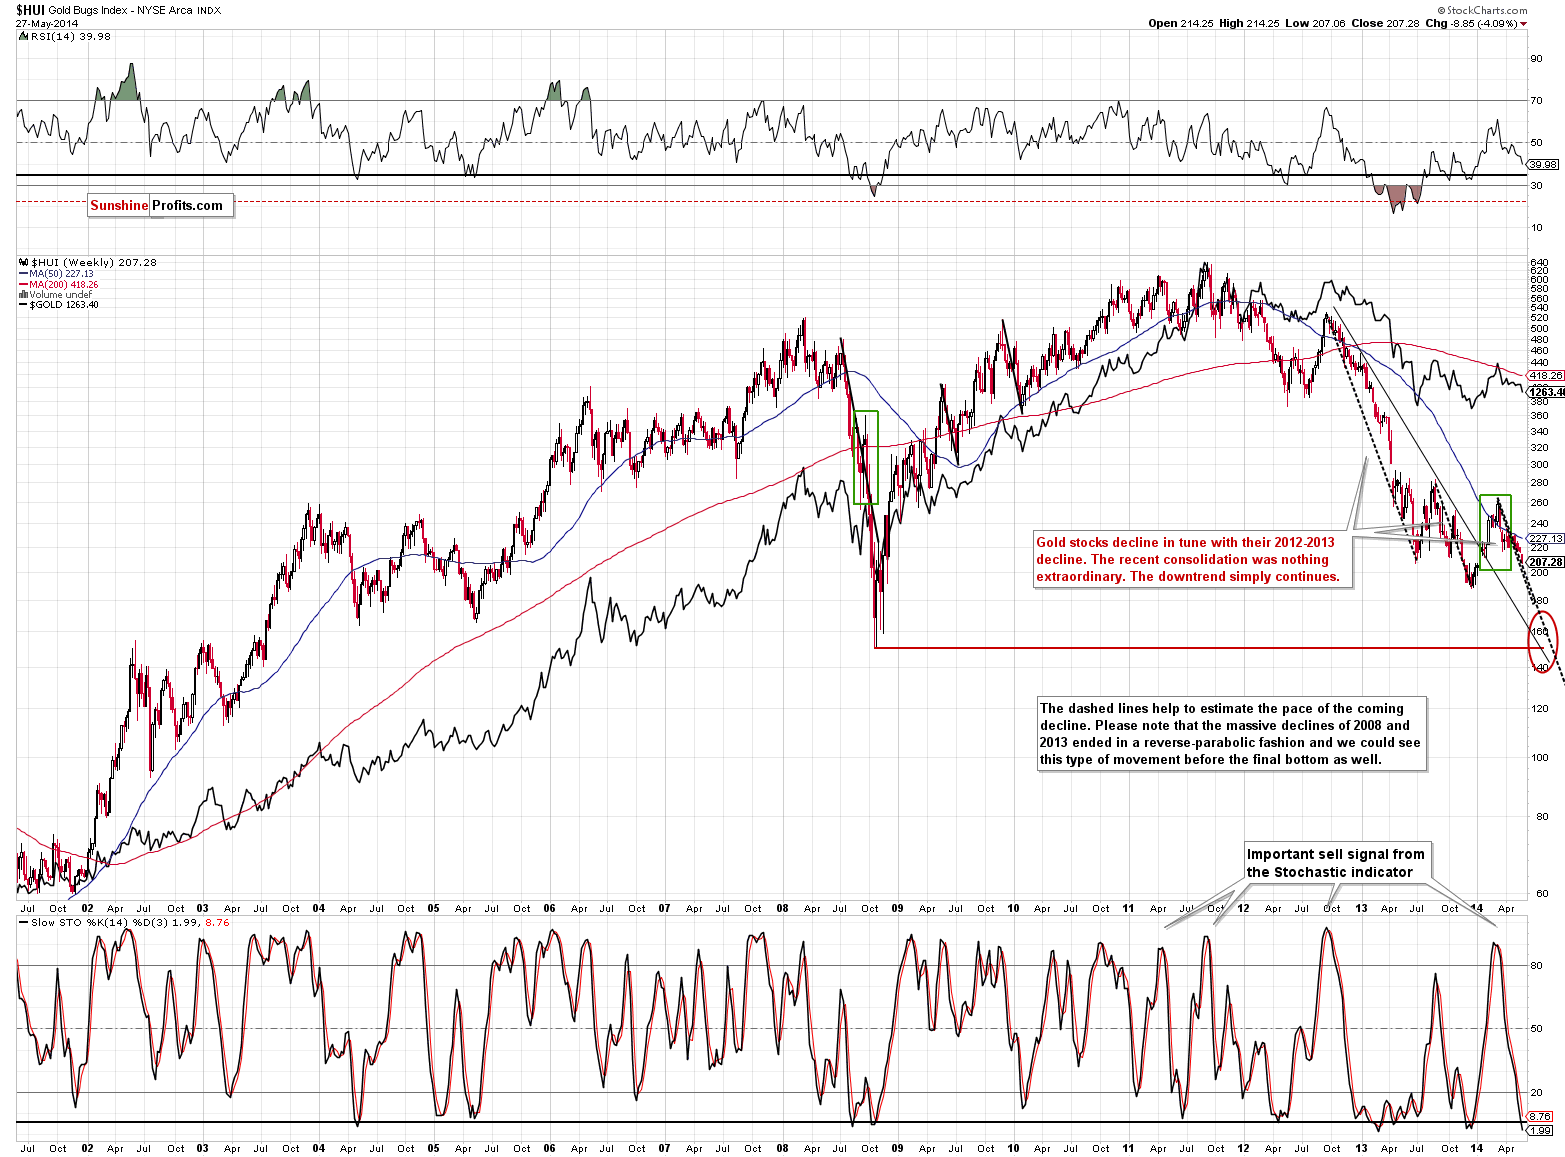
Not really, because the decline in gold stocks was already in tune with the past decline (similarities in the pace of decline are illustrated with dashed lines above). The outlook was bearish and it still is. We can view yesterday’s move as some kind of confirmation that the above-mentioned analogy remains in place.
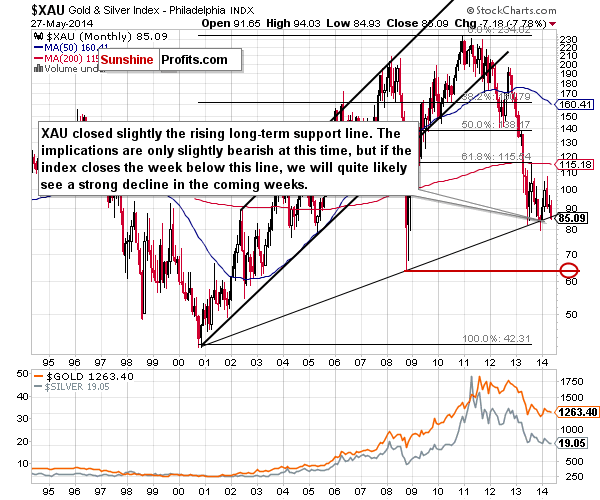
Focusing on the XAU Index, we see that the decline changed a bit more and that it’s about to change even more. Yesterday’s decline took the index below the rising long-term support line and while it’s not that significant by itself, it’s a first step to see a weekly close below this line. If we see it, the next huge drop will become much more probable.
The XAU chart is one of the clearest ones in the sector when it comes to estimating the target area. The reason is that once the XAU breaks below the rising support line and the 2013 lows – they are very close to where the index is right now – there will be no additional strong support all the way down to the 2008 low.
We have been writing about XAU moving back to its 2008 lows for months now, and it seems that the move will take place quite soon.
The best part of yesterday’s decline (and by “best” we mean that it’s something that made the situation much clearer) was the metals’ and miners’ late reaction to the USD Index’s strength.
It was right before the decline in metals that we wrote the following:
The U.S. dollar moved higher once again and almost confirmed the breakout above the declining resistance line. Precious metals are not reacting yet. Unless metals start to react to the dollar’s strength (by declining) we will view this as a sign of their strength. For now we still think that the reaction is delayed – not really absent.
One of the reasons for the lack of reaction could be the situation in the silver market.
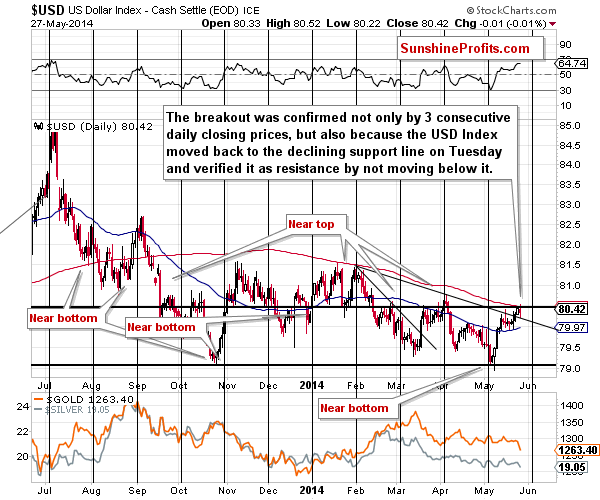
The patience seems to have been worth it. The USD Index confirmed the breakout in a classic, beautiful way. There were 3 consecutive closing prices above the support line, including a weekly decline and there was a small pullback to this line, after which the USD rallied once again.
We were assuming that most traders (of course, some of them were betting on the increase in the value of the USD) were not viewing the move in the dollar as convincing enough to bet on it and to drop precious metals based on it, but as the breakout was confirmed and higher values of the USD Index became more probable, the precious metals market reacted strongly, even though the USD Index closed more or less where it had closed on the previous day.
In other words, we were expecting precious metals to catch up with the USD Index, and they just started to do so.
Please note that based on the proximity of the cyclical turning point, we could see another pullback to the support/resistance line that was just broken in a few days, but it doesn’t seem to be really concerning – it’s not likely to be anything more than just that – a pullback. Once it’s over (or we’re sure that it hasn’t happened) we will likely adjust the stop-loss orders for our positions in the precious metals sector.
Summing up, the situation in the precious metals market deteriorated – not only in terms of what has already happened (daily decline), but also in terms of the outlook. Consequently, we think that we can now increase the size of the profitable short position in the precious metals sector.
To summarize:
Trading capital (our opinion): Short positions (full) in: gold, silver, and mining stocks with the following stop-loss orders:
- Gold: $1,326
- Silver: $20.30
- GDX ETF: $25.20
Long-term capital: No positions.
Insurance capital: Full position.
Please note that a full speculative position doesn’t mean using all of the speculative capital for this trade. You will find details on our thoughts on gold portfolio structuring in the Key Insights section on our website.
As always, we'll keep you - our subscribers - updated should our views on the market change. We will continue to send out Gold & Silver Trading Alerts on each trading day and we will send additional Alerts whenever appropriate.
The trading position presented above is the netted version of positions based on subjective signals (opinion) from your Editor, and the automated tools (SP Indicators and the upcoming self-similarity-based tool).
As a reminder, Gold & Silver Trading Alerts are posted before or on each trading day (we usually post them before the opening bell, but we don't promise doing that each day). If there's anything urgent, we will send you an additional small alert before posting the main one.
Thank you.
Sincerely,
Przemyslaw Radomski, CFA
Founder, Editor-in-chief
Gold & Silver Trading Alerts
Forex Trading Alerts
Oil Investment Updates
Oil Trading Alerts

