

Just a quick update as things are moving quite fast in the PMs.
You might be concerned about today’s move higher in gold, silver, and mining stocks, but please keep in mind that even today’s upswing is not out of ordinary and it’s within what I described as quite possible on Monday – in this week’s flagship Gold & Silver Trading Alert.
Today’s intraday high in gold is still slightly below $1,800 and the HUI Index moved to 299.09. Let’s quote what I wrote with about the HUI Index, below its long-term chart:
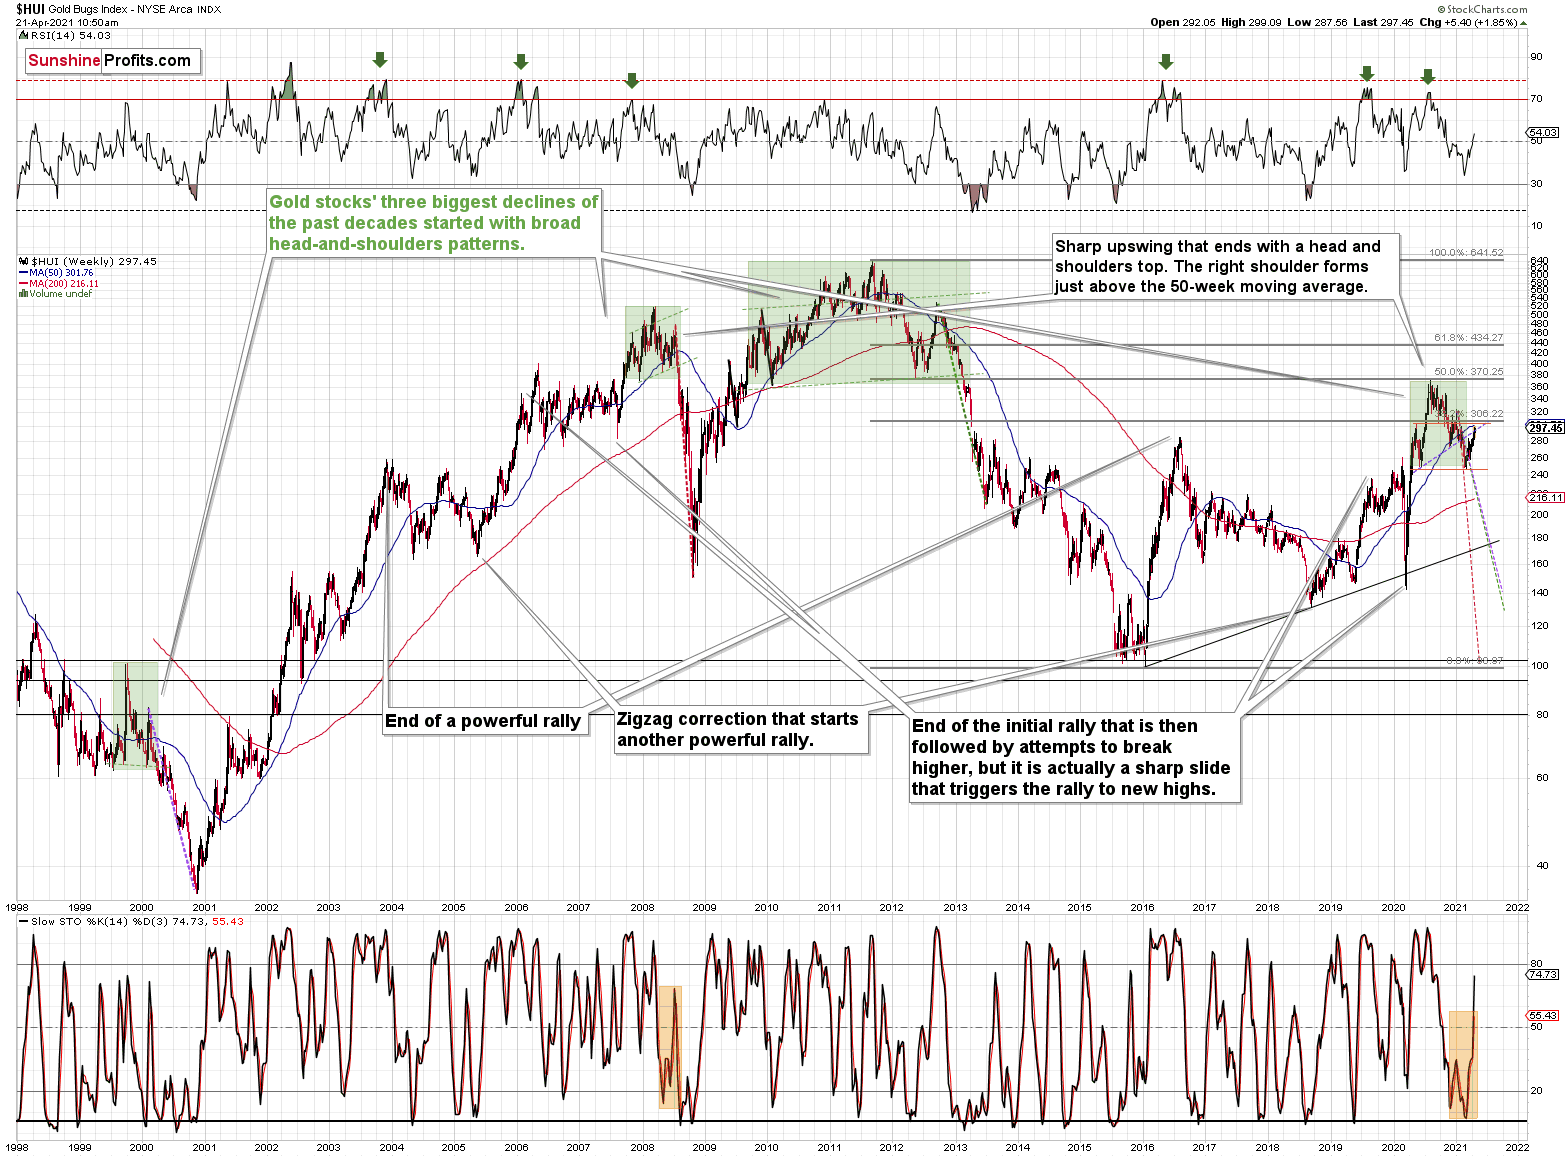
Please note that the 2007 – 2008 and the 2009 – 2012 head and shoulders pattern didn’t have the right shoulders all the way up to the line that was parallel to the line connecting the bottoms. I marked those lines with green in the above-mentioned formations. In the current case, I marked those lines with orange.
Now, even though the above wasn’t the case, in both cases, the final top – the right shoulder formed close to the price where the left shoulder topped. The left shoulder that formed in early 2020 topped at 303.02.
Consequently, it wouldn’t be surprising to see a move to about 300 in the HUI Index, despite all the bearish indications that I outlined so far today.
Yes, I realize that this is not a pleasant piece of news, as we would all prefer to have the market move in our preferred direction right away, but this time it seems that the wait will be – in my opinion – extremely worth it.
The HUI Index at 299 perfectly fits the above.
As far as the GDX ETF is concerned, I wrote the following (also earlier today):
Still, I would like to point out that it’s still possible that the head-and-shoulders formation that I marked previously was not THE formation that is going to take mining stocks to much lower prices. It could be the case that the left shoulder is as I described previously, but that the head of the pattern is bigger and the right shoulder is being formed right now. If this is the case, then we might still see the GDX ETF at about $37 level or so before it really slides. This would be in tune with how the situation developed in 2008 and 2012 – you’ll find details of this comparison in the following part of the analysis, where I discuss the HUI Index’s very long-term chart. For now, let’s keep in mind that even a rally slightly above $37 in the GDX ETF would not invalidate the bearish outlook for mining stocks(even though it would feel very unpleasant in the short term).
Today’s intraday high in the GDX ETF is (at least so far) $36.83, which – in light of the above – means that nothing changed.
And, as far as gold is concerned, I wrote the following:
(while gold rallies a bit more – say to $1,800 or so), but don’t let that trick you into thinking that the next big move is going to the upside. In my view, that’s actually likely to be an important top that’s then going to be followed by an even more important decline in the precious metals and mining stocks. Then, after several weeks or months of declines, PMs can bottom and finally soar without huge declines on the horizon.
Once again, today’s intraday move to ~$1,798 is well within the realm of possibilities that don’t change the outlook – as described above. In other words, the outlook for the next several weeks remains or months remains bearish.
As always, we’ll keep you - our subscribers - informed.
Thank you.
Sincerely,
Przemyslaw Radomski, CFA
Founder, Editor-in-chief

