

Briefly: In our opinion, full (200% of the regular size of the position) speculative short positions in gold, silver and mining stocks is justified from the risk/reward perspective at the moment of publishing this alert.
The golden rollercoaster just moved past its highest point and is about to accelerate –make sure you’re buckled up for this exciting ride and enjoy it. The best thing about this ride is going to be its end, which will present the ultimate buying opportunity. Before that happens though, we’ll have multiple occasions to reap some short-term profits. Well, we’re already reaping them with our current position, but it looks like it’s just the start. Let the fun begin.
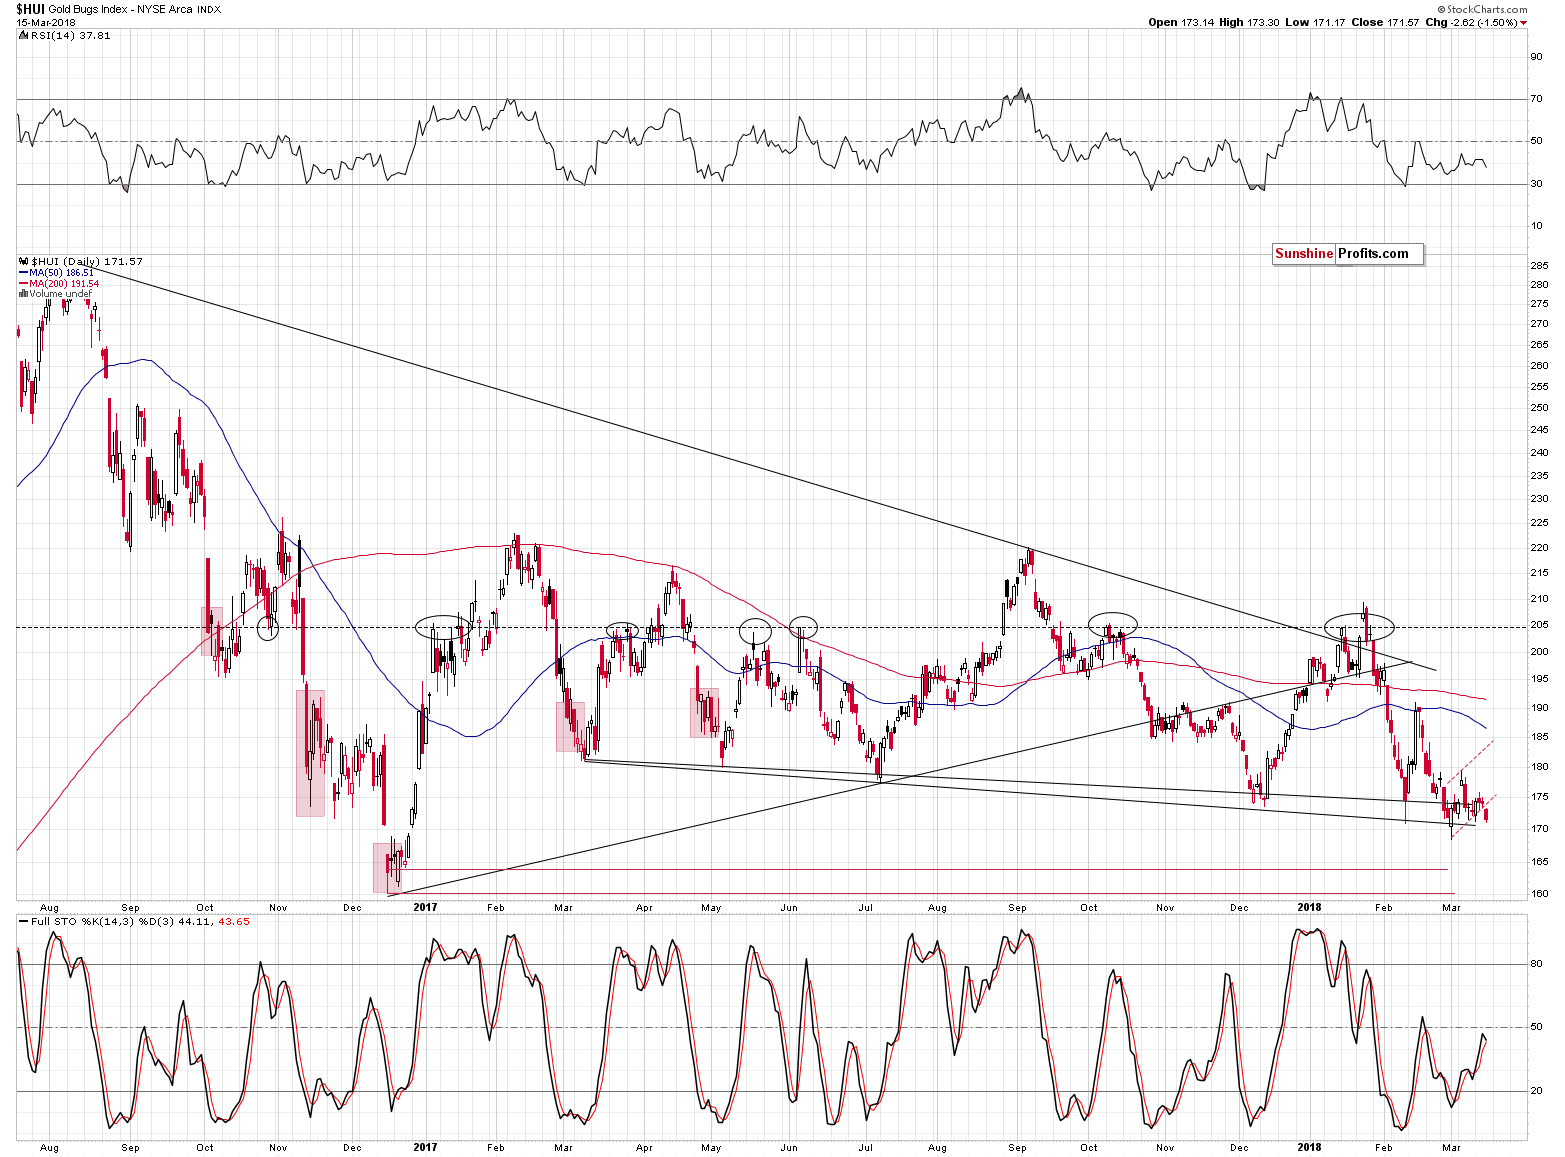
The last several days were no fun at all and yesterday’s session took it to the extreme. Literally – the extremely low volume was the only thing that we could have commented on in yesterday’s alert. There are serious signs suggesting that the wait for something to happen is over. Let’s start with the chart that features the most notable change – the HUI Index (chart courtesy of http://stockcharts.com).
On a side note, the implications of yesterday’s extremely low volume are very important and very bearish – if you haven’t read this analysis yet, it might be a good idea to do so today.
Gold Stocks Break to New 2018 Low
So, what happened?
It might have not looked particularly important from the day-to-day perspective, but gold stocks have just closed at a new 2018 low. In fact, it was the lowest daily close since late December 2016.
So much for the “gold miners are going to soar in the first quarter of the year as they always do” prediction that we all read at the end of the previous year and earlier this year.
In the previous alerts, we wrote that gold miners could move somewhat higher, but that they were likely to underperform during the upswing, so the move was likely to be rather insignificant. Indeed, the HUI Index only managed to move a bit above 175 and then decline once again. Moreover, during the upswing, it didn’t close back above the 2017 low (in terms of closing prices). This makes the current breakdown below the previous lows even more important.
Sure, it’s just a single session and the breakdown is not confirmed, but because of the points made above, it’s already bearish.
Another thing that’s bearish is the volume.
The volume increased during yesterday’s downswing, which is clearly bearish.
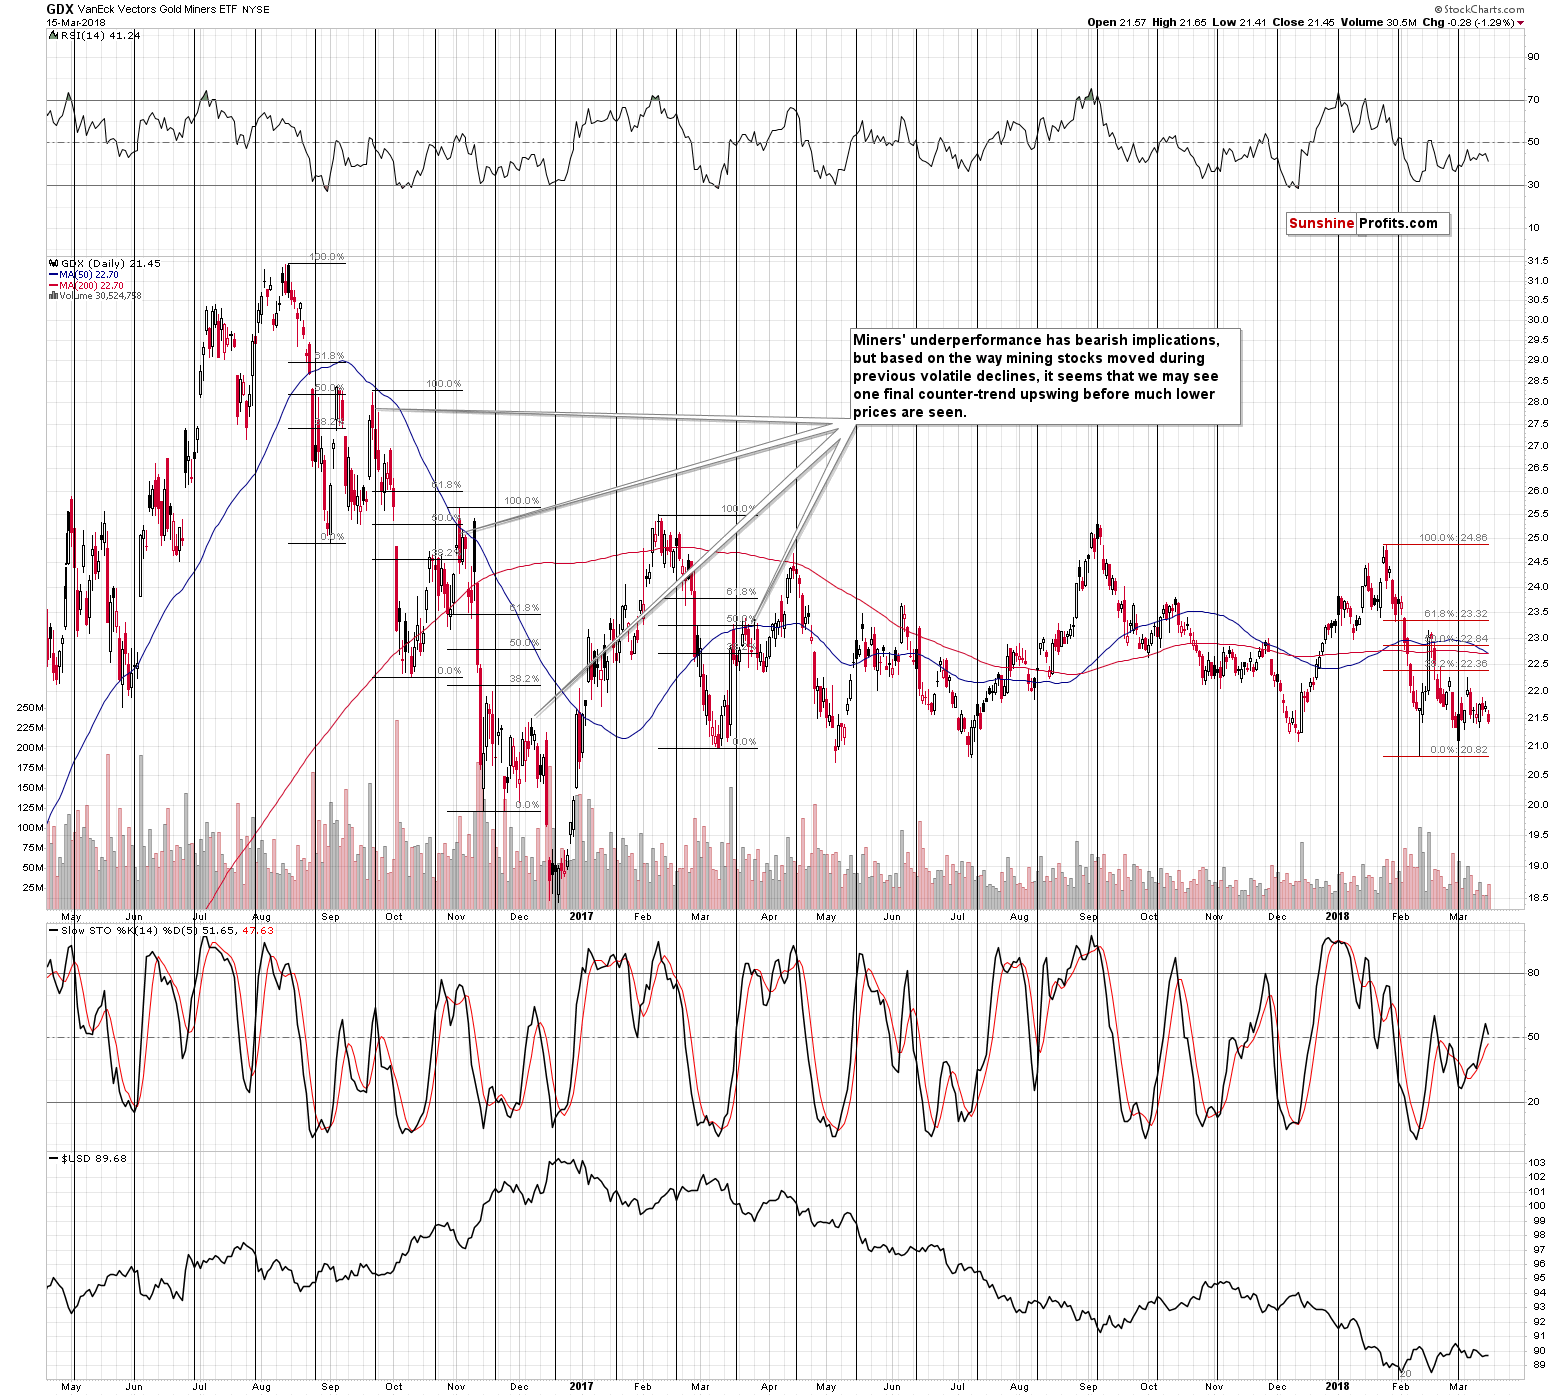
By the way, the GDX didn’t move to new lows just yet as the silver stocks are still holding on, but it doesn’t seem that they will hold for much longer given what’s very likely to happen with the price of silver in the next several days.
Incoming: Silver Slide
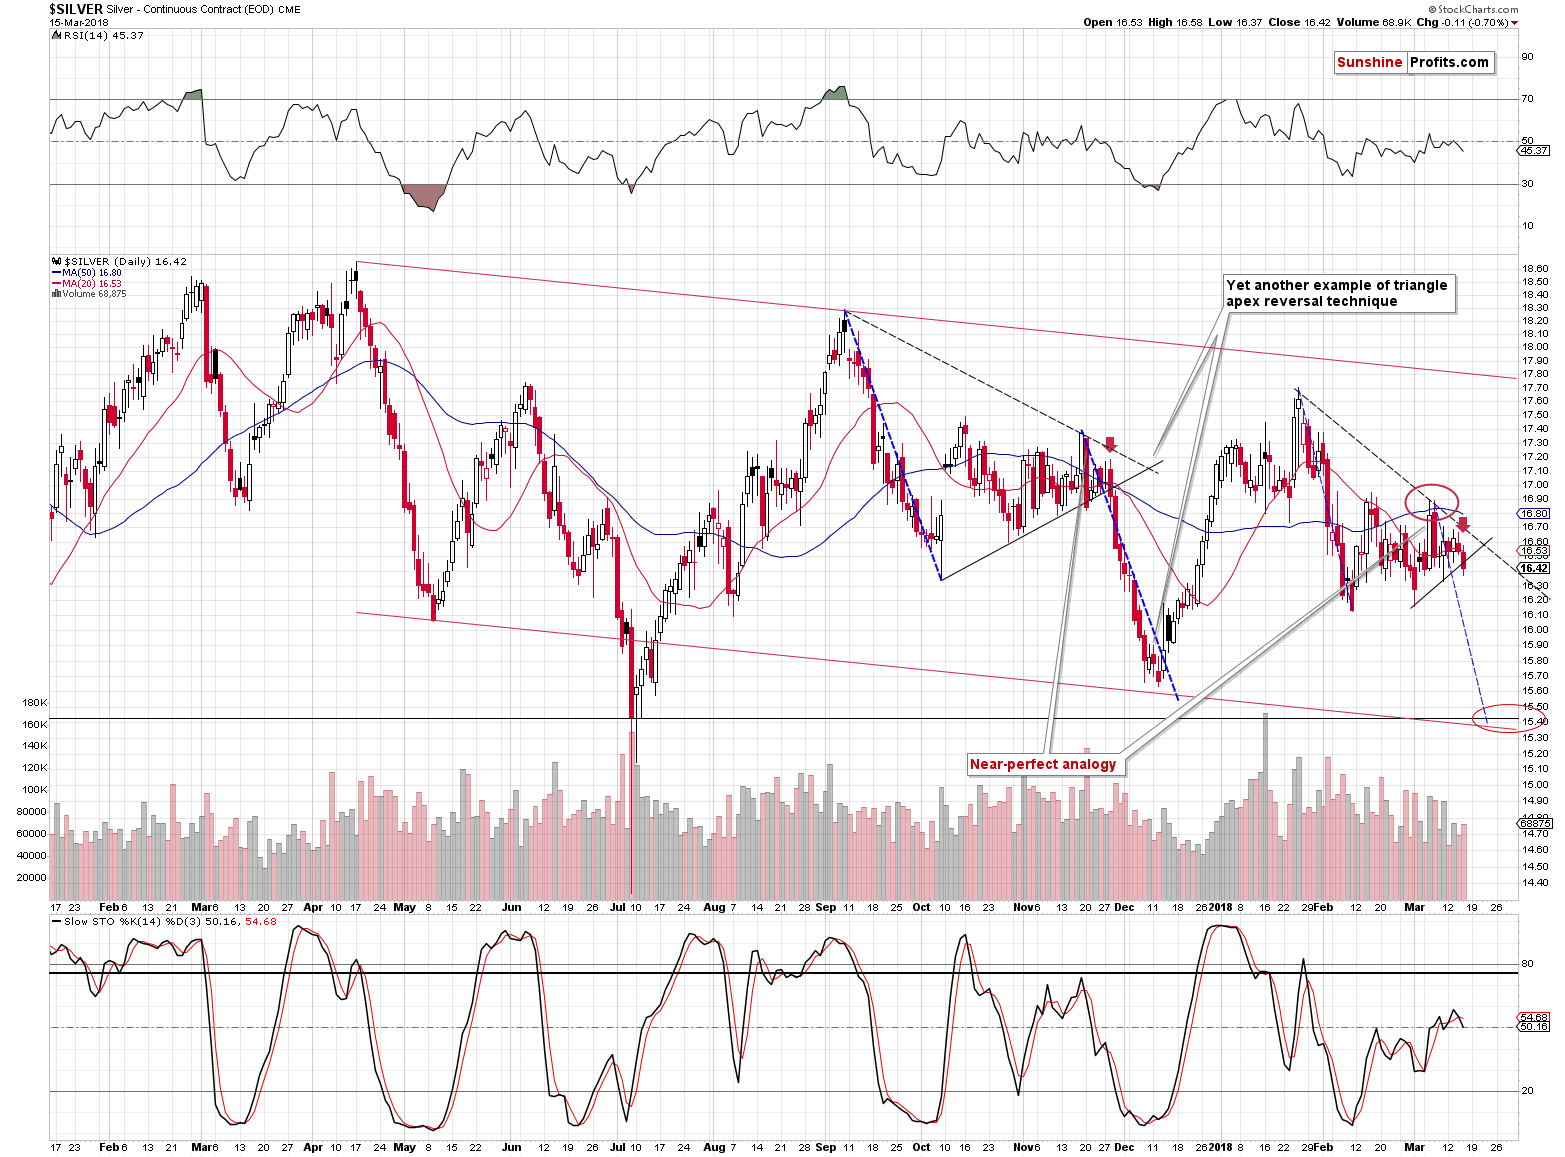
Silver’s self-similar pattern continues. We have a new sell signal from the Stochastic indicator, but given the accuracy of the pattern so far, the above statement is practically enough to make it very likely that a decline will be seen shortly.
We marked the current and the analogous sessions with red arrows. It’s not only the time relative to the previous developments, like the single-day price spike, which makes the analogy likely. It’s also the small breakdown below the rising short-term support line and a close below it that makes the two cases alike.
In the previous case, silver declined more than $1 after the similar session, so something alike is most likely about to take place.
So, how low is silver likely to move in the near term?
We marked the target area with the red ellipse. Silver is likely to move to $15.30 - $15.50, likely before the end of March. Perhaps even next week. Yes, that would be a quite volatile decline, but silver is likely to decline in a volatile manner based on the mentioned self-similar pattern.
The additional techniques that point to this target area are the analogy to the previous decline (thin blue dashed lines) combined with the analogy to the entire previous pattern (thick blue dashed lines). If the self-similar pattern is to continue, the we can expect the size of the decline to be similar to the size of the decline that started the pattern and that’s exactly what the blue lines represent.
The next technique that is also somewhat based on the self-similarity is the triangle apex reversal that we created in analogy to what we saw in 2017. The apex-based turning point is in tune with the blue line, so it confirms it.
Finally, the support area is additionally strengthened by the 2017 low in terms of the daily closes and the lower border of the declining trend channel (marked in red).
Gold’s Downside Targets
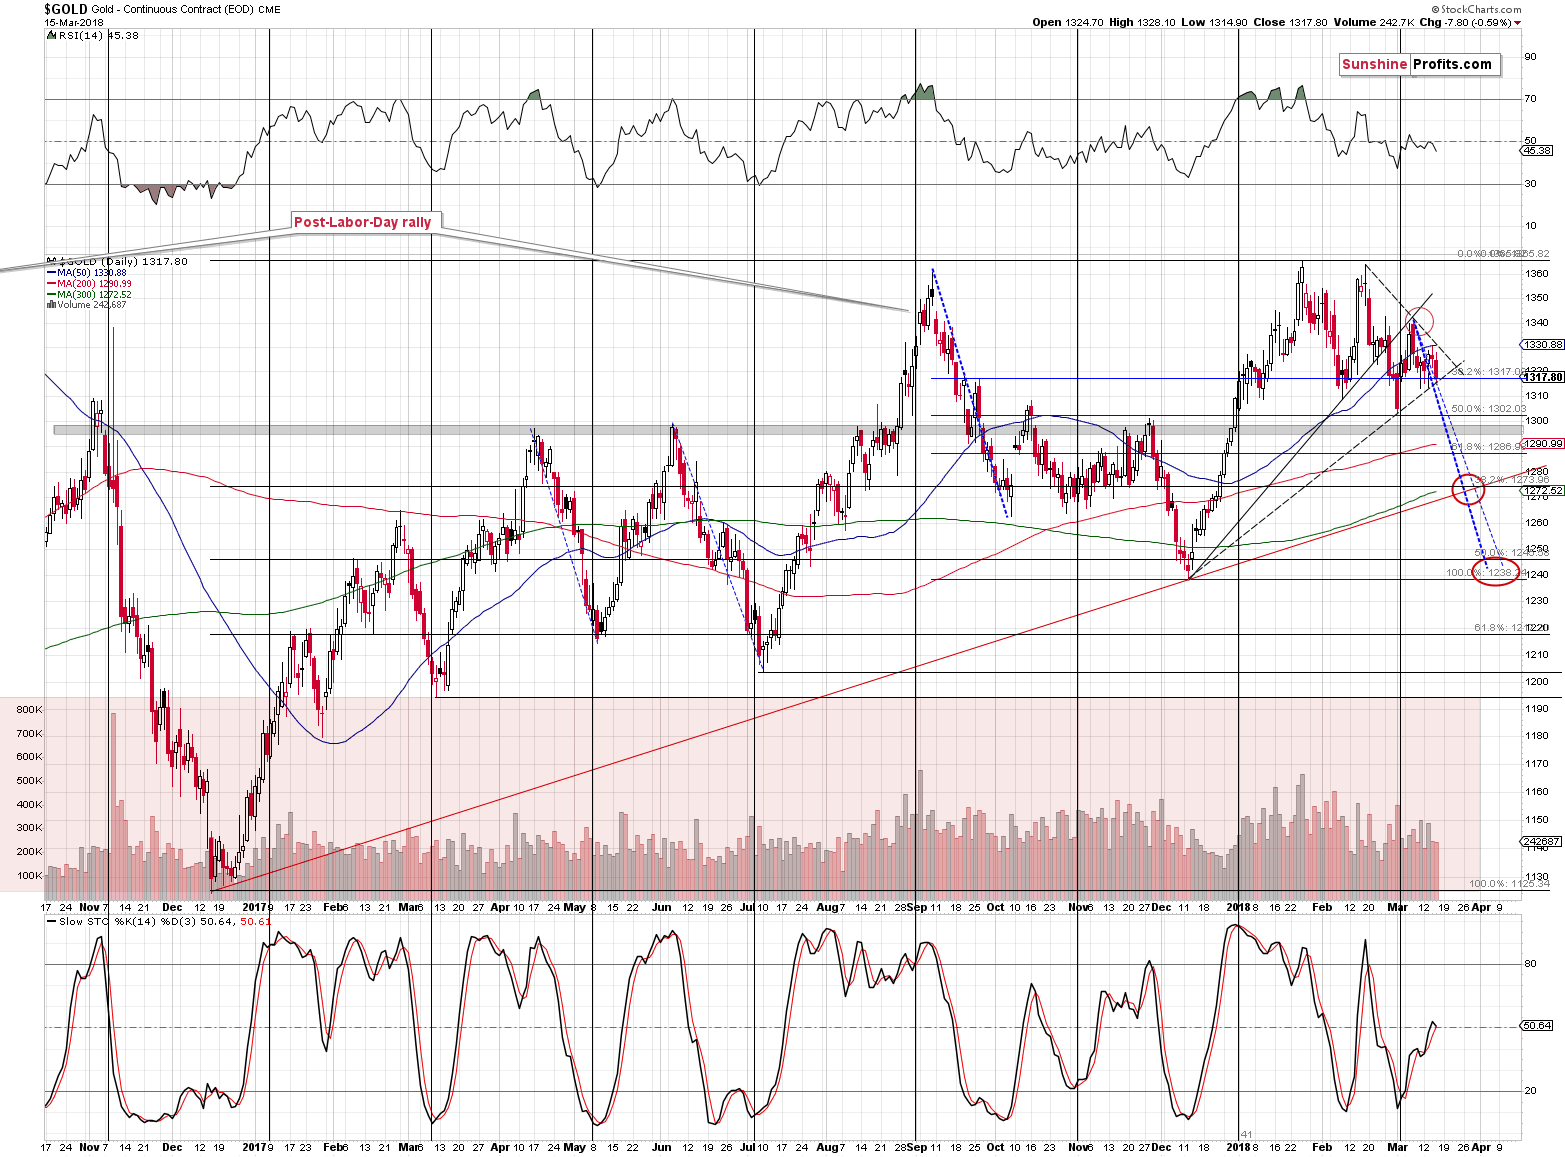
In gold, we also have a short-term triangle with the apex pointing to next week (Thursday or so), which could indicate the time for a short-term reversal. It’s very good that approximately the same date can be seen in the case of the golden and silver triangles as it means that they confirm each other, and the entire prediction becomes more likely to become reality.
In the case of gold, we don’t have a self-similar pattern, so we assume that the current short-term decline is going to be similar to the previous short-term declines. We marked the most recent decline with a thick blue dashed line and the less recent smaller declines with thin blue dashed lines.
Other tools that we applied are the short-term Fibonacci retracements and the rising medium-term support line that we marked in red. The short-term Fibonacci retracements seem too close to the current price levels to trigger even a short-term rally at this time. Don’t get us wrong – this technique is very useful, but the key thing is that the retracements seem to have already worked and triggered a 1.5 month pause. After such a long pause, during which gold gathered strength for the next move, it seems unlikely that it would decline by only $30 or so. At the moment of writing these words, gold is trading at $1,317 (and the 61.8% Fibonacci is at about $1,287), so it seems that we should be looking for techniques that provide lower support targets.
The rising red support line certainly does. This line crosses the mentioned blue lines close to the $1,270 level and if we combine it with the apex of the triangle pattern, we get the picture in which gold is likely to bottom next week slightly above $1,270.
This creates the most likely short-term target area. However, there is also another target area that we marked that is not based on the mentioned apex of the triangle or the rising support line, but on the December 2017 low. It’s also supported by the size of two of the previous declines. Based on the above, gold is likely to form a local bottom in the $1,235 - $1,250 area.
Both target areas are additionally supported by medium-term Fibonacci retracement levels based on the entire December 2016 – January 2018 rally. The 38.2% retracement is at about $1,274 and the 50% retracement is at about $1,246. This makes the mentioned target areas even more reliable.
Summing up, the previous days and weeks provided us with multiple signals pointing to much lower prices of gold, silver and mining stocks in the following months and it seems that the big decline is starting to build momentum. The self-similarity in silver and the breakdown to new 2018 lows in gold stocks both suggest that the waiting for the decline’s start is almost or completely over. Based on the way gold and silver declined in the past, it seems that the next 4-6 trading days will be quite volatile and that we’ll see new 2018 lows shortly.
If the target areas described in today’s alert are indeed reached next week, we may adjust, close or even reverse the current short position, but it will all depend on the confirmations that we get at that time.
As always, we will keep you – our subscribers – informed.
To summarize:
Trading capital (supplementary part of the portfolio; our opinion): Full short positions (200% of the full position) in gold, silver and mining stocks are justified from the risk/reward perspective with the following stop-loss orders and initial target price levels:
- Gold: initial target price: $1,218; stop-loss: $1,382; initial target price for the DGLD ETN: $53.98; stop-loss for the DGLD ETN $37.68
- Silver: initial target price: $14.63; stop-loss: $17.33; initial target price for the DSLV ETN: $33.88; stop-loss for the DSLV ETN $21.48
- Mining stocks (price levels for the GDX ETF): initial target price: $19.22; stop-loss: $23.54; initial target price for the DUST ETF: $39.88; stop-loss for the DUST ETF $21.46
In case one wants to bet on junior mining stocks' prices (we do not suggest doing so – we think senior mining stocks are more predictable in the case of short-term trades – if one wants to do it anyway, we provide the details), here are the stop-loss details and initial target prices:
- GDXJ ETF: initial target price: $27.82; stop-loss: $36.14
- JDST ETF: initial target price: $94.88 stop-loss: $41.86
Long-term capital (core part of the portfolio; our opinion): No positions (in other words: cash)
Insurance capital (core part of the portfolio; our opinion): Full position
Important Details for New Subscribers
Whether you already subscribed or not, we encourage you to find out how to make the most of our alerts and read our replies to the most common alert-and-gold-trading-related-questions.
Please note that the in the trading section we describe the situation for the day that the alert is posted. In other words, it we are writing about a speculative position, it means that it is up-to-date on the day it was posted. We are also featuring the initial target prices, so that you can decide whether keeping a position on a given day is something that is in tune with your approach (some moves are too small for medium-term traders and some might appear too big for day-traders).
Plus, you might want to read why our stop-loss orders are usually relatively far from the current price.
Please note that a full position doesn’t mean using all of the capital for a given trade. You will find details on our thoughts on gold portfolio structuring in the Key Insights section on our website.
As a reminder – “initial target price” means exactly that – an “initial” one, it’s not a price level at which we suggest closing positions. If this becomes the case (like it did in the previous trade) we will refer to these levels as levels of exit orders (exactly as we’ve done previously). Stop-loss levels, however, are naturally not “initial”, but something that, in our opinion, might be entered as an order.
Since it is impossible to synchronize target prices and stop-loss levels for all the ETFs and ETNs with the main markets that we provide these levels for (gold, silver and mining stocks – the GDX ETF), the stop-loss levels and target prices for other ETNs and ETF (among other: UGLD, DGLD, USLV, DSLV, NUGT, DUST, JNUG, JDST) are provided as supplementary, and not as “final”. This means that if a stop-loss or a target level is reached for any of the “additional instruments” (DGLD for instance), but not for the “main instrument” (gold in this case), we will view positions in both gold and DGLD as still open and the stop-loss for DGLD would have to be moved lower. On the other hand, if gold moves to a stop-loss level but DGLD doesn’t, then we will view both positions (in gold and DGLD) as closed. In other words, since it’s not possible to be 100% certain that each related instrument moves to a given level when the underlying instrument does, we can’t provide levels that would be binding. The levels that we do provide are our best estimate of the levels that will correspond to the levels in the underlying assets, but it will be the underlying assets that one will need to focus on regarding the signs pointing to closing a given position or keeping it open. We might adjust the levels in the “additional instruments” without adjusting the levels in the “main instruments”, which will simply mean that we have improved our estimation of these levels, not that we changed our outlook on the markets. We are already working on a tool that would update these levels on a daily basis for the most popular ETFs, ETNs and individual mining stocks.
Our preferred ways to invest in and to trade gold along with the reasoning can be found in the how to buy gold section. Additionally, our preferred ETFs and ETNs can be found in our Gold & Silver ETF Ranking.
As a reminder, Gold & Silver Trading Alerts are posted before or on each trading day (we usually post them before the opening bell, but we don't promise doing that each day). If there's anything urgent, we will send you an additional small alert before posting the main one.
=====
Latest Free Trading Alerts:
The fans of Game of Thrones know perfectly well that the winter is coming. But what if the House Stark is wrong and we are already in spring? We invite you to read our today’s article to find out whether the summer is approaching – and what it would bring for the gold market.
Is the Economic Summer Coming?
=====
Hand-picked precious-metals-related links:
PRECIOUS-Gold firms on political concerns, softer dollar
Venezuela gold reserve value falls 14 pct in 2017
=====
In other news:
Dollar Slips Amid Political Noise; Stocks Mixed: Markets Wrap
Millions of Indebted in U.K. Face Pain as Rock-Bottom Rates Rise
Euro-Area Inflation Unexpectedly Revised Lower for February
Britain, EU may reach 'provisional' Brexit transition deal next week: source
Japan PM Abe's support falls to 39 percent amid cronyism scandal
Bitcoin's ‘Death Cross’ Looms as Strategist Eyes $2,800 Level
New Stablecoins Backed by Gold and Silver Emerge
=====
Thank you.
Sincerely,
Przemyslaw Radomski, CFA
Founder, Editor-in-chief, Gold & Silver Fund Manager
Gold & Silver Trading Alerts
Forex Trading Alerts
Oil Investment Updates
Oil Trading Alerts

