

Briefly: in our opinion, full (300% of the regular position size) speculative short positions in mining stocks are justified from the risk/reward point of view at the moment of publishing this Alert.
Yesterday’s price action can be summarized by simply saying that “a lot happened, but little changed”. After the daily supply-chain chaos in Europe due to fear over a mutant strain of COVID-19 that resulted in a stricter lockdown in London and surrounding areas, the markets seem to be back to normal.
I often emphasized that the geopolitical events that don’t change the long-term fundamentals tend to have a temporary effect, but the intraday character of this reversal was particularly fast.
Let’s use the general stock market as a proxy for how quick the changes were.
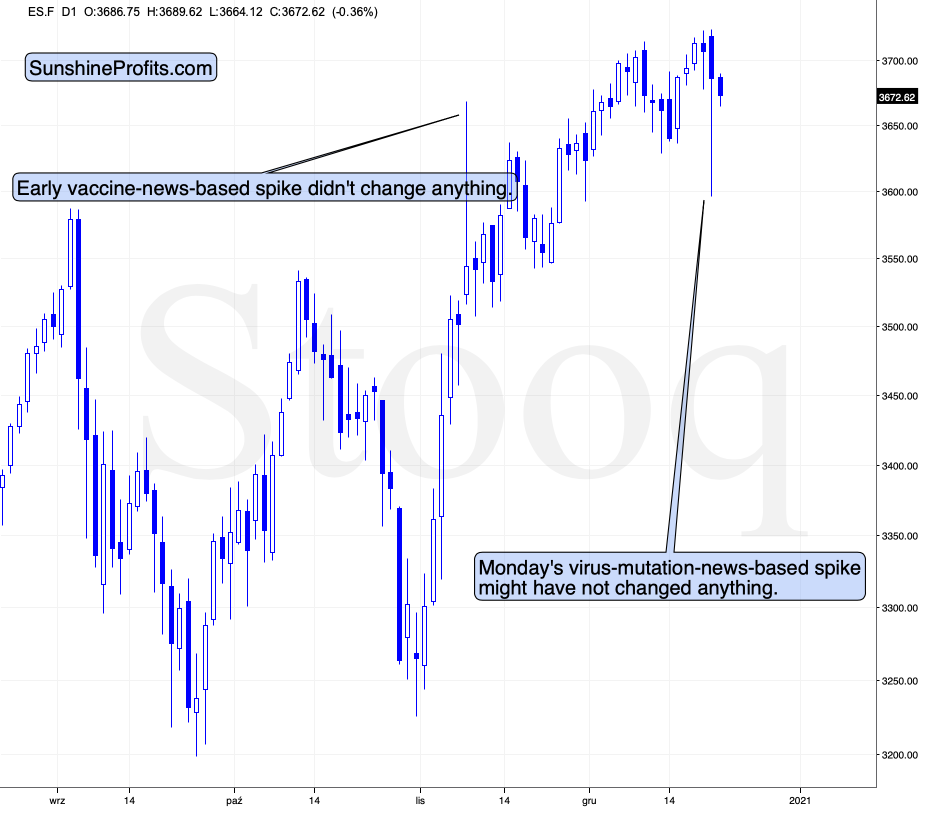
Did this change the outlook or trends? No. Practically all previously-discussed indications remain intact. Just as the November vaccine news-based spike didn’t change the previous uptrend; yesterday’s session might not have changed anything either.
Still, there is a chance that this actually was THE reversal day. After all, the hanging man candlestick which we saw yesterday, is a reversal candlestick. And if we saw a reversal in stocks, then perhaps we saw a reversal in other markets as well.
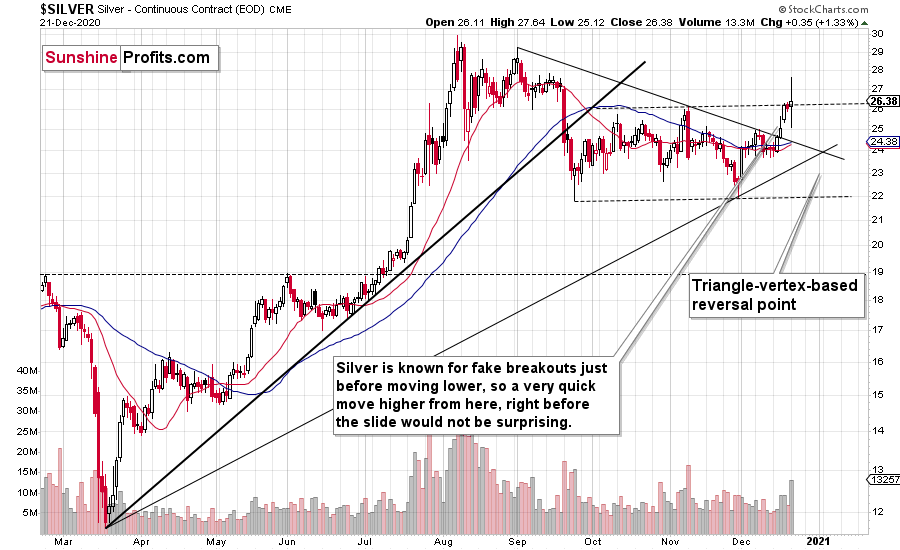
Silver’s massive intraday rally is definitely something that we might see at the exact top, especially if it’s confirmed by big volume. And that’s what we saw yesterday. It was also the case at the November high and the early-September high. In those cases, the intraday volatility was not as big, but the implications were exactly the same – it was the top.
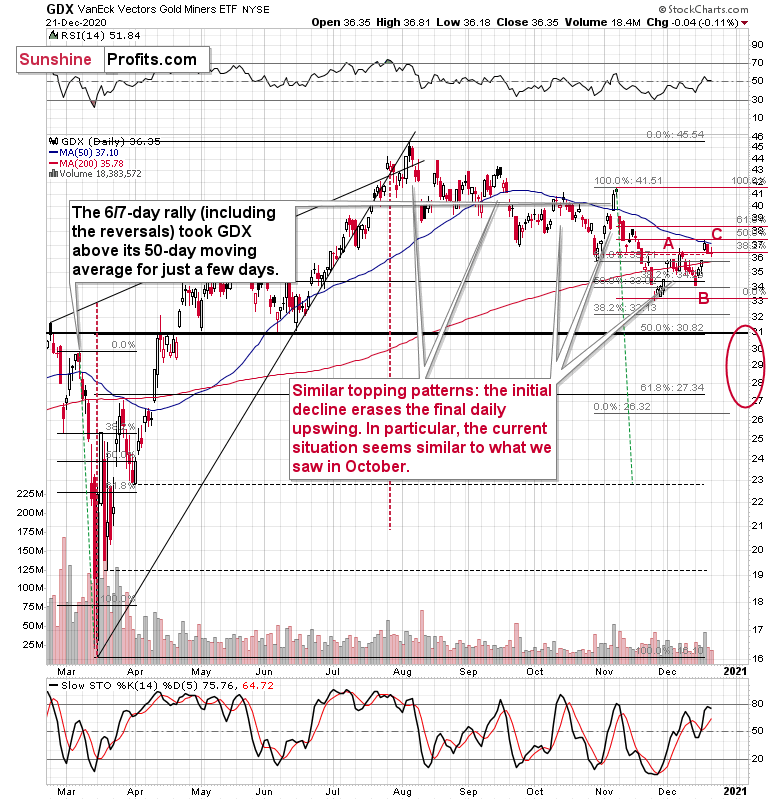
Mining stocks didn’t rally to new highs; they were basically flat yesterday. When silver moved sharply higher, miners were not yet trading, so the above two charts are not directly comparable.
However, the GDX was trading in London, when silver was much higher, so let’s see what happened to the miners then.
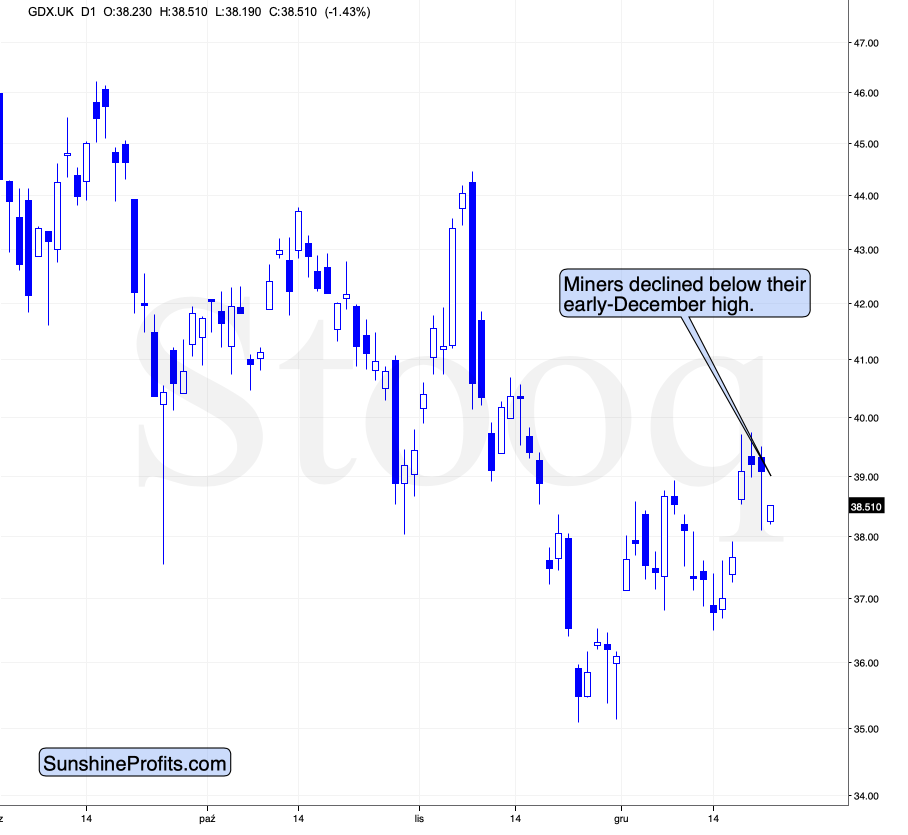
Yesterday, miners didn’t magnify the intraday move higher, but they did react to the intraday move lower. This is exactly the performance that we’ve been seeing previously and what I had been writing about for many days. Miners are relatively weak, which is a clearly bearish sign. Moreover, taking today’s session into account, the GDX is already back below the early-December high. The invalidation of the breakout is bearish.
Please note that the above chart is based on GDX’s performance on the UK / London Stock Exchange, not based on our regular US / NYSE perspective, which is why the prices on both above charts are not the same.
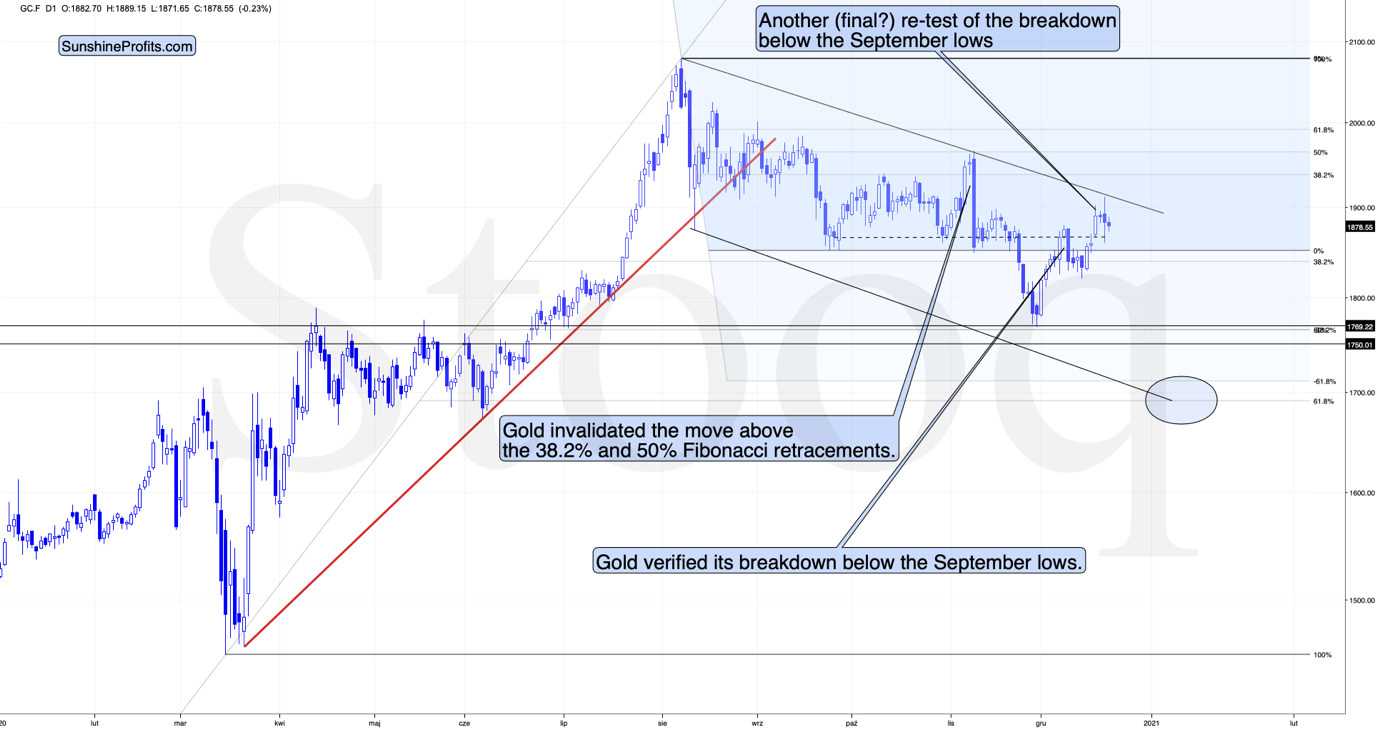
Gold remains in a downtrend and yesterday it moved to the very upper border of the declining trend channel. It seems that the next move lower can start any day now. In fact, it might have started yesterday.
This is especially the case if the USD Index is about to move higher, and this does seem to be the case, as it moved back above my previous Fibonacci-extension based target.
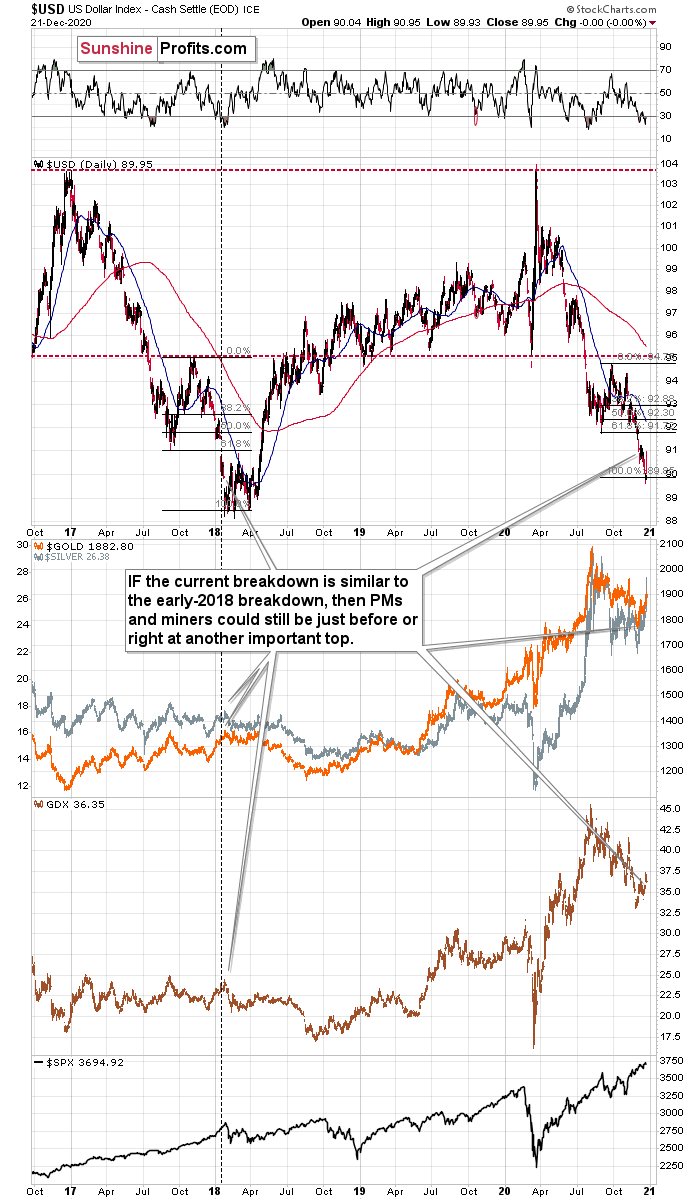
When the same thing happened in 2018, it meant that the decline was practically over for the USDX, and that the top is in for the precious metals sector.
So, it appears that after bouncing off my initial downside target (89.8 – 90) on Thursday (Dec. 17), the USDX seems poised for a resurgence.
But what are the direct catalysts?
Well, as I already mentioned, the positioning is beyond bearish. And if sentiment reverses, we could see a wave of short-covering (investors have to buy the U.S. dollar to cover their shorts). Last week, USD sentiment hit one of its lowest points in the last 30 years (roughly 11,000 trading days), with negativity only exceeding today’s levels 2.5% of the time.
Please have a look at the chart:
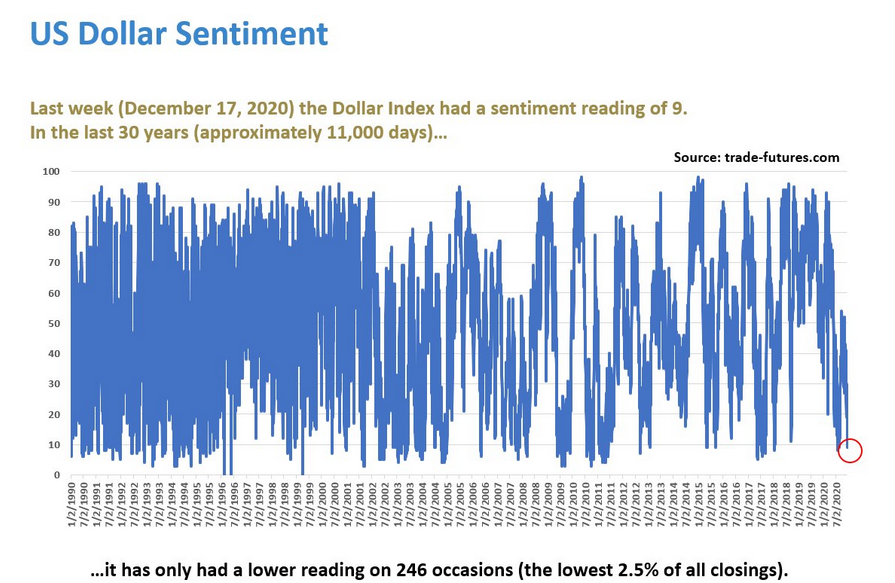
When bearish positioning becomes this crowded, it often ends with a sharp reversal. Focus on the data: Notice how extremes (in either direction) don’t age well?
In addition, traders are ignoring the dichotomy between speculators (those that gamble on currency moves) and commercial traders (hedgers that buy/sell the currency on behalf of actual businesses).
Please look at the following chart:
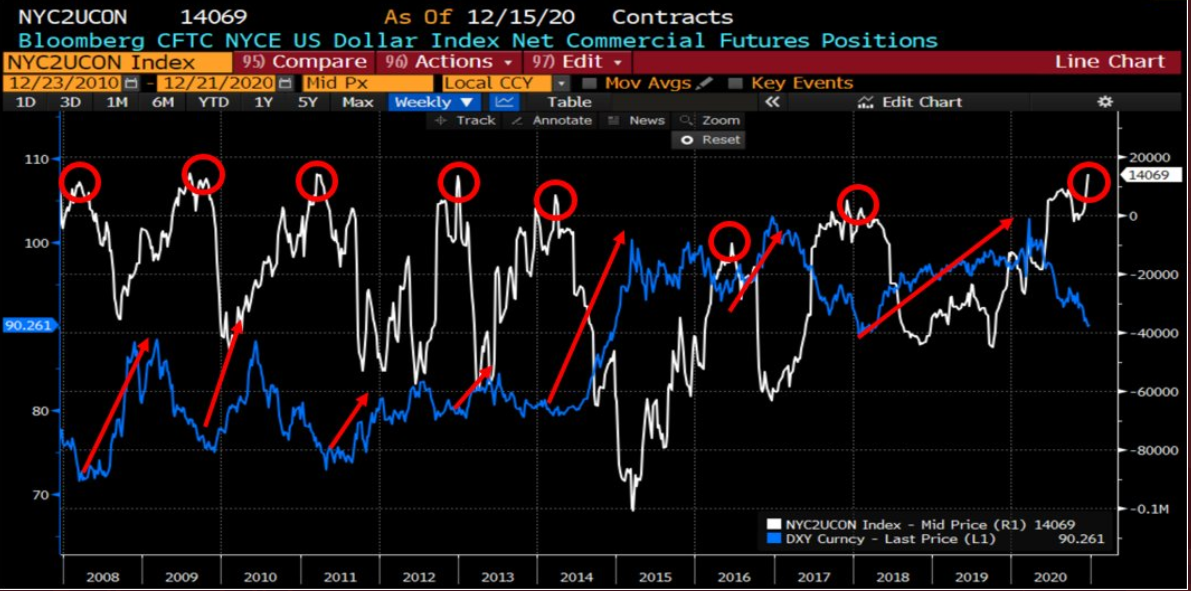
Source: Bloomberg/Santiago Capital
Please note that commercial traders are actually net-buyers of USD futures. More importantly, the last seven times commercial positioning was this high, it preceded a U.S. dollar rally.
So where is all the negativity coming from?
Well, the narrative from financial pundits includes: 1) QE (money printing). 2) Debt/GDP (fiscal overspending). 3) A climactic debasement of the U.S. dollar.
However, the story is more of a fairy tale.
With liquidity spigots on full blast around the world, the U.S. isn’t the only region expanding its money supply (And remember, currencies trade on a relative basis.) In fact, the European Central Bank (ECB) has more assets on its balance sheet than the U.S. Federal Reserve (FED). All other things being equal (in Economese: ceteris paribus), if things are bad in the U.S. but are worse in other parts of the world, in particular in the Eurozone and in Japan, then the USD Index would likely rally because the USD would seem like a better currency in comparison to the euro and the yen.
Please take a look below:
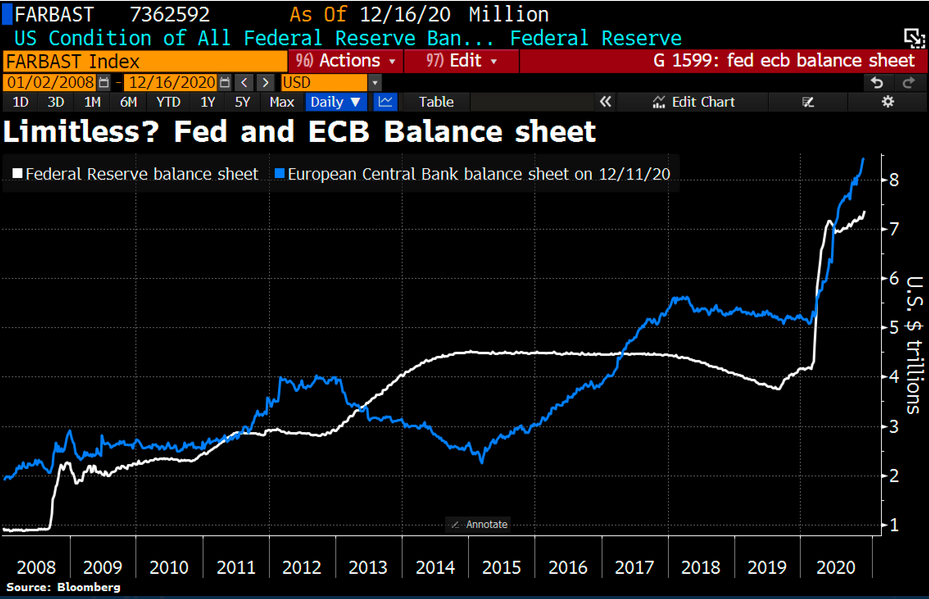
As of Wednesday (Dec. 16), the ECB has purchased more than $8 trillion in financial assets, while the FED lags behind, at more than $7 trillion. So, while the financial media claims the dollar is being printed into oblivion – on a relative basis, Europe actually takes the cake.
Another important factor is that investors have forgotten their history lessons. Past precedent shows that QE doesn’t debase the U.S. dollar in the really long run. In fact, the greenback actually appreciated (from its early 2008 value) during the first three bouts of money printing (QE1 – QE3).
We are over 10 years after the first QE was announced, after three rounds plus some extra operations, and right now we are in an open-ended QE with the Fed determined to keep providing liquidity as needed. And where is the USD Index? Above its 2008 high.
So …Is this time really different?
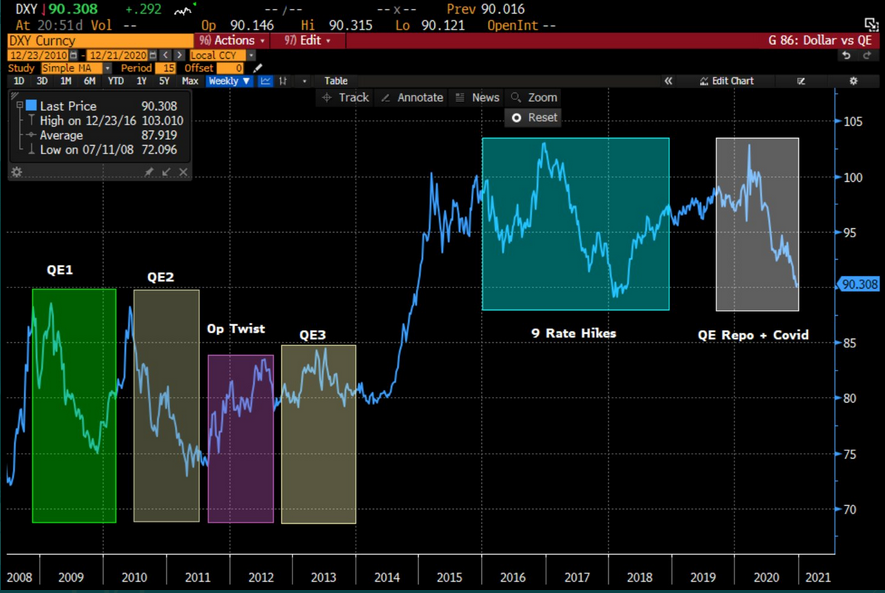
Source: Bloomberg/Santiago Capital
Options update
After GDX call options traded significantly lower on Friday (Dec. 31 expiry), they continued their nosedive on Monday (remember, call options profit when the GDX rises in price).
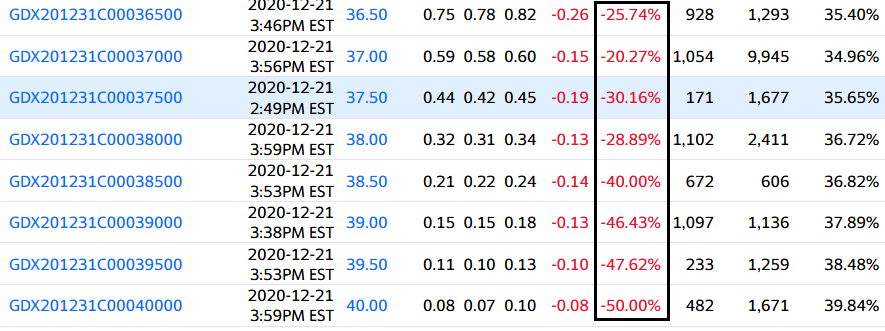
Source: Yahoo! Finance
And while GDX put options also traded lower on Monday, the lack of upside bets signals that bulls aren’t buying last week’s rally.
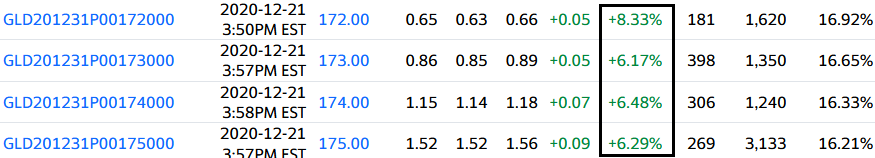
Similar activity also occurred with the SPDR Gold Trust ETF (GLD).
And while GLD is slightly different than GDX – because GLD holds physical bullion and gold certificates – its performance is still driven by the price of gold.
On Monday, GLD calls traded sharply lower (Dec. 31 expiry):
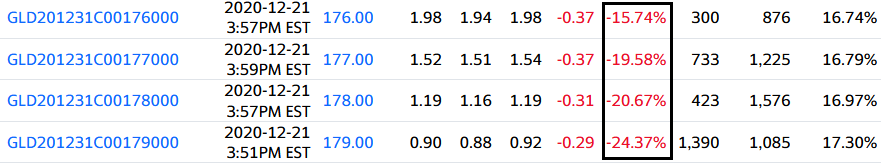
Source: Yahoo! Finance
In contrast, GLD puts (which profit when the ETF declines in price), traded higher (Dec. 31 expiry):
Source: Yahoo! Finance
The key takeaway? The options data supports what I highlighted above: Last week’s rally was built on a foundation of sand. And after yesterday’s pullback, that foundation is starting to crumble. The final stop? ~$1,700 or lower.
Overview of the Upcoming Decline
- As far as the current overview of the upcoming decline is concerned, I think it has already begun.
- During the final part of the slide (which could end within the next 1-5 weeks or so), I expect silver to decline more than miners. That would align with how the markets initially reacted to the Covid-19 threat.
- The impact of all the new rounds of money printing in the U.S. and Europe on the precious metals prices is incredibly positive in the long run, which does not make the short-term decline improbable. Markets can and will get ahead of themselves and decline afterward – sometimes very profoundly – before continuing with their upward climb.
- The plan is to exit the current short positions in miners after they decline far and fast, but at the same time, silver drops just “significantly” (we expect this to happen in 0 – 3 weeks ). In other words, the decline in silver should be severe, but the decline in the miners should look “ridiculous”. That’s what we did in March when we bought practically right at the bottom . It is a soft, but simultaneously broad instruction, so additional confirmations are necessary.
- I expect this confirmation to come from gold, reaching about $1,700 - $1,750 . If – at the same time – gold moves to about $1,700 - $1,750 and miners are already after a ridiculously big drop (say, to $31 - $32 in the GDX ETF – or lower), we will probably exit the short positions in the miners and at the same time enter short positions in silver. However, it could also be the case that we’ll wait for a rebound before re-entering short position in silver – it’s too early to say at this time. It’s also possible that we’ll enter very quick long positions between those short positions.
- The precious metals market's final bottom is likely to take shape when gold shows significant strength relative to the USD Index . It could take the form of a gold’s rally or a bullish reversal, despite the ongoing USD Index rally.
Summary
While Christmas came early for the precious metals last week, the holiday cheer isn’t likely to last very long. Despite doing its best Santa Clause impersonation, silver’s gift-giving isn’t rubbing off on gold or the gold miners. And given its relative outperformance, it’s most likely only a matter of time before silver’s sleigh crashes.
The divergent price action signals that the next move lower in the precious metals market is already underway. It will likely take another 1-5 weeks to play out (or perhaps even longer), with gold falling to or below $1,700 and with a substantial decline in silver (downside target is unclear) and miners ($1,700 in gold is likely to correspond to about $31 in GDX).
Remember, last week’s upswing is a relatively normal bounce within a bigger decline. And this corrective upswing might have already ended.
Despite a recent decline, it seems that the USD Index is going to move higher in the following months and weeks, in turn causing gold to decline. At some point gold is likely to stop responding to dollar’s bearish indications, and based on the above analysis, it seems that we might expect this to take place in December.
Naturally, everyone's trading is their responsibility. But in our opinion, if there ever was a time to either enter a short position in the miners or increase its size if it was not already sizable, it's now. We made money on the March decline, and on the March rebound, with another massive slide already underway.
After the sell-off (that takes gold to about $1,700 or lower), we expect the precious metals to rally significantly. The final decline might take as little as 1-5 weeks, so it's important to stay alert to any changes.
Most importantly, please stay healthy and safe. We made a lot of money on the March decline and the subsequent rebound (its initial part) price moves (and we'll likely earn much more in the following weeks and months), but you have to be healthy to enjoy the results.
Finally, on an administrative note, due to the Holiday season, there will be no regular Alerts posted on Thursday (Dec. 24) and Friday (Dec. 25). If anything major happens, we’ll send out a quick message to you anyway.
As always, we'll keep you - our subscribers - informed.
To summarize:
Trading capital (supplementary part of the portfolio; our opinion): Full speculative short positions (300% of the full position) in mining stocks is justified from the risk to reward point of view with the following binding exit profit-take price levels:
Senior mining stocks (price levels for the GDX ETF): binding profit-take exit price: $32.02; stop-loss: none (the volatility is too big to justify a SL order in case of this particular trade); binding profit-take level for the DUST ETF: $28.73; stop-loss for the DUST ETF: none (the volatility is too big to justify a SL order in case of this particular trade)
Junior mining stocks (price levels for the GDXJ ETF): binding profit-take exit price: $42.72; stop-loss: none (the volatility is too big to justify a SL order in case of this particular trade); binding profit-take level for the JDST ETF: $21.22; stop-loss for the JDST ETF: none (the volatility is too big to justify a SL order in case of this particular trade)
For-your-information targets (our opinion; we continue to think that mining stocks are the preferred way of taking advantage of the upcoming price move, but if for whatever reason one wants / has to use silver or gold for this trade, we are providing the details anyway. In our view, silver has greater potential than gold does):
Silver futures downside profit-take exit price: unclear at this time - initially, it might be a good idea to exit, when gold moves to $1,703.
Gold futures downside profit-take exit price: $1,703
Long-term capital (core part of the portfolio; our opinion): No positions (in other words: cash
Insurance capital (core part of the portfolio; our opinion): Full position
Whether you already subscribed or not, we encourage you to find out how to make the most of our alerts and read our replies to the most common alert-and-gold-trading-related-questions.
Please note that we describe the situation for the day that the alert is posted in the trading section. In other words, if we are writing about a speculative position, it means that it is up-to-date on the day it was posted. We are also featuring the initial target prices to decide whether keeping a position on a given day is in tune with your approach (some moves are too small for medium-term traders, and some might appear too big for day-traders).
Additionally, you might want to read why our stop-loss orders are usually relatively far from the current price.
Please note that a full position doesn't mean using all of the capital for a given trade. You will find details on our thoughts on gold portfolio structuring in the Key Insights section on our website.
As a reminder - "initial target price" means exactly that - an "initial" one. It's not a price level at which we suggest closing positions. If this becomes the case (like it did in the previous trade), we will refer to these levels as levels of exit orders (exactly as we've done previously). Stop-loss levels, however, are naturally not "initial", but something that, in our opinion, might be entered as an order.
Since it is impossible to synchronize target prices and stop-loss levels for all the ETFs and ETNs with the main markets that we provide these levels for (gold, silver and mining stocks - the GDX ETF), the stop-loss levels and target prices for other ETNs and ETF (among other: UGL, GLL, AGQ, ZSL, NUGT, DUST, JNUG, JDST) are provided as supplementary, and not as "final". This means that if a stop-loss or a target level is reached for any of the "additional instruments" (GLL for instance), but not for the "main instrument" (gold in this case), we will view positions in both gold and GLL as still open and the stop-loss for GLL would have to be moved lower. On the other hand, if gold moves to a stop-loss level but GLL doesn't, then we will view both positions (in gold and GLL) as closed. In other words, since it's not possible to be 100% certain that each related instrument moves to a given level when the underlying instrument does, we can't provide levels that would be binding. The levels that we do provide are our best estimate of the levels that will correspond to the levels in the underlying assets, but it will be the underlying assets that one will need to focus on regarding the signs pointing to closing a given position or keeping it open. We might adjust the levels in the "additional instruments" without adjusting the levels in the "main instruments", which will simply mean that we have improved our estimation of these levels, not that we changed our outlook on the markets. We are already working on a tool that would update these levels daily for the most popular ETFs, ETNs and individual mining stocks.
Our preferred ways to invest in and to trade gold along with the reasoning can be found in the how to buy gold section. Furthermore, our preferred ETFs and ETNs can be found in our Gold & Silver ETF Ranking.
As a reminder, Gold & Silver Trading Alerts are posted before or on each trading day (we usually post them before the opening bell, but we don't promise doing that each day). If there's anything urgent, we will send you an additional small alert before posting the main one.
Thank you.
Przemyslaw Radomski, CFA
Founder, Editor-in-chief

