

Briefly: in our opinion, full (300% of the regular position size) speculative short positions in junior mining stocks are justified from the risk/reward point of view at the moment of publishing this Alert.
Last week was full of events, but the most important one clarified after Friday’s closing bell – gold formed a reversal “shooting star” candlestick.
The implications are just as you think they are. After a sharp run-up, the rally has run its course, and the yellow metal is now about to slide again.
Let’s take a closer look.
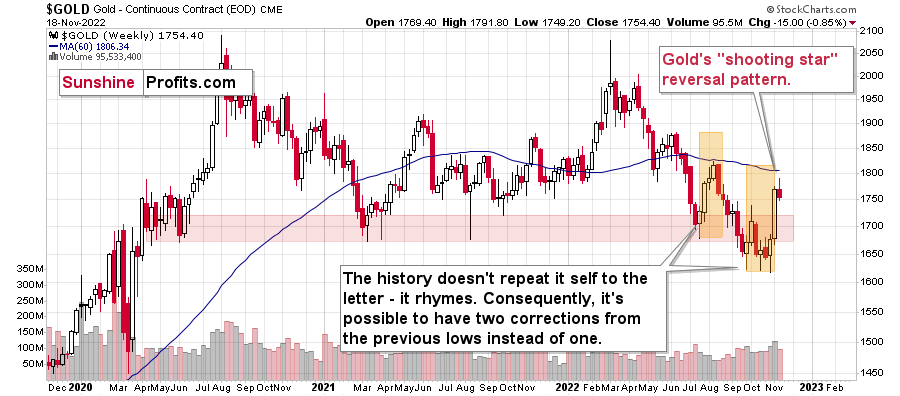
The corrective upswing was quite sizable and sharp. It was bigger than what we saw in July and August 2022, and this time, gold needed just two weeks to rally, instead of four.
Back in mid-2022, it then took gold three weeks to decline to more or less where the corrective rally started. So, yes, gold fell a bit faster than it had climbed.
History rhymes, so this time, the decline could be sharper than the rally as well. And since the rally took just two weeks… It looks like the next week or two might be very interesting for gold investors/traders. And bearish.
Actually, the next ~1.5 weeks because this week’s trading will be limited due to Thanksgiving.
You might be wondering, why I forecasted that the gold price would be about to “slide”, instead of just moving lower in a more or less regular manner.
The analogy to what gold did in 2013 is one of the major reasons.
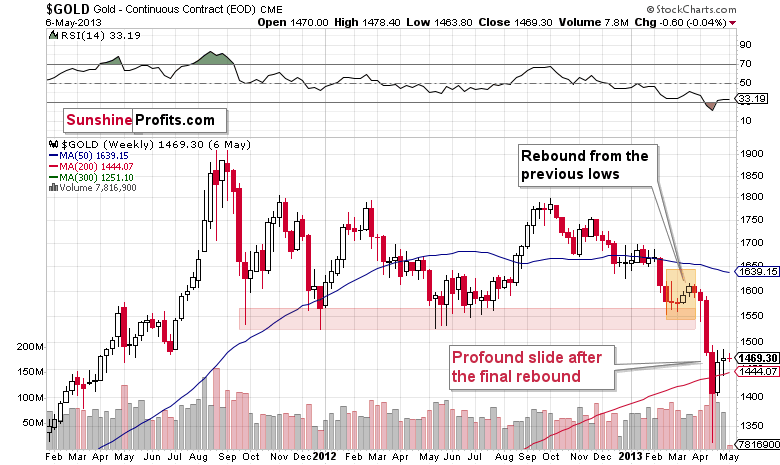
The first thing that you can notice on the above chart is that it looks just like the previous one, even though they are almost a decade apart. And that’s true.
How is that even possible, given different economic and geopolitical realities? It’s possible because the key drivers behind decisions to buy and sell remain the same: fear and greed. Those don’t change, people tend to react similarly to similar price/volume patterns.
Of course, each situation is specific, which is why history doesn’t repeat itself to the letter, but it does tend to rhyme.
When you compare the situations that I marked with orange on both charts, you’ll realize that we’re currently likely in a situation where gold is just before its major slide.
Consequently, last week’s “shooting star” candlestick is not “just” a reversal pattern. It’s a reversal pattern that likely marks the beginning of a new stage of the bigger self-similar pattern. A stage that is characterized by a dramatic downswing.
There were many other confirmations of the bearish case, but the above-mentioned link (and the one to 2008) are the most important ones, in my view. One of the remaining indications came from the silver market.
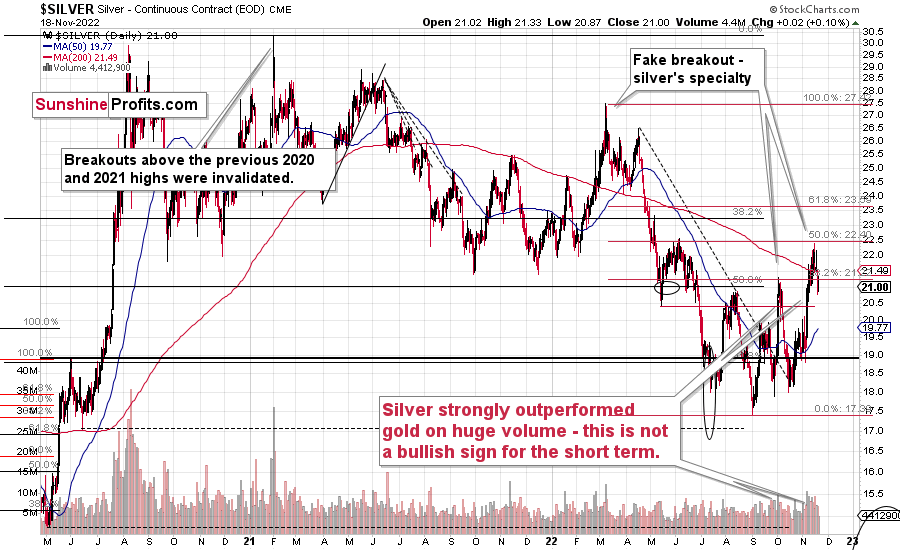
The white metal moved a lot during this recent upswing, and while most markets (stock prices, the USD Index, mining stocks) corrected ~38.2% of the preceding moves (that’s one of the classic Fibonacci retracements), silver corrected about 50% of the preceding decline.
This might appear bullish, but it’s not. Silver’s short-term outperformance of gold has proven to be a bearish indication over and over again. Consequently, forecasting higher silver prices based on the fact that it has just rallied significantly (and that it outperformed gold) is usually a bad idea.
Before summarizing, I would like to recall two recent situations (one more recent than the other). Earlier this month, I received quite a few questions about the increase in the official sector’s purchases of gold – whether it was bullish. I replied that it was not bullish because the governments and monetary authorities tend to be the worst investors. They tend to buy close to the top, and they tend to sell close to the bottom.
I used the Brown Bottom as an example - the huge sale of gold reverses over 20 years ago that marked to bottom of gold prices and launched a multi-year bull market).
Interestingly, we recently saw a confirmation of this tendency – from a different market, but still. Namely, the President of El Salvador decided to make Bitcoin the country’s legal tender. That happened just a few months before Bitcoin formed its all-time high – from which it fell by over 70%.
Now, while I don’t think that gold made an all-time high recently, taking the two together makes it even more likely that gold is not about to rally in the medium term, but decline. The long-term outlook for gold remains very bullish – in my view, we just need to wait for it a bit longer (in terms of months).
Having said that, let’s take a look at the markets from a more fundamental point of view.
The Unwind
After the Consumer Price Index (CPI) underperformed expectations on Nov. 10, the crowd decided that the Fed’s inflation fight was over, and a dovish pivot was on the horizon. However, I warned on Nov. 11 that the narrative was much more semblance than substance. I wrote:
While investors celebrated the mild drop in the CPI, their willingness to assume that inflation will decline linearly should be their downfall. Throughout 2022, bear market rallies have uplifted gold, silver, mining stocks and the S&P 500 as uninformed narratives are powerful. However, their short shelf life has culminated with new lows once reality re-emerged. Thus, we expect a similar outcome over the medium term.
To that point, while some financial assets have adjusted, the PMs and the S&P 500 remain in denial, and the bulls don’t realize that a dovish 180 is a figment of their imagination.
Please see below:
 Source: Bloomberg/ZeroHedge
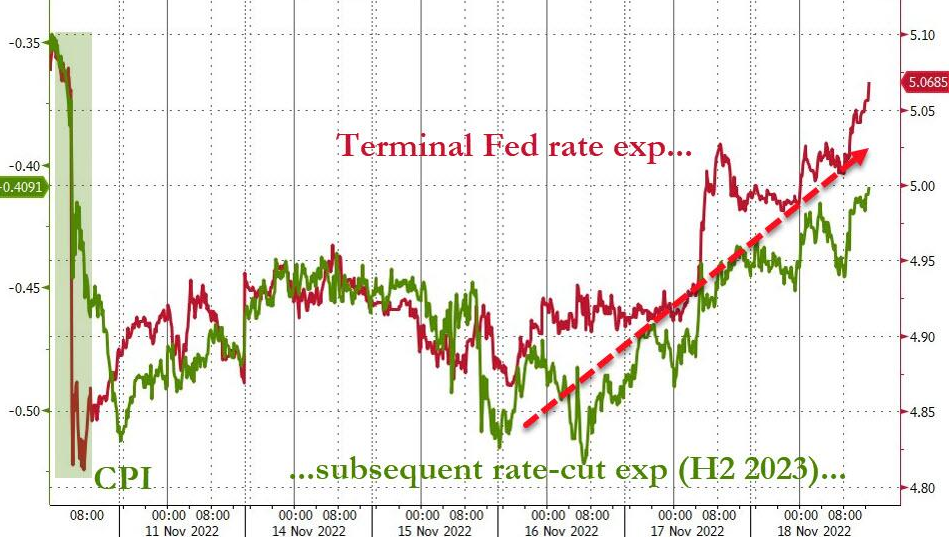
To explain, the red line above tracks the peak U.S. federal funds rate (FFR) implied by the futures market, while the green line above tracks the inverted (down means up) number of rate cuts priced in thereafter.
If you analyze the left side of the chart, you can see that rate hike expectations decreased, and rate cut expectations increased following the CPI release on Nov. 10. However, if you turn your attention to the right side of the chart, you can see that reality has resurfaced, and the red line has erased nearly all of its post-CPI losses.
Therefore, dovish bets have been unwound, hawkish bets have returned, and the narrative that uplifted the gold price and the S&P 500 has evaporated. As a result, while investors continue to buy hope and sell reality, the fundamental implications of a higher FFR should prove problematic for the PMs in the months ahead.
In addition, while Fed Chairman Jerome Powell was crystal clear during his post-FOMC press conference on Nov. 2, Fed officials have ramped up their hawkish rhetoric in recent days. Whether it was Waller, Bullard, Kashkari, Jefferson, Daly or Williams, officials reasserted their commitment to combatting inflation.
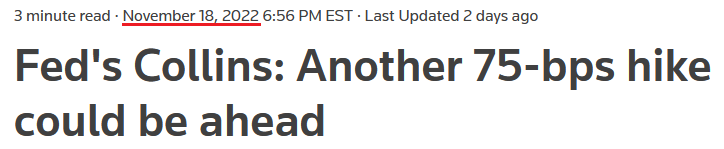
Moreover, Boston Fed President Susan Collins said on Nov. 18:
“We're starting to see some promising signs, although certainly we're not seeing clear consistent evidence of the kind of softening in labor markets, the kind of dynamic that we would like to see and service sector prices are still very high. I do not see clear, significant evidence that the overall inflation rate is coming down at this point.”
She added:
“Restoring price stability remains the current imperative and it is clear that there is more work to do…. I would say that some of the data that we've seen since [the last FOMC meeting] has increased at the top of where [the FFR] might need to go.”
As such, while investors prioritize bullish seasonality and ignore the bearish fundamentals, the latter should reign supreme when sentiment shifts, as has been the case throughout 2022.
Please see below:
 Source: Reuters
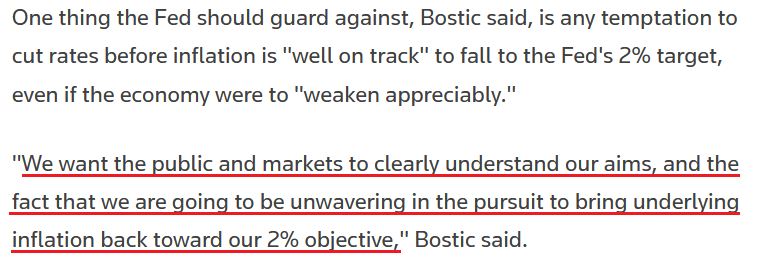
Likewise, Atlanta Fed President Raphael Bostic said on Nov. 19:
“If the economy proceeds as I expect, I believe that 75 to 100 basis points of additional tightening will be warranted. I believe this level of the policy rate will be sufficient to rein in inflation over a reasonable time horizon.”
He added:
“If it turns out that that policy is not sufficiently restrictive to rein in inflation, then additional policy tightening actions may be appropriate.
“On the other hand, if economic conditions weaken appreciably – for example, if unemployment rises uncomfortably – it will be important to resist the temptation to react by reversing our policy course until it is clear that inflation is well on track to return to our longer-run target of 2%.”
So, with Bostic basically warning that a recession is not grounds for a pivot as long as inflation remains high, the investors bidding up the gold price materially underestimate the fundamental challenges that lie ahead.
Please see below:
 Source: Reuters
Overall, seasonality has clouded investors’ judgment as they assume that historically bullish periods should repeat, even when the fundamentals are drastically different. Furthermore, Fed officials’ rhetoric is crucial, and I’ve been warning about the ramifications for many months. To explain, I wrote on Dec. 16, 2021:
As one of the most important quotes of the [post-FOMC] press conference, [Powell] admitted:
“My colleagues were out talking about a faster taper and that doesn’t happen by accident. They were out talking about a faster taper before the president made his decision. So it’s a decision that effectively was more than entrained.”
And while Powell sounded a little rattled during the exchange, his slip highlights the importance of Fed officials’ hawkish rhetoric. Essentially, when Clarida, Waller, Bostic, Bullard, etc., are making the hawkish rounds, “that doesn’t happen by accident.” As such, it’s an admission that his understudies serve as messengers for pre-determined policy decisions.
Therefore, the critical point is that Powell's deputies promote the FOMC's policy preferences, and despite being an obvious initiator for several months, investors still haven't figured this out. Consequently, when the next hawkish development surprises the crowd, please remember that Powell's conduits already sounded the alarm.
Good News Is Bad News for the Gold Price
While the bulls pray for demand destruction and an eventual Fed pivot, timing matters, and the proponents have been screaming recession since the summer. For context, a recession is not bullish for the GDXJ ETF, the S&P 500 or the gold price. However, the crowd is so desperate for a dovish 180, they don’t understand that real pivots are highly bearish, and often occur when the economic outlook is dire.
In contrast, the U.S. economy remains on solid footing right now, and the medium-term outlooks are bullish for the FFR, real yields and the USD Index.
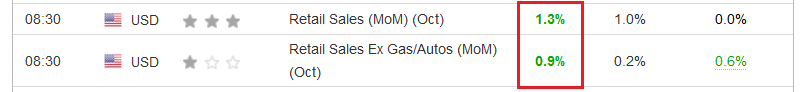
For example, I noted on Nov. 17 how U.S. retail sales rallied sharply in October. I wrote:
The U.S. Census Bureau released its retail sales report on Nov. 16; and with the metric hitting a new all-time high and outperforming expectations, investors still underestimate Americans’ ability and willingness to spend.
Please see below:
Also, the resiliency of demand highlights why wage and output inflation should remain uplifted and force the FFR higher.
Please see below:
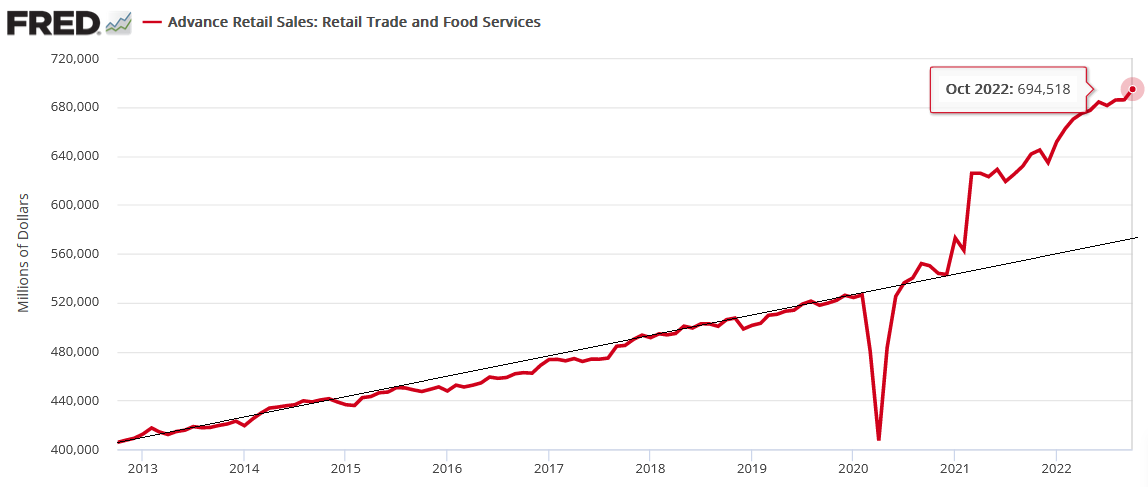
To explain, the red line above tracks the dollar value of U.S. retail sales. If you analyze the right side of the chart, you can see that the Fed’s 15 25 basis point rate hikes in 2022 have done little to slow down American consumers.
In addition, with Mastercard’s SpendingPulse U.S. retail sales report also robust, the Atlanta Fed’s Q4 real GDP growth forecast north of 4%, and the Atlanta Fed’s Wage Growth Tracker re-accelerating in October, the backdrop on Main Street is relatively resilient.
However, what’s bullish for Main Street is bearish for Wall Street because it supports a higher FFR; and with consumer strength still prevalent, the crowd underestimates the Fed’s conundrum.
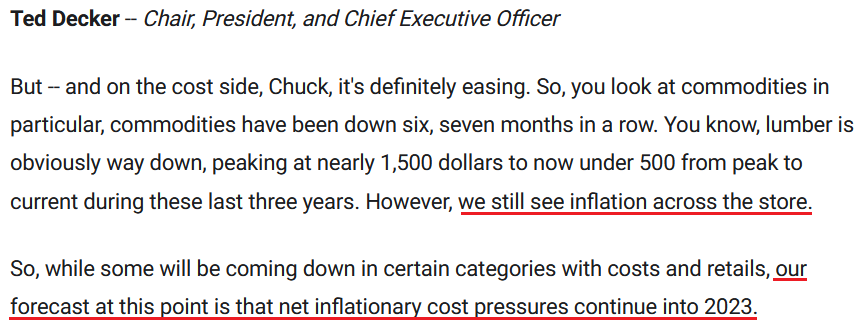
The Home Depot released its third-quarter earnings on Nov. 15. CEO Ted Decker said during the Q3 conference call:
“Our results in the quarter reflect continued solid demand for home improvement projects. While we did see some deceleration in certain products and categories, as Jeff will detail, the project business remains strong across most of our departments. We also saw year-over-year (YoY) growth with both our pro and DIY customers in the quarter.”
As a result, while Home Depot’s “consumer remains resilient” amid this “unique environment,” the largest home improvement retailer in the U.S. expects inflation to persist in 2023.
Please see below:
 Source: The Home Depot/The Motley Fool
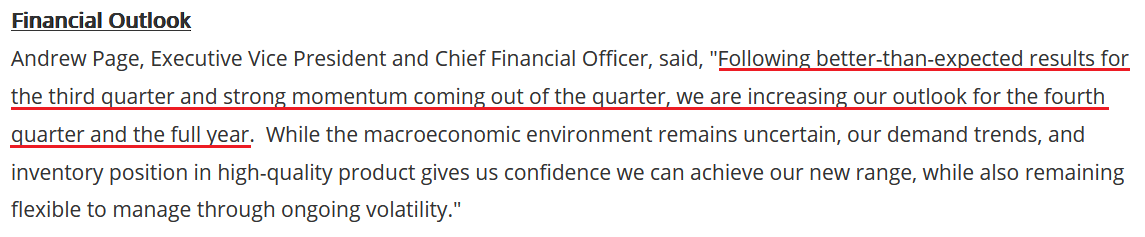
Similarly, Footlocker – a U.S. (and global) sportswear and footwear retailer – released its third-quarter earnings on Nov. 18. CEO Mary Dillon said during the Q3 conference call:
“Inflation is high. Fortunately, unemployment is low and wages are rising; we're seeing this category and our shoppers to be pretty resilient and very resilient and picking us.”
CFO Andrew Page added:
“We are excited about the momentum in the business, the resiliency we have seen in our customers and our growing ability to better serve them.”
So, while the crowd searches for demand destruction, the reality is that Americans continue to shop, and our 2023 FFR estimate of 4.5% to 5.5% may prove too low when it’s all said and done.
 Source: Foot Locker
The Bottom Line
While rate hike expectations have ratcheted higher once again, risk assets have not re-priced to reflect this reality. Moreover, with investors still assuming that inflation will magically disappear and the Fed will cut rates, the proponents of this theory should suffer profound disappointment over the medium term.
In conclusion, the PMs were mixed on Nov. 18, as the gold price declined. However, the USD Index and the U.S. 10-Year real yield increased, and both should seek higher ground in the months ahead; and let’s not forget: the Fed’s balance sheet continues to contract, and the liquidity drain adds another bearish layer to the rate hike crusade.
Overview of the Upcoming Part of the Decline
- It seems to me that the corrective upswing is over (or about to be over) and that the next big move lower is already underway (or that it’s about to start).
- If we see a situation where miners slide in a meaningful and volatile way while silver doesn’t (it just declines moderately), I plan to – once again – switch from short positions in miners to short positions in silver. At this time, it’s too early to say at what price levels this could take place and if we get this kind of opportunity at all – perhaps with gold prices close to $1,500 - $1,550.
- I plan to switch from the short positions in junior mining stocks or silver (whichever I’ll have at that moment) to long positions in junior mining stocks when gold / mining stocks move to their 2020 lows (approximately). While I’m probably not going to write about it at this stage yet, this is when some investors might consider getting back in with their long-term investing capital (or perhaps 1/3 or 1/2 thereof).
- I plan to return to short positions in junior mining stocks after a rebound – and the rebound could take gold from about $1,450 to about $1,550, and it could take the GDXJ from about $20 to about $24. In other words, I’m currently planning to go long when GDXJ is close to $20 (which might take place when gold is close to $1,450), and I’m planning to exit this long position and re-enter the short position once we see a corrective rally to $24 in the GDXJ (which might take place when gold is close to $1,550).
- I plan to exit all remaining short positions once gold shows substantial strength relative to the USD Index while the latter is still rallying. This may be the case with gold prices close to $1,400 and GDXJ close to $15 . This moment (when gold performs very strongly against the rallying USD and miners are strong relative to gold after its substantial decline) is likely to be the best entry point for long-term investments, in my view. This can also happen with gold close to $1,400, but at the moment it’s too early to say with certainty.
- The above is based on the information available today, and it might change in the following days/weeks.
You will find my general overview of the outlook for gold on the chart below:
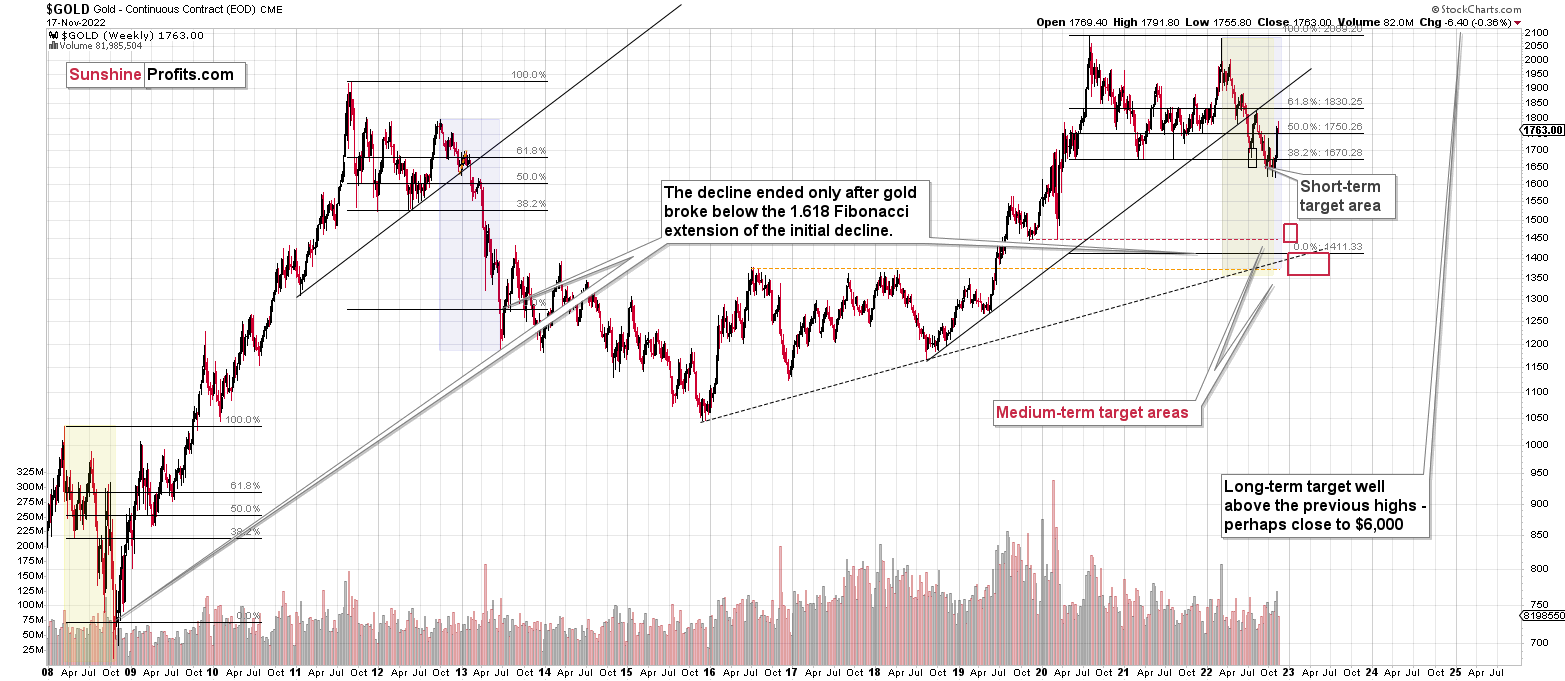
Please note that the above timing details are relatively broad and “for general overview only” – so that you know more or less what I think and how volatile I think the moves are likely to be – on an approximate basis. These time targets are not binding nor clear enough for me to think that they should be used for purchasing options, warrants, or similar instruments.
Summary
Summing up, while the precious metals sector moved higher last week, it seems that it’s just a part of a bigger – bearish – analogy to what we saw in 2008. I realize that volatile upswings generate a lot of emotions, but taking a calm, broad look at the markets shows that nothing really changed.
Last week’s shooting start candlestick in gold indicates that the rally is over.
I would like to take this opportunity to congratulate you on your patience with this trade (and I’m grateful for your understanding that not every corrective upswing can be “caught” in trading terms). Many investors and traders panic and get out of the market exactly at the wrong time, but your patience and self-discipline mean that you’re poised to make the most of what the market brings us this and next year.
Moving back to the market, it appears to be yet another time when the markets are incorrectly expecting the Fed to make a dovish U-turn, and based on this, the part of the 2008 decline where we saw the biggest corrective upswing materialized.
In my opinion, the current trading position is going to become profitable in the following weeks, and quite possibly in the following days. And while I can’t promise any kind of performance, I fully expect it to become very profitable before it’s over and to prolong our 2022 winning streak.
After the final sell-off (that takes gold to about $1,350-$1,500), I expect the precious metals to rally significantly. The final part of the decline might take as little as 1-5 weeks, so it's important to stay alert to any changes.
As always, we'll keep you – our subscribers – informed.
To summarize:
Trading capital (supplementary part of the portfolio; our opinion): Full speculative short positions (300% of the full position) in junior mining stocks are justified from the risk to reward point of view with the following binding exit profit-take price levels:
Mining stocks (price levels for the GDXJ ETF): binding profit-take exit price: $20.32; stop-loss: none (the volatility is too big to justify a stop-loss order in case of this particular trade)
Alternatively, if one seeks leverage, we’re providing the binding profit-take levels for the JDST (2x leveraged). The binding profit-take level for the JDST: $27.87; stop-loss for the JDST: none (the volatility is too big to justify a SL order in case of this particular trade).
For-your-information targets (our opinion; we continue to think that mining stocks are the preferred way of taking advantage of the upcoming price move, but if for whatever reason one wants / has to use silver or gold for this trade, we are providing the details anyway.):
Silver futures downside profit-take exit price: $12.32
SLV profit-take exit price: $11.32
ZSL profit-take exit price: $74.87
Gold futures downside profit-take exit price: $1,504
HGD.TO – alternative (Canadian) 2x inverse leveraged gold stocks ETF – the upside profit-take exit price: $18.47
HZD.TO – alternative (Canadian) 2x inverse leveraged silver ETF – the upside profit-take exit price: $46.87
Long-term capital (core part of the portfolio; our opinion): No positions (in other words: cash)
Insurance capital (core part of the portfolio; our opinion): Full position
Whether you’ve already subscribed or not, we encourage you to find out how to make the most of our alerts and read our replies to the most common alert-and-gold-trading-related-questions.
Please note that we describe the situation for the day that the alert is posted in the trading section. In other words, if we are writing about a speculative position, it means that it is up-to-date on the day it was posted. We are also featuring the initial target prices to decide whether keeping a position on a given day is in tune with your approach (some moves are too small for medium-term traders, and some might appear too big for day-traders).
Additionally, you might want to read why our stop-loss orders are usually relatively far from the current price.
Please note that a full position doesn't mean using all of the capital for a given trade. You will find details on our thoughts on gold portfolio structuring in the Key Insights section on our website.
As a reminder - "initial target price" means exactly that - an "initial" one. It's not a price level at which we suggest closing positions. If this becomes the case (as it did in the previous trade), we will refer to these levels as levels of exit orders (exactly as we've done previously). Stop-loss levels, however, are naturally not "initial", but something that, in our opinion, might be entered as an order.
Since it is impossible to synchronize target prices and stop-loss levels for all the ETFs and ETNs with the main markets that we provide these levels for (gold, silver and mining stocks - the GDX ETF), the stop-loss levels and target prices for other ETNs and ETF (among other: UGL, GLL, AGQ, ZSL, NUGT, DUST, JNUG, JDST) are provided as supplementary, and not as "final". This means that if a stop-loss or a target level is reached for any of the "additional instruments" (GLL for instance), but not for the "main instrument" (gold in this case), we will view positions in both gold and GLL as still open and the stop-loss for GLL would have to be moved lower. On the other hand, if gold moves to a stop-loss level but GLL doesn't, then we will view both positions (in gold and GLL) as closed. In other words, since it's not possible to be 100% certain that each related instrument moves to a given level when the underlying instrument does, we can't provide levels that would be binding. The levels that we do provide are our best estimate of the levels that will correspond to the levels in the underlying assets, but it will be the underlying assets that one will need to focus on regarding the signs pointing to closing a given position or keeping it open. We might adjust the levels in the "additional instruments" without adjusting the levels in the "main instruments", which will simply mean that we have improved our estimation of these levels, not that we changed our outlook on the markets. We are already working on a tool that would update these levels daily for the most popular ETFs, ETNs and individual mining stocks.
Our preferred ways to invest in and to trade gold along with the reasoning can be found in the how to buy gold section. Furthermore, our preferred ETFs and ETNs can be found in our Gold & Silver ETF Ranking.
As a reminder, Gold & Silver Trading Alerts are posted before or on each trading day (we usually post them before the opening bell, but we don't promise doing that each day). If there's anything urgent, we will send you an additional small alert before posting the main one.
Thank you.
Przemyslaw K. Radomski, CFA
Founder, Editor-in-chief

