

Briefly: In our opinion, full (200% of the regular size of the position) speculative short positions in gold, silver and mining stocks are justified from the risk/reward perspective at the moment of publishing this alert.
Gold started the month with an upswing, silver soared and… Silver stocks declined. Yes, you read that right. Big upswings can be bullish developments, but it’s definitely not true in all cases. For instance, in this case, one could say that while it’s true that gold moved higher, it failed to move to the late-March high, let alone break above it. Why is gold not moving decisively in any direction? What’s it waiting for? Was gold’s early-April rally just a late April fool’s joke?
Let’s start with the shocker – silver stocks (chart courtesy of http://stockcharts.com).
The Tiny Decline
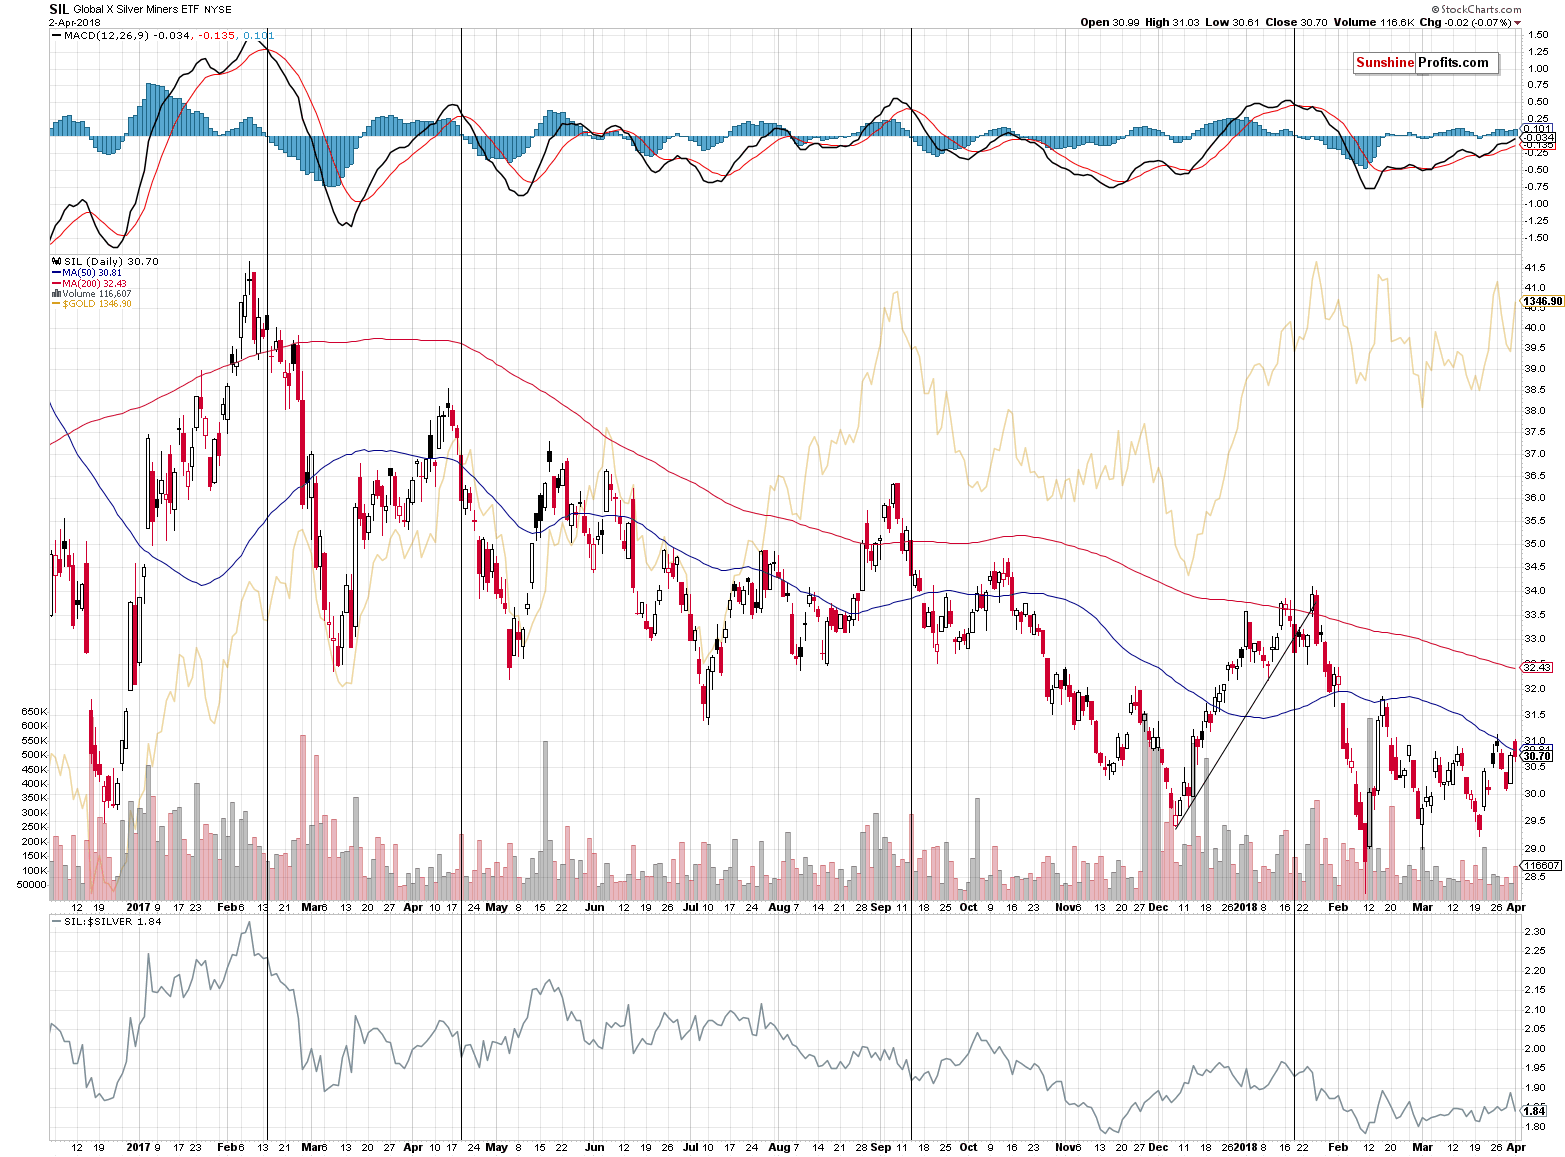
The decline in the SIL ETF that we’re using as a proxy for the silver miners wasn’t something huge. SIL declined by only 2 cents. But the discrepancy between the fact that they declined at all and silver’s big daily gain, is a big warning sign for anyone who decided to trust yesterday’s strength. Naturally, silver miners should confirm the move of the underlying metal – but they didn’t. The general stock market can be responsible for a part of the underperformance, but not for its entirety.
SIL moved briefly above the 50-day moving average and declined shortly thereafter That’s the third time this year that we’re seeing this kind of action. Both previous cases were followed by declines, so the implications here are also bearish. It’s also worth noting that the volume that accompanied the intraday reversal was relatively big – it was biggest in a week.
Silver’s Daily “Strength”
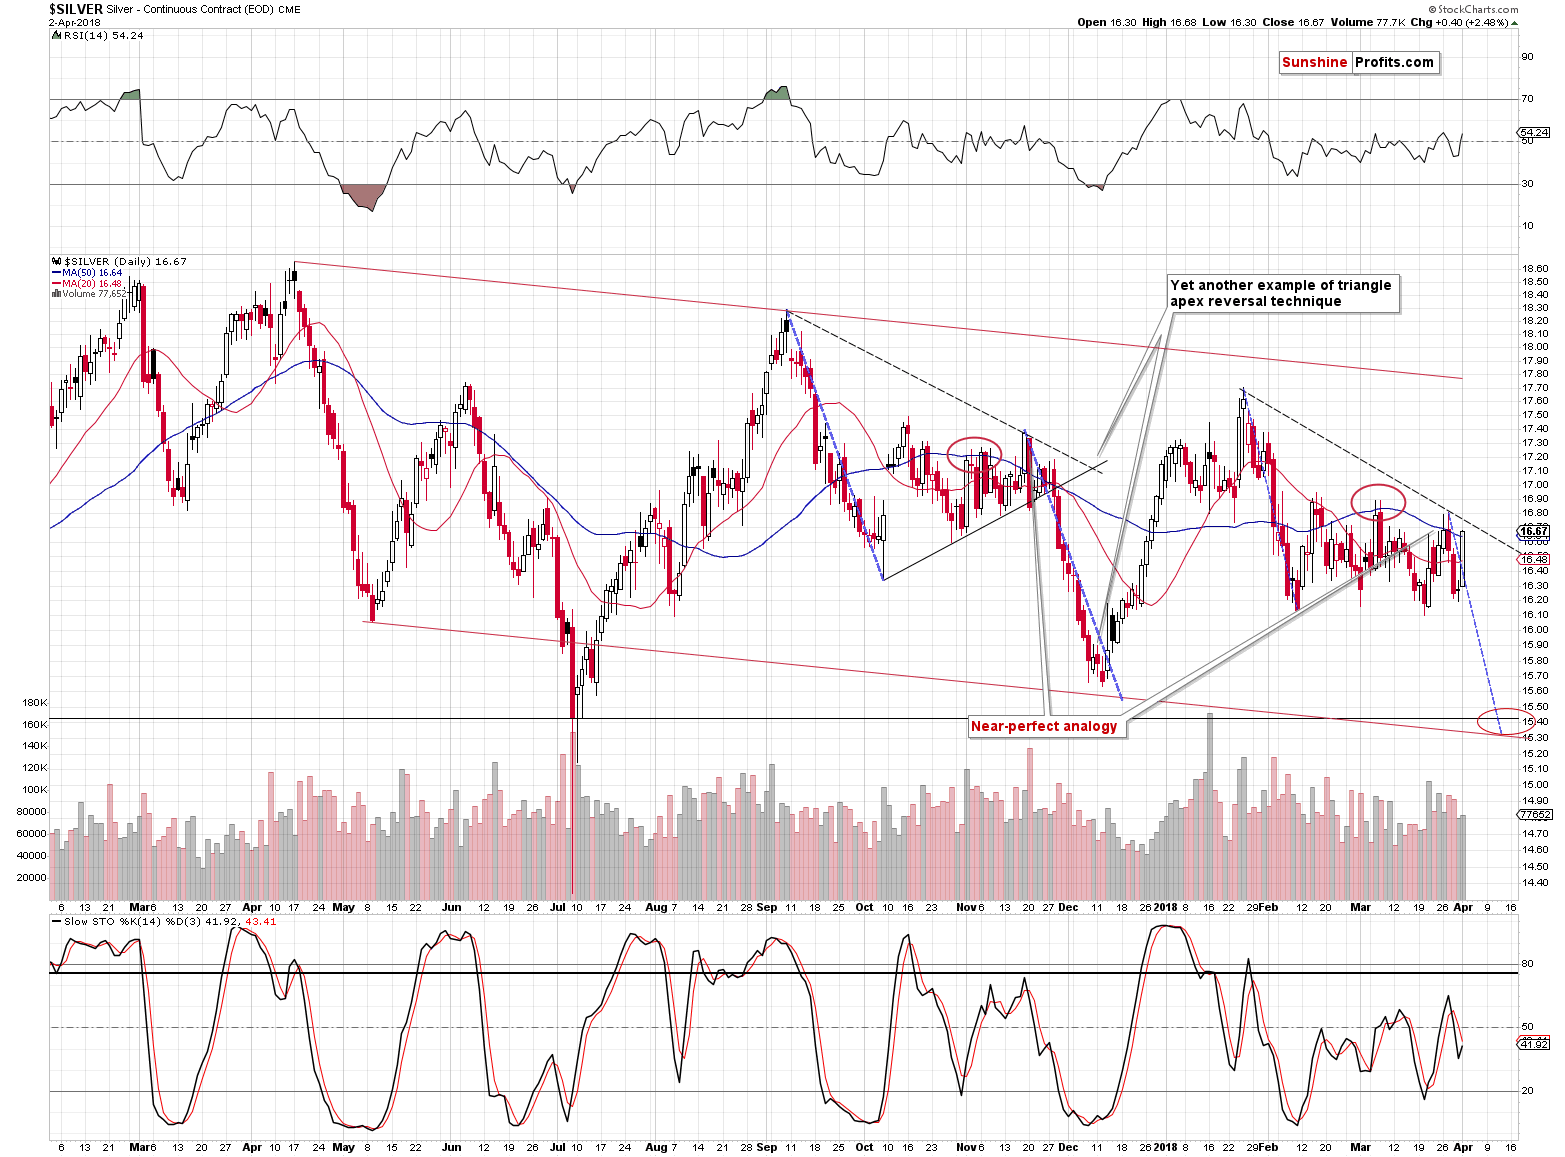
The white metal moved sharply higher during yesterday’s session. In fact, it moved to the late-March high erasing two previous daily declines during just one day. But, unless you are new to our analyses, you know that silver’s big daily rallies are often fake moves and they are good entry moments for short, not long positions. This is especially the case, when silver outperforms the rest of the precious metals sector. Was this the case?
Definitely.
Gold’s Extra Pop-up
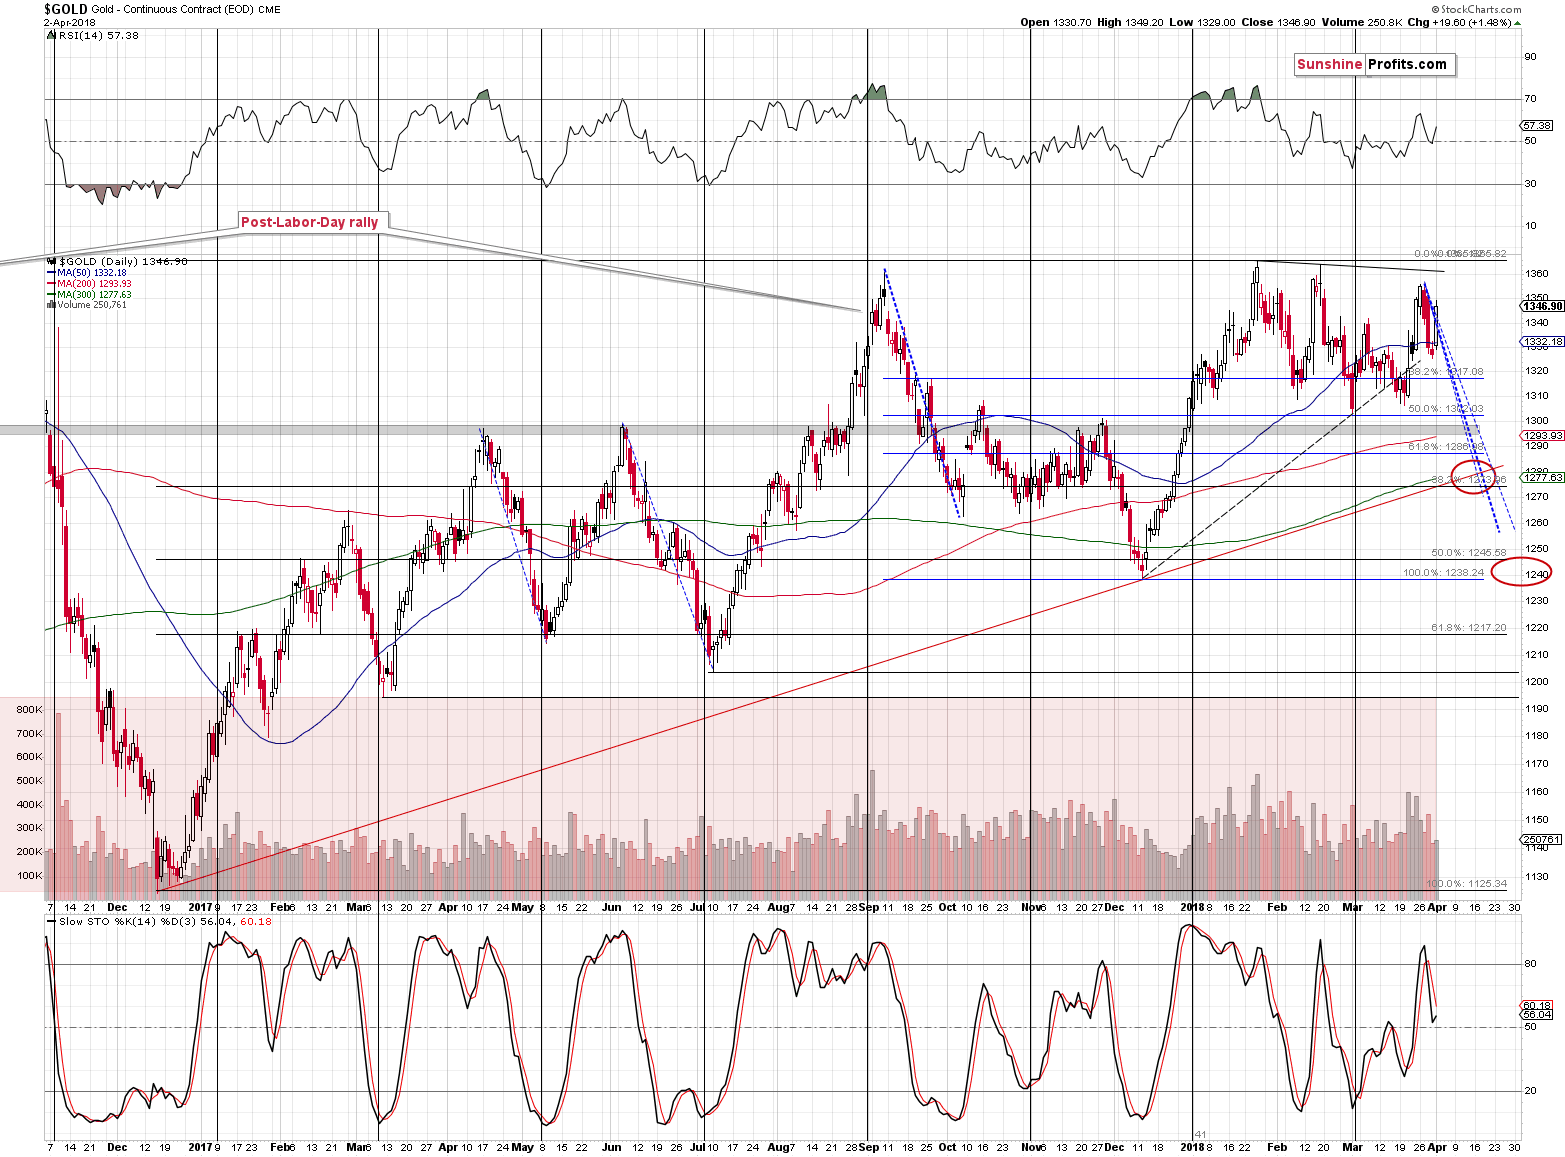
Gold moved higher, but it didn’t close at its late-March highs. It ended yesterday’s session about $10 lower. Consequently, silver has indeed showed strength, which makes yesterday’s session a bearish sign. That’s yet another daily sign of silver’s strength that we saw in the past several weeks. The bearish outlook is therefore more and more confirmed.
In the previous alerts, we discussed the triple tops in gold and we wrote that they were followed by one final extra pop-up before the decline. Yesterday’s upswing would perfectly fit that pattern, which is another reason not to view it as something bullish. The pattern simply continued, and the implications didn’t change – they remain bearish.
This is Boring! Why Would Gold Ever Decline?
The back-and-forth movement may seem tiring and boring, even exhausting – and it’s perfectly understandable. But, please keep in mind that there’s usually calm before the storm and biggest moves tend to be followed by bigger consolidations. The market clearly wants to move lower, but the surprising news (like trade conflict with China) kept delaying the start of the big slide. How do we know? Because, if the precious metals market really wanted to soar, it would have soared – it had all the fundamental reasons it needed and USD well below the 2015 and 2016 lows. Yet, gold failed to rally above the previous highs, while silver and mining stocks are not even close to the analogous highs.
Therefore, the decline was simply delayed – it was not cancelled. The bearish outlook remains intact, but one needs to be patient to fully profit from it. Naturally, this doesn’t imply blindly sticking to a position (that would be the case if someone was simply stubborn and not changing their mind was more important than final profits) – it doesn’t mean exiting the position every time wind blows the other way (just for the sake of making something – that may be the goal of some brokers as it would benefit them – not necessarily the investor). For us – since we care about your investment success – it means analyzing news and market’s reactions as they come and comparing them to what a bullish and bearish market would do. So far, we keep receiving bearish confirmations, to the outlook remains bearish. Your patience will likely be well rewarded.
While we’re at it, we would like to discuss a question that we are asked every now and then regarding gold’s big moves. It goes like this “What needs to happen for gold to move to $XYZ?”.
Our reply is almost always “nothing”, to which we usually get “huh?” as a reply along with a raised eyebrow. Then we elaborate.
You see, in real, non-market life, when you have an object that’s not moving and you’re not doing anything with it, it tends to stay in its place. It’s so obvious that you might be wondering why we’re mentioning this at all. Now, if something is moving at a constant speed and there are not obstacles, it will continue to move at the same speed as along as nobody interrupts it. That’s Newton’s first law of motion, by the way.
It’s extremely easy to extrapolate what’s obvious in real life to the markets. But that’s not how markets work. The laws that apply in physics, don’t have to apply in case of the markets. Why? Because the markets are not only driven by facts – they are driven by investors’ emotions. Emotions can trigger moves that are opposite of what should be taking place and they are responsible for a whole series of non-logical developments. Speculative manias, for example.
Don’t despair – there’s still something that we can use to estimate market’s “default mode”, but it’s not as simple as the law of inertia.
There’s another rule regarding the market that may be just as obvious as the above-mentioned physics law: markets move from being overbought to oversold and vice-versa. Simple as that – in the above context it can also be understood that there is an inherent cyclicality in the market and that’s what we should view as the default.
Direct consequence of market’s long-term cyclicality is the fact that if nothing happens, the market will not stay in place – it will follow its cycle. Whether that will be a move up or down depends on the stage of the cycle that the market is currently in.
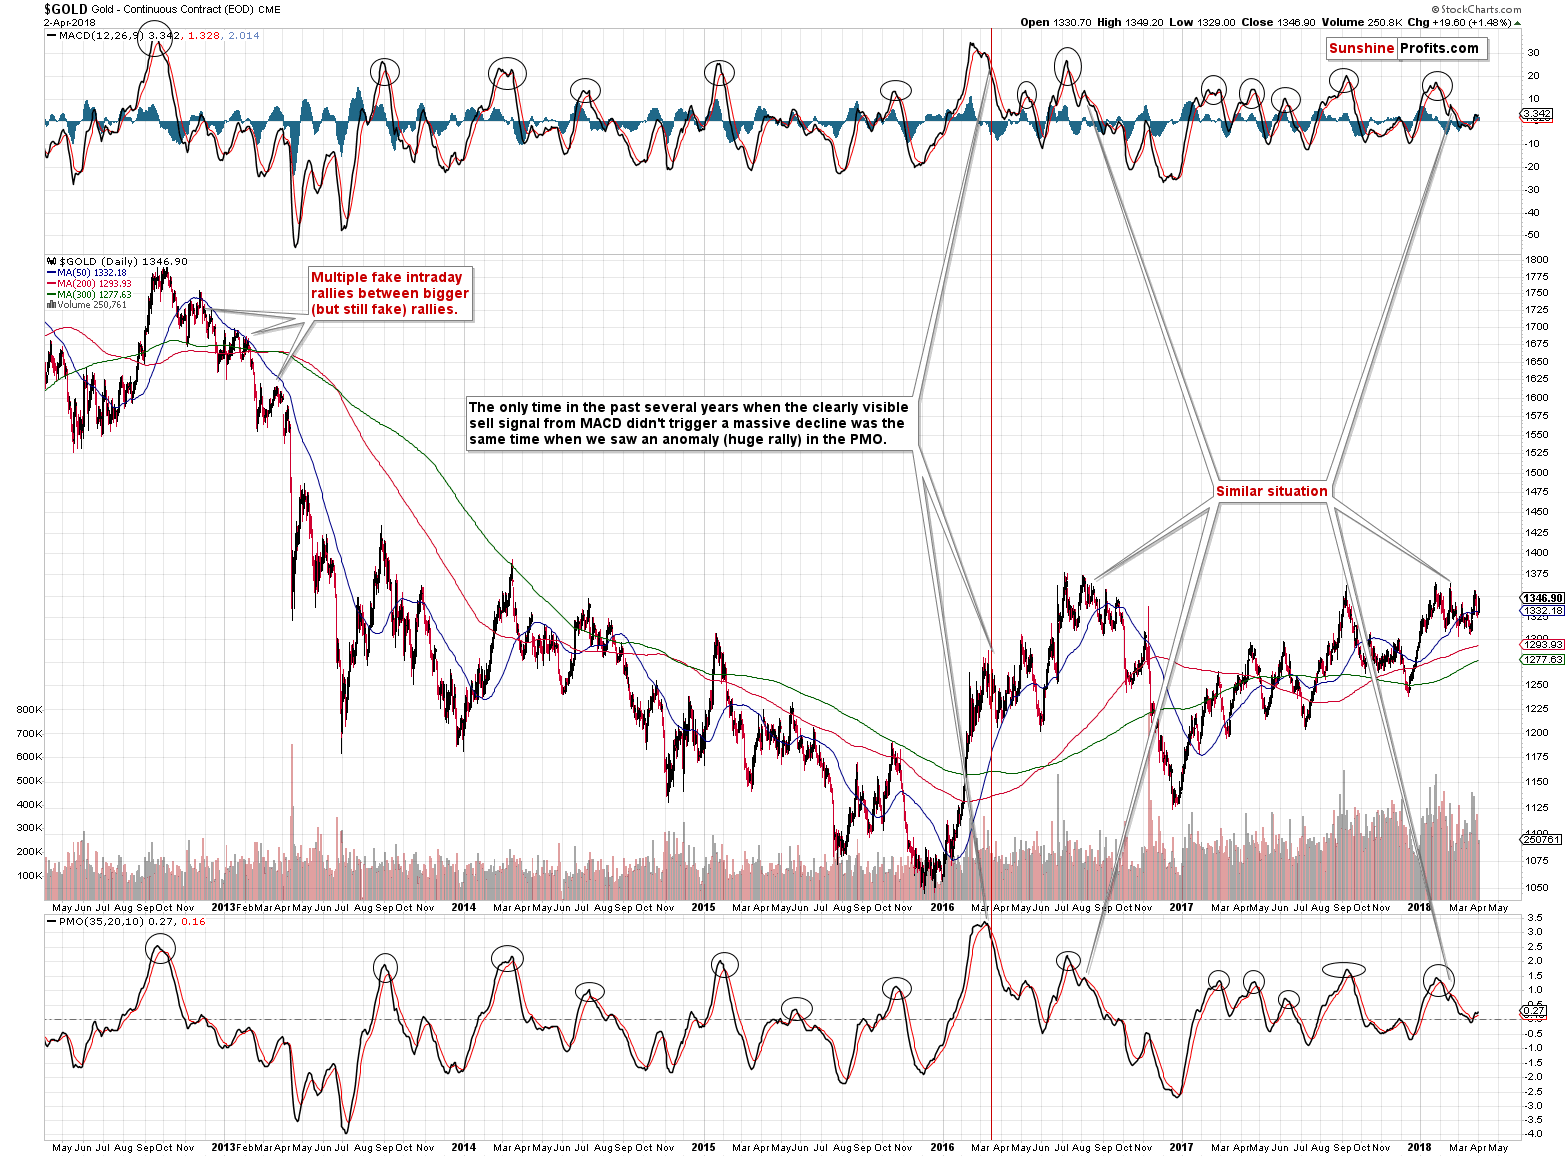
In case of gold and the current situation, it’s been in a down cycle since the 2011 top and we know this, because during the 2015 bottom gold wasn’t hated enough and precious metals investors (here: those who either consider purchases or are already invested) were not bearish – they were eager to buy more and expected higher gold prices. This is documented by the surveys and confirmed by long-term technical signs and analogies. Therefore, since gold didn’t truly bottom yet, it’s down cycle remains in play. So, what needs to happen for gold to move lower? Nothing. Gold is moving back and forth because new bullish fundamental developments keep popping up. But the amount of bullish news will eventually equal 0 and as soon as it does, and the market has “nothing” bullish to rally on, the price is likely to resume its default move – which is currently down. If we see bearish news, gold is likely to slide quite sharply.
After the final and scary bottom, gold’s default mode will become a rally and then it’s likely to trade sideways in light of bearish news – but it seems that we are still months before the start of this stage.
Low-volume Rally in the Miners
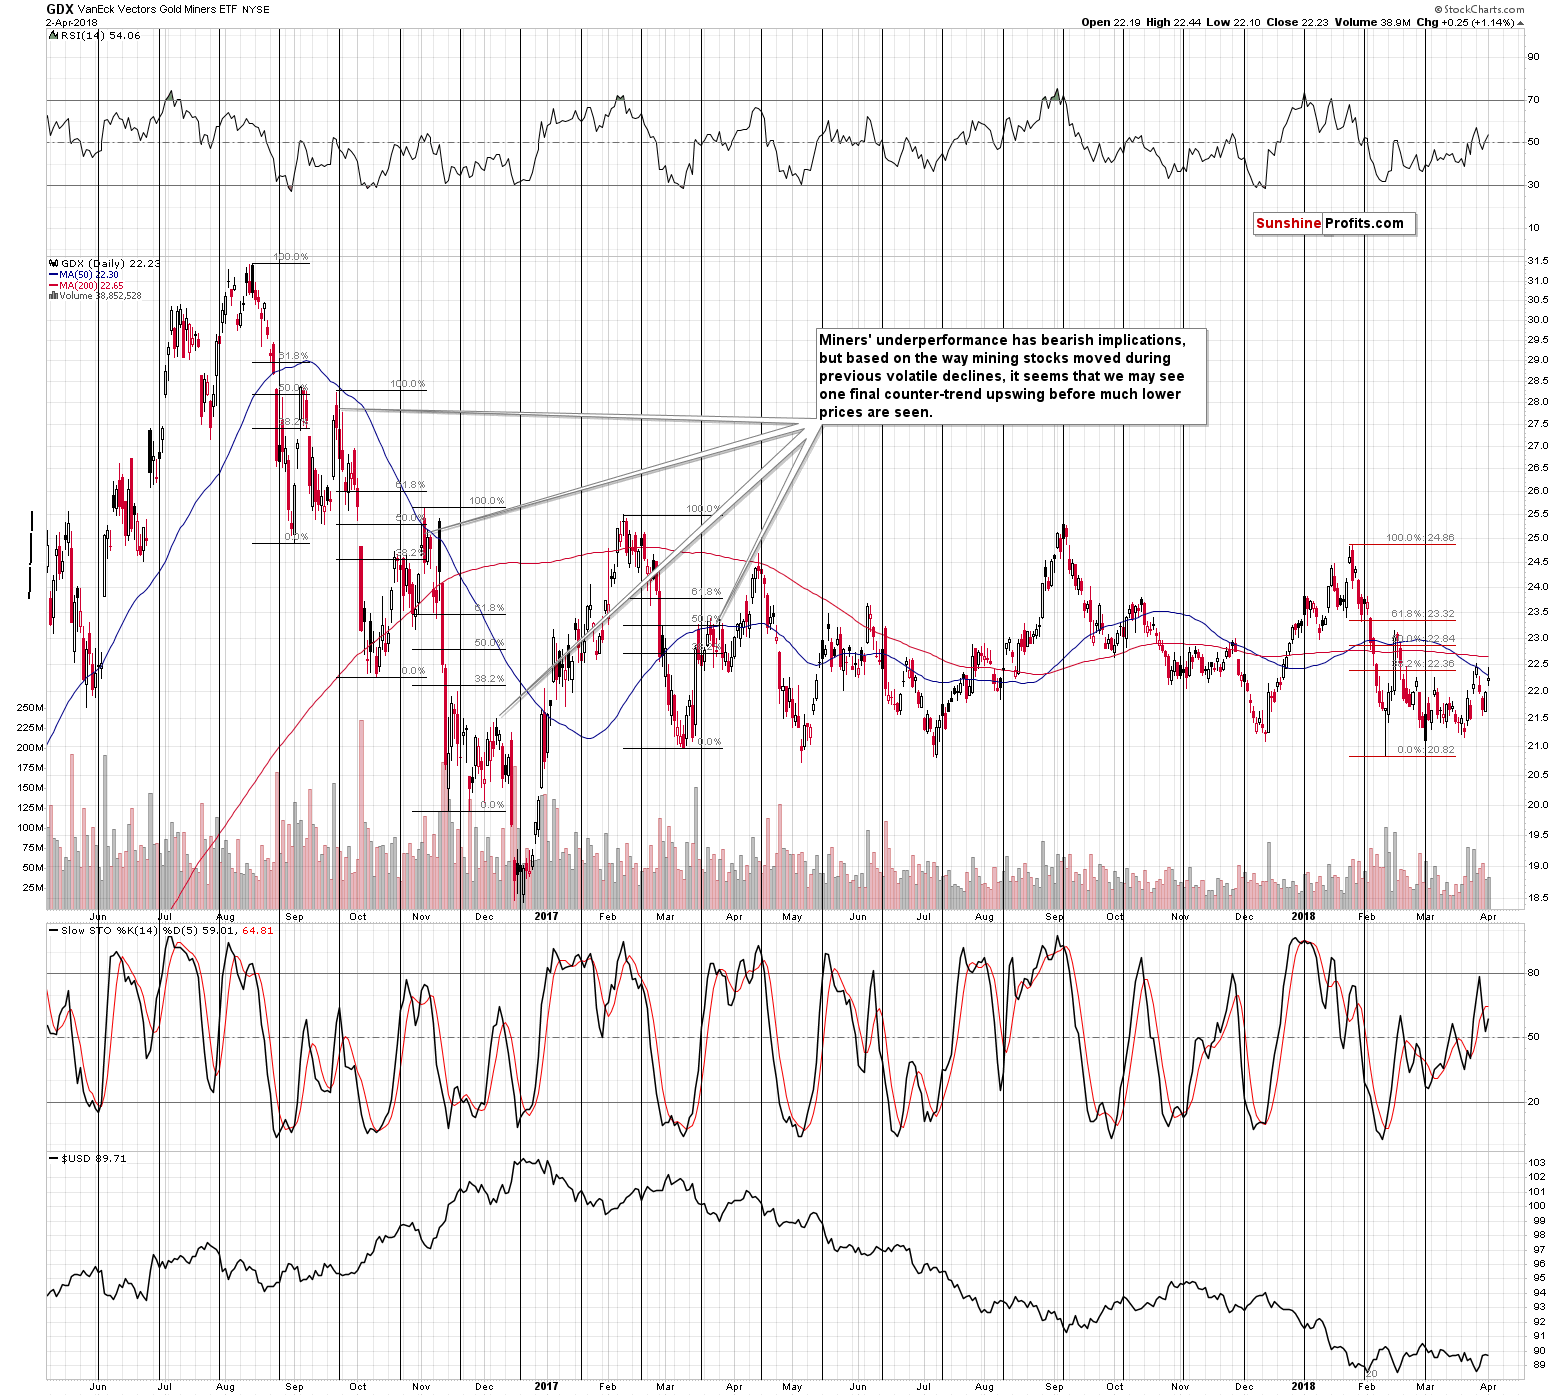
We already wrote that silver stocks declined a bit yesterday, but the mining stocks sector as a whole moved higher. The move was not significant, though. GDX didn’t move to new short-term highs and it didn’t manage to close the day above the 50-day moving average. Just like it was the case with silver, GDX already attempted to move above this MA twice this year and both cases were followed by declines. The implications are bearish.
The fact that mining stocks moved higher on relatively low volume confirms the bearish outlook. The volume was smallest in a week and definitely smaller than the volume that accompanied the preceding decline.
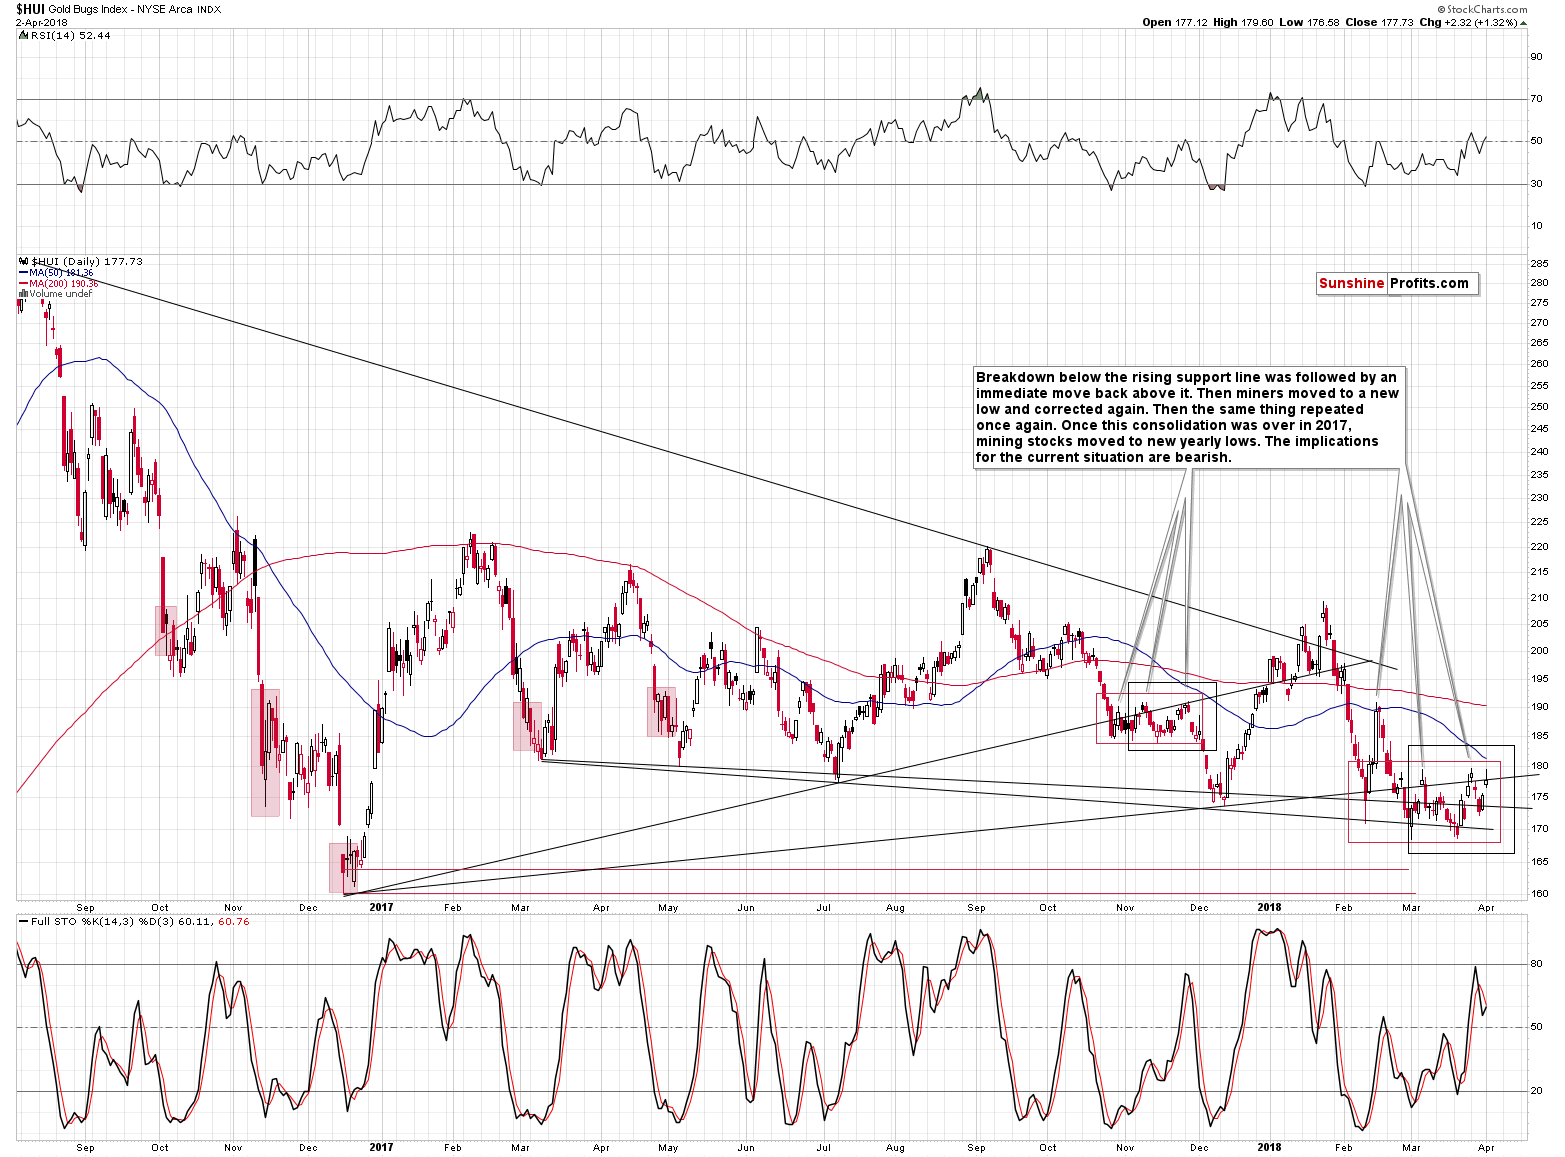
The HUI Index didn’t manage to move to its 50-day moving average, but it moved temporarily above its rising, medium-term resistance line and reversed shortly thereafter, finally closing right at this level. This attempt of gold shares to break above this line was therefore invalidated even sooner than the late-March one. The implications are bearish, and they are further confirmed by the fact that the entire session took form of a reversal candlestick called the shooting star.
USD Quietly Confirms Short-term Breakout
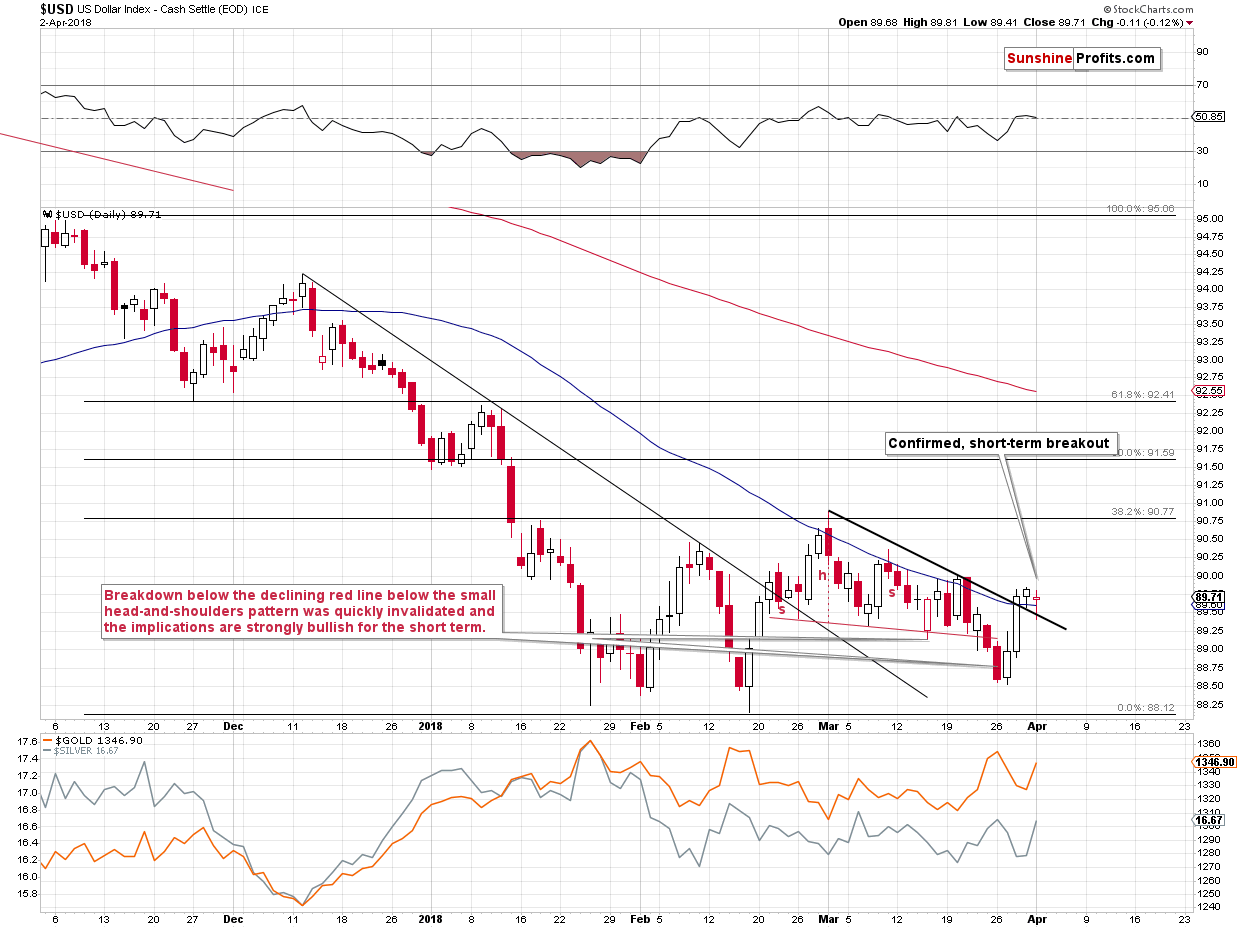
The last two sessions were quite boring in case of the USD Index, but the implications quickly become bearish, once one realizes that these two sessions took place right after a breakout. Yesterday’s close above the declining, short-term resistance / support line was the third close after the breakout – the one that confirmed it. Higher values of the USD are now very likely.
It may be a bullish sign for the precious metals sector that yesterday’s rally in it took place without a big (only a relatively small one) decline in the USD Index. However, we don’t buy into this bullishness just yet. It was just a single-day phenomenon and today’s pre-market action seems to confirm our view. At the moment of writing these words, gold is down by $4.30 while the USD Index is down by 0.15. If there were truly bullish implications of yesterday’s session, gold should have gone higher once again. It didn’t, which – along with other bearish signs discussed today – suggests that yesterday’s gold-USD link was rather accidental.
Summary
Summing up, precious metals’ back and forth movement is likely just a delay within a big cyclical decline and something that’s likely to be over soon. What needs to happen for gold to move lower? Nothing. Gold is moving back and forth because new bullish fundamental developments keep popping up. But the amount of bullish news will eventually equal 0 and as soon as it does, and the market has “nothing new” bullish to rally on (the long-term fundamentals will not be affected – we mean the news only), the price is likely to resume its default move – which is currently down. If we see bearish news, gold is likely to slide quite sharply.
As always, we will keep you – our subscribers – informed.
To summarize:
Trading capital (supplementary part of the portfolio; our opinion): Full short positions (200% of the full position) in gold, silver and mining stocks are justified from the risk/reward perspective with the following stop-loss orders and initial target price levels:
- Gold: initial target price: $1,218; stop-loss: $1,382; initial target price for the DGLD ETN: $53.98; stop-loss for the DGLD ETN $37.68
- Silver: initial target price: $14.63; stop-loss: $17.33; initial target price for the DSLV ETN: $33.88; stop-loss for the DSLV ETN $21.48
- Mining stocks (price levels for the GDX ETF): initial target price: $19.22; stop-loss: $23.54; initial target price for the DUST ETF: $39.88; stop-loss for the DUST ETF $21.46
In case one wants to bet on junior mining stocks' prices (we do not suggest doing so – we think senior mining stocks are more predictable in the case of short-term trades – if one wants to do it anyway, we provide the details), here are the stop-loss details and initial target prices:
- GDXJ ETF: initial target price: $27.82; stop-loss: $36.14
- JDST ETF: initial target price: $94.88 stop-loss: $41.86
Long-term capital (core part of the portfolio; our opinion): No positions (in other words: cash)
Insurance capital (core part of the portfolio; our opinion): Full position
Important Details for New Subscribers
Whether you already subscribed or not, we encourage you to find out how to make the most of our alerts and read our replies to the most common alert-and-gold-trading-related-questions.
Please note that the in the trading section we describe the situation for the day that the alert is posted. In other words, it we are writing about a speculative position, it means that it is up-to-date on the day it was posted. We are also featuring the initial target prices, so that you can decide whether keeping a position on a given day is something that is in tune with your approach (some moves are too small for medium-term traders and some might appear too big for day-traders).
Plus, you might want to read why our stop-loss orders are usually relatively far from the current price.
Please note that a full position doesn’t mean using all of the capital for a given trade. You will find details on our thoughts on gold portfolio structuring in the Key Insights section on our website.
As a reminder – “initial target price” means exactly that – an “initial” one, it’s not a price level at which we suggest closing positions. If this becomes the case (like it did in the previous trade) we will refer to these levels as levels of exit orders (exactly as we’ve done previously). Stop-loss levels, however, are naturally not “initial”, but something that, in our opinion, might be entered as an order.
Since it is impossible to synchronize target prices and stop-loss levels for all the ETFs and ETNs with the main markets that we provide these levels for (gold, silver and mining stocks – the GDX ETF), the stop-loss levels and target prices for other ETNs and ETF (among other: UGLD, DGLD, USLV, DSLV, NUGT, DUST, JNUG, JDST) are provided as supplementary, and not as “final”. This means that if a stop-loss or a target level is reached for any of the “additional instruments” (DGLD for instance), but not for the “main instrument” (gold in this case), we will view positions in both gold and DGLD as still open and the stop-loss for DGLD would have to be moved lower. On the other hand, if gold moves to a stop-loss level but DGLD doesn’t, then we will view both positions (in gold and DGLD) as closed. In other words, since it’s not possible to be 100% certain that each related instrument moves to a given level when the underlying instrument does, we can’t provide levels that would be binding. The levels that we do provide are our best estimate of the levels that will correspond to the levels in the underlying assets, but it will be the underlying assets that one will need to focus on regarding the signs pointing to closing a given position or keeping it open. We might adjust the levels in the “additional instruments” without adjusting the levels in the “main instruments”, which will simply mean that we have improved our estimation of these levels, not that we changed our outlook on the markets. We are already working on a tool that would update these levels on a daily basis for the most popular ETFs, ETNs and individual mining stocks.
Our preferred ways to invest in and to trade gold along with the reasoning can be found in the how to buy gold section. Additionally, our preferred ETFs and ETNs can be found in our Gold & Silver ETF Ranking.
As a reminder, Gold & Silver Trading Alerts are posted before or on each trading day (we usually post them before the opening bell, but we don't promise doing that each day). If there's anything urgent, we will send you an additional small alert before posting the main one.
=====
Latest Free Trading Alerts:
What a day! The beginning of the new quarter, the new month and the new week was undoubtedly the triumph of oil bears. Thanks to their attack crude oil lost almost 3% in one day, which was the biggest decline since weeks. What impact did this drop have on the short-term outlook? Where are the nearest supports? For these and other questions you will find answers in today's alert.
=====
Hand-picked precious-metals-related links:
PRECIOUS-Gold prices slip after Monday's surge
Sales of US Mint American Eagle gold, silver coins fall in March
Perth Mint's gold sales rise in March, m/m silver sales slip
India central bank drops Axis Bank from list of bullion importers
=====
In other news:
U.S. Stock Futures Climb as Turmoil Starts to Ease: Markets Wrap
Inflation Could Help Ease the U.S.'s Debt Burden
Australia's central bank leaves rate unchanged at 1.50%
Five Key Players at the Heart of Deutsche Bank’s Drama
=====
Thank you.
Sincerely,
Przemyslaw Radomski, CFA
Founder, Editor-in-chief, Gold & Silver Fund Manager
Gold & Silver Trading Alerts
Forex Trading Alerts
Oil Investment Updates
Oil Trading Alerts

