

Briefly: in our opinion, a full (300% of the regular position size) speculative short position in silver is justified from the risk/reward point of view at the moment of publishing this Alert.
Today’s analysis will once again take a hybrid format. I’m going to tell you about the key development – the debt ceiling talks and the resulting moves on the markets – in the video linked below.
And here’s the link that I mentioned in the video.
Having said that, let’s take a look at the details from an even more fundamental point of view.
QE Infinity
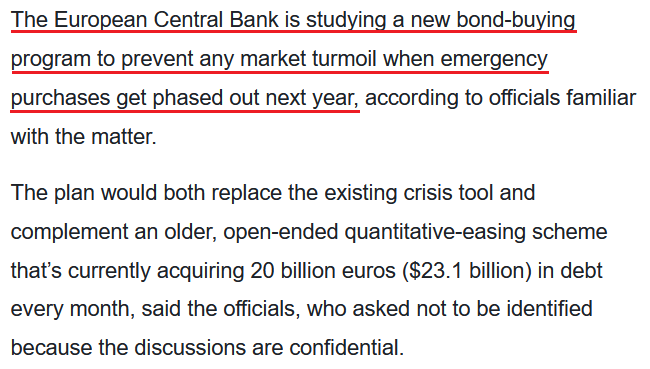
While I’ve warned on several occasions that the Fed and the ECB are worlds apart, the latter now wants to provide more QE once it concludes QE. To explain, with the ECB’s PEPP program set to expire at the end of March 2022, the central bank is increasingly worried about a bond market sell-off. And with sluggish Eurozone growth, exorbitant sovereign debt and a lack of fiscal impulse increasing the ECB’s anxiety, officials are studying “alternatives” to suppress interest rates in the Eurozone’s most debt-ridden countries.
Please see below:
 Source: Bloomberg
For context, I’ve been warning for months that the ECB would disappoint euro bulls.
I wrote on Apr. 27:
Recent whispers of the ECB tapering its bond-buying program are extremely premature. With the European economy still drastically underperforming the U.S., it’s actually more likely that the ECB increases the pace of its bond-buying program. Case in point: while the EUR/USD ignores the reality, last week’s PEPP purchases (€22.2 billion) by the ECB were the highest since June 2020. Moreover, since its March meeting, the ECB has increased its average daily PEPP purchases per week from €2.90 billion to €3.60 billion.
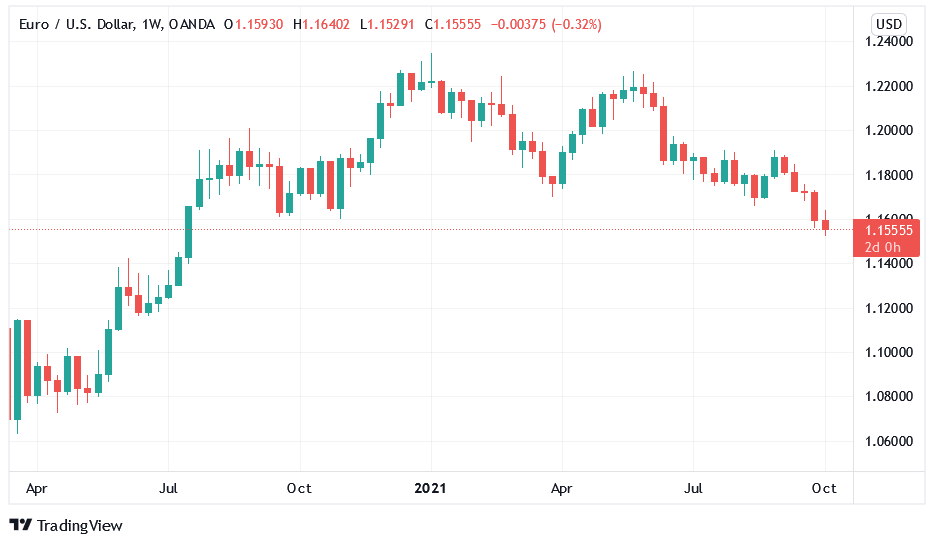
To that point, with reality in fashion once again, the EUR/USD closed at a new 2021 low on Oct. 6 and sunk to its lowest level since July 2020. For context, the EUR/USD accounts for nearly 58% of the movement of the USD Index, and the performance of the currency pair is material.
Please see below:
Furthermore, with the Fed closing in on a taper announcement and the ECB searching for new ways to extend QE, the divergence is profoundly bullish for the U.S. dollar. To explain, rising Eurozone inflation (which pales in comparison to the U.S.) underwrote misguided optimism for a hawkish shift. However, ECB President Christine Lagarde reiterated her dovish stance on Oct. 5, saying that “we should not overreact to supply shortages or rising energy prices, as our monetary policy cannot directly affect those phenomena.”
The Inflation Divergence Is Profound
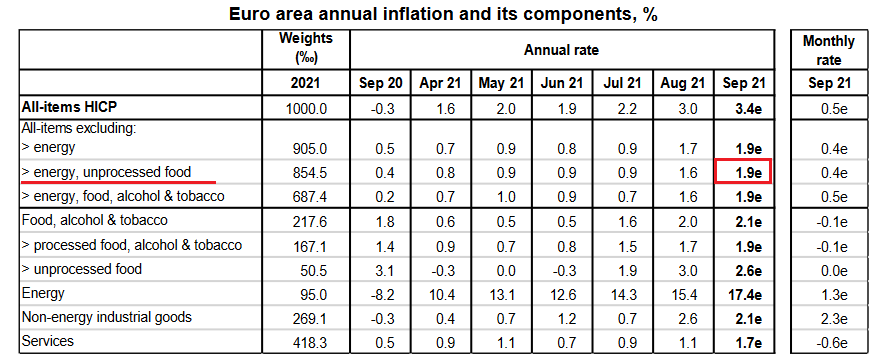
Moreover, while the Eurozone headline Harmonized Index of Consumer Prices (HICP) increased by 3.4% year-over-year (YoY) in September (released on Oct. 1), the U.S. headline HICP surged by 6.77% in its latest print (released on Aug. 18). Even more revealing, if you exclude the inflationary impacts of food and energy prices, the Eurozone core HICP only increased by 1.9% YoY in September.
Please see below:
 Source: Eurostat
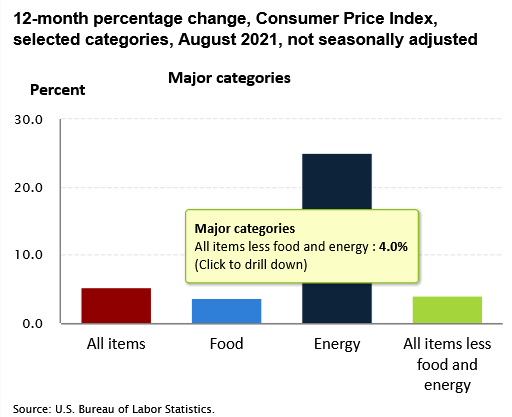
In stark contrast, the U.S. core Consumer Price Index (CPI) – which also excludes the inflationary impacts of food and energy prices and the latest release is more current than the U.S. HICP – increased by 4% YoY in August (released on Sep. 14).
Please see below:
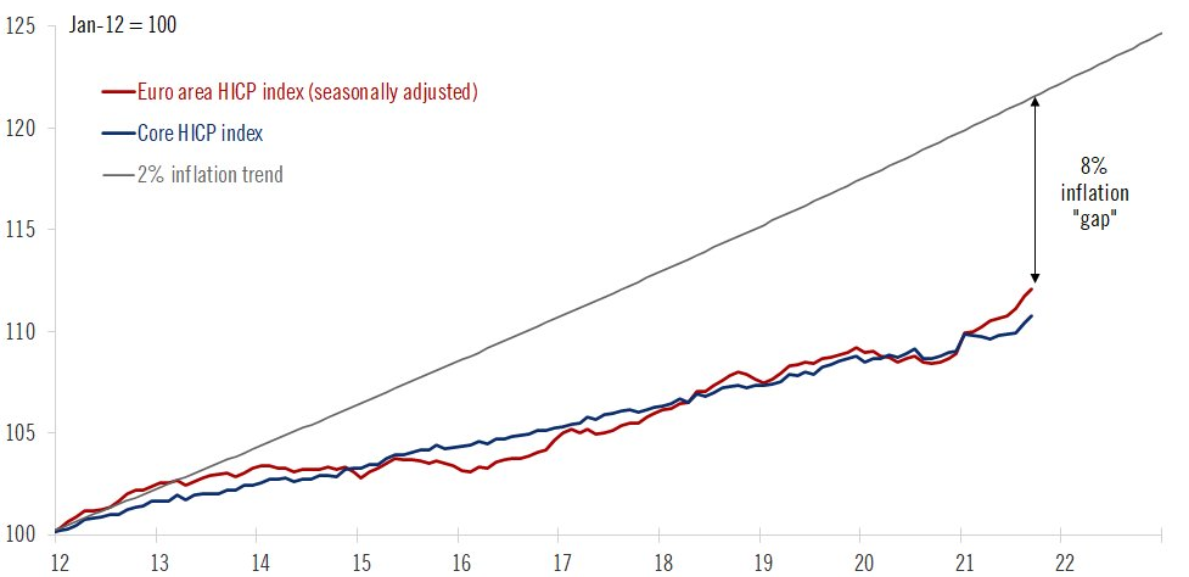
In addition, while the Eurozone headline HICP at 3.4% YoY is still higher than the ECB’s 2% annual inflation target, it’s important to keep things in perspective. For example, since Lagarde has been leading the ECB, the Eurozone headline and core HICP have trended 0.8% and 1.7% below her annual targets. What’s more, when indexed from the beginning of 2012, Eurozone headline HICP is still 8% below the ECB’s 2% annual inflation trend.
Please see below:
 Source: Frederik Ducrozet
To explain, the red and blue lines above track the index levels of the Eurozone headline and core HICP, while the gray line above tracks the index level assuming the ECB has been meeting its 2% annual inflation target since the beginning of 2012. If you analyze the material gap on the right side of the chart, you can see that the ECB is far from achieving its objectives.
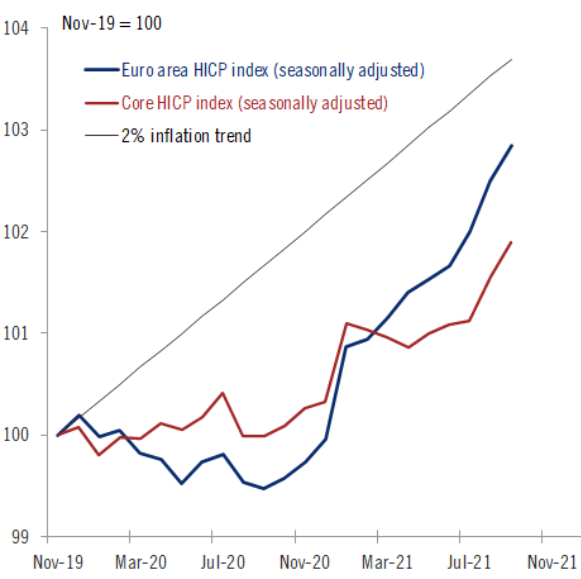
Likewise, if we zoom in on the roughly two-year chart, both the Eurozone headline and core HICP are still tracking materially below the ECB’s annual inflation targets.
Please see below:
 Source: Frederik Ducrozet
Cyclical Slowdown Ahead?
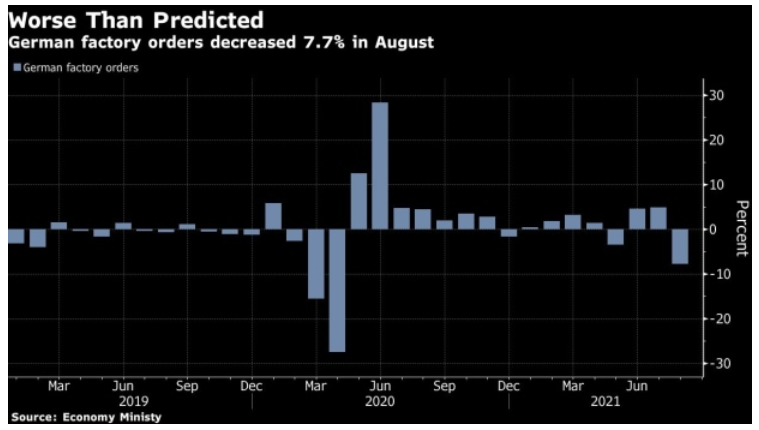
Furthermore, while the ECB studies “alternatives” to prevent interest rates from spiking in high-debt countries like Greece, Italy and Portugal, Germany – Europe’s largest economy – has suffered a significant economic setback. To explain, Germany is a manufacturing-heavy economy and exports are an important component of German GDP. However, with German factory orders plunging by 7.7% on Oct. 6 – with foreign demand down by 9.5% and domestic demand down by 5.2% – it was the sharpest month-over-month (MoM) decline since April 2020. For context, the consensus estimate was for a 2.1% decline.
Please see below:
Piecing it all together, with interest rate anxiety merging with a cyclical slowdown in Europe, Danske Bank expects lower-for-longer ECB policy to contribute to a lower-for-longer EUR/USD. The Danish bank’s strategists told clients:
“There has been no shortage of calls for EUR/USD to 1.30, of pieces written on a regime shift having happened in fiscal policy, oversubscription to social bonds and much more. However, narratives change…. Stagflation, rapid cyclical slowdown, rising interest rates and a correction in valuations may prove to be a very negative capital shock to the euro area and its asset prices. We target 1.13 in spot EUR/USD in the next year but if stagflation, cyclical slowdown and rising rates become dominant themes, then there seem to be clear downside to such estimate.”
Adding to the bearish euro thesis, with U.S. nonfarm payrolls scheduled for release on Oct. 8, a strong print could usher the EUR/USD even lower. For example, ADP’s private payrolls came in at 568,000 vs. 428,000 expected on Oct. 6. And though ADP’s data is an extremely poor predictor of U.S. nonfarm payrolls, Nela Richardson, chief economist at ADP, provided the following context:
“The labor market recovery continues to make progress despite a marked slowdown from the 748,000 job pace in the second quarter. Leisure and hospitality remains one of the biggest beneficiaries to the recovery, yet hiring is still heavily impacted by the trajectory of the pandemic, especially for small firms. Current bottlenecks in hiring should fade as the health conditions tied to the COVID-19 variant continue to improve, setting the stage for solid job gains in the coming months.”
And expecting those “solid job gains” to materialize sooner rather than later, J.P. Morgan strategists told clients that “we are looking for a 575,000 gain in jobs [on Oct. 8]. The driver for an above-consensus forecast is the expected rebound in the leisure and hospitality sectors.” For context, the consensus estimate is for 500,000 jobs added.
The bottom line? While the EUR/USD is finally starting to reflect fundamental reality, more downside should materialize in the coming months. With the Fed accelerating its hawkish rhetoric (and Chairman Jerome Powell’s shift the most noteworthy), the ECB is headed in the opposite direction. And while I’ve been warning for months that the Eurozone’s economic recovery is much more fragile than the U.S.’, the seeds are now sown for a profound divergence in central bank policy.
Moreover, while U.S. nonfarm payrolls may or may not accelerate the timeline on Oct. 8, it’s important to remember that the medium-term implications remain intact: the Fed should taper at a much faster pace than the ECB and the liquidity drain should pressure the FED/ECB ratio and the EUR/USD in the coming months. More importantly, though, with the EUR/USD’s pain the USD Index’s gain, the latter’s strong negative correlation with gold, silver and mining stocks should result in further downside for the PMs over the medium term.
In conclusion, the PMs were mixed once again on Oct. 6, though silver, was the worst performer of the bunch. Moreover, with the USD Index recapturing 94, and the front-end of the U.S. yield curve rallying as well, a recovering U.S. labor market should add more upward momentum to the PMs’ fundamental villains. As a result, the precious metals’ current consolidations will likely give way to sharp drawdowns in the coming months.
Overview of the Upcoming Part of the Decline
- It seems to me that the corrective upswing in gold is over, and the big decline seems to be already underway. We are very likely in the final part of this short-term decline, which is why I expect silver to catch up with mining stocks and decline quite substantially.
- It seems that the first stop for gold will be close to its previous 2021 lows, slightly below $1,700. Then it will likely correct a bit, but it’s unclear if I want to exit or reverse the current short position based on that – it depends on the number and the nature of the bullish indications that we get at that time. Before the next big slide, I will likely prefer to get back to the short position in the junior mining stocks.
- After the above-mentioned correction, we’re likely to see a powerful slide, perhaps close to the 2020 low ($1,450 - $1,500).
- If we see a situation where miners slide in a meaningful and volatile way while silver doesn’t (it just declines moderately), I plan to – once again – switch from short positions in miners to short positions in silver. At this time, it’s too early to say at what price levels this could take place, and if we get this kind of opportunity at all – perhaps with gold close to $1,600.
- I plan to exit all remaining short positions when gold shows substantial strength relative to the USD Index while the latter is still rallying. This might take place with gold close to $1,350 - $1,400. I expect silver to fall the hardest in the final part of the move. This moment (when gold performs very strongly against the rallying USD and miners are strong relative to gold after its substantial decline) is likely to be the best entry point for long-term investments, in my view. This might also happen with gold close to $1,375, but it’s too early to say with certainty at this time. I expect the final bottom to take place near the end of the year, perhaps in mid-December.
- As a confirmation for the above, I will use the (upcoming or perhaps we have already seen it?) top in the general stock market as the starting point for the three-month countdown. The reason is that after the 1929 top, gold miners declined for about three months after the general stock market started to slide. We also saw some confirmations of this theory based on the analogy to 2008. All in all, the precious metals sector is likely to bottom about three months after the general stock market tops.
- The above is based on the information available today, and it might change in the following days/weeks.
You will find my general overview of the outlook for gold on the chart below:
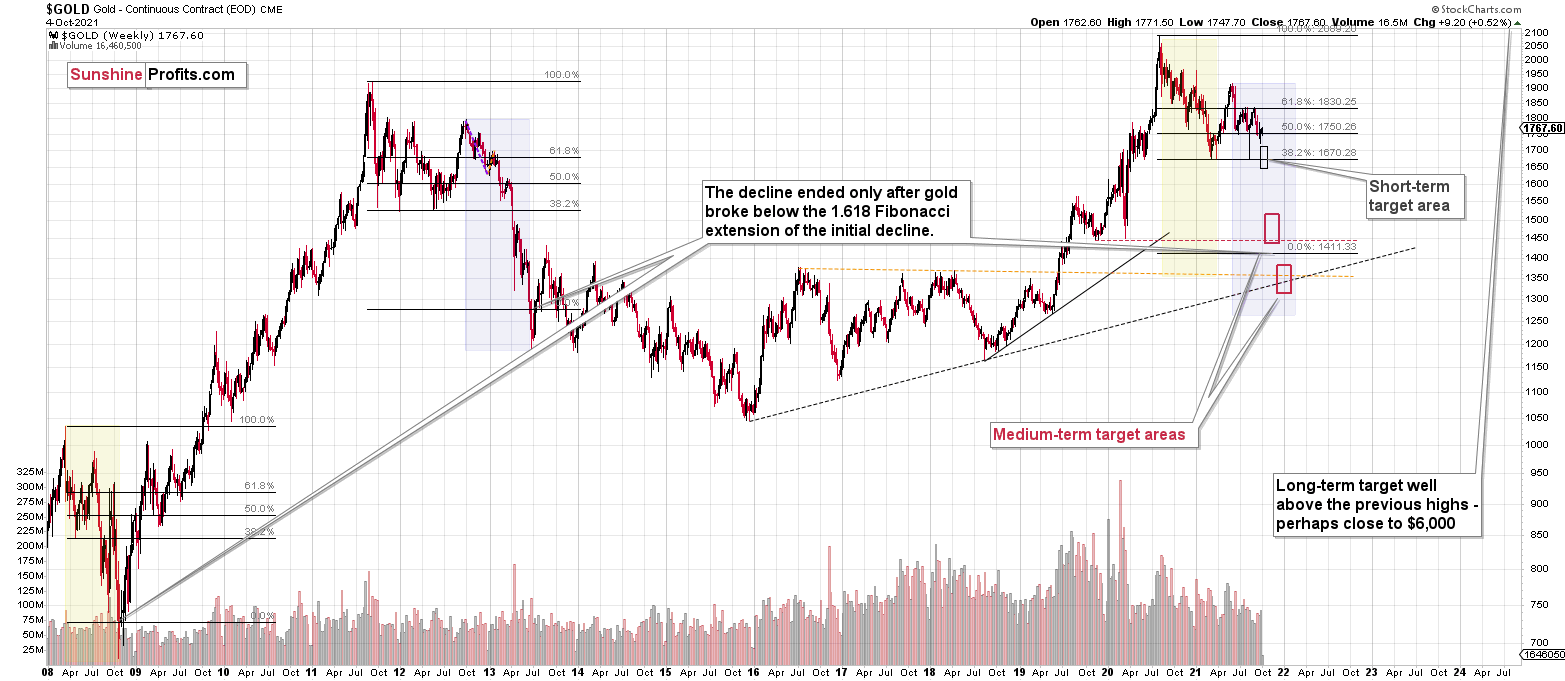
Please note that the above timing details are relatively broad and “for general overview only” – so that you know more or less what I think and how volatile I think the moves are likely to be – on an approximate basis. These time targets are not binding or clear enough for me to think that they should be used for purchasing options, warrants or similar instruments.
Summary
To summarize, the outlook for the precious metals sector remains extremely bearish for the next few months. It seems that we are in the final part of this short-term decline, which is why I expect silver to catch up with mining stocks and decline quite substantially.
Congratulations on reaping great profits from the previous short position in the junior mining stocks! While juniors are likely to decline more, it seems to me that the profits that one could get from shorting silver right now are likely to be even bigger.
From the medium-term point of view, the key two long-term factors remain the analogy to 2013 in gold and the broad head and shoulders pattern in the HUI Index. They both suggest much lower prices ahead.
It seems that our profits from the short positions are going to become truly epic in the following months.
After the sell-off (that takes gold to about $1,350 - $1,500), I expect the precious metals to rally significantly. The final part of the decline might take as little as 1-5 weeks, so it's important to stay alert to any changes.
Most importantly, please stay healthy and safe. We made a lot of money last March and this March, and it seems that we’re about to make much more on the upcoming decline, but you have to be healthy to enjoy the results.
As always, we'll keep you - our subscribers - informed.
By the way, we’re currently providing you with the possibility to extend your subscription by a year, two years or even three years with a special 20% discount. This discount can be applied right away, without the need to wait for your next renewal – if you choose to secure your premium access and complete the payment upfront. The boring time in the PMs is definitely over, and the time to pay close attention to the market is here. Naturally, it’s your capital, and the choice is up to you, but it seems that it might be a good idea to secure more premium access now while saving 20% at the same time. Our support team will be happy to assist you in the above-described upgrade at preferential terms – if you’d like to proceed, please contact us.
To summarize:
Trading capital (supplementary part of the portfolio; our opinion): Full speculative short position (300% of the full position) in silver is justified from the risk to reward point of view with the following binding exit profit-take price levels:
Silver futures profit-take exit price: $19.12
SLV profit-take exit price: $17.72
ZSL profit-take exit price: $41.38
HZD.TO profit-take exit price: $31.98
OR if gold reaches $1,683 – in this case, I think that taking profits and closing the short position in silver (and related instruments) will be justified from the risk to reward point of view, regardless of silver’s price.
I don’t have a stop-loss level for this trade.
For-your-information targets (our opinion; we continue to think that mining stocks are the preferred way of taking advantage of the upcoming price move, but if for whatever reason one wants / has to use silver or gold for this trade, we are providing the details anyway.):
Gold futures downside profit-take exit price: $1,683
GDXJ: $35.73
JDST: $16.28
GDXD: $33.48
All mining-stock-related instruments: if gold reaches $1,683 or the GDXJ reaches $35.73 (whichever is reached first), I would exit all remaining short positions in any mining stock trading vehicles aimed at profiting from the declines in the mining stocks.
Long-term capital (core part of the portfolio; our opinion): No positions (in other words: cash
Insurance capital (core part of the portfolio; our opinion): Full position
Whether you already subscribed or not, we encourage you to find out how to make the most of our alerts and read our replies to the most common alert-and-gold-trading-related-questions.
Please note that we describe the situation for the day that the alert is posted in the trading section. In other words, if we are writing about a speculative position, it means that it is up-to-date on the day it was posted. We are also featuring the initial target prices to decide whether keeping a position on a given day is in tune with your approach (some moves are too small for medium-term traders, and some might appear too big for day-traders).
Additionally, you might want to read why our stop-loss orders are usually relatively far from the current price.
Please note that a full position doesn't mean using all of the capital for a given trade. You will find details on our thoughts on gold portfolio structuring in the Key Insights section on our website.
As a reminder - "initial target price" means exactly that - an "initial" one. It's not a price level at which we suggest closing positions. If this becomes the case (like it did in the previous trade), we will refer to these levels as levels of exit orders (exactly as we've done previously). Stop-loss levels, however, are naturally not "initial", but something that, in our opinion, might be entered as an order.
Since it is impossible to synchronize target prices and stop-loss levels for all the ETFs and ETNs with the main markets that we provide these levels for (gold, silver and mining stocks - the GDX ETF), the stop-loss levels and target prices for other ETNs and ETF (among other: UGL, GLL, AGQ, ZSL, NUGT, DUST, JNUG, JDST) are provided as supplementary, and not as "final". This means that if a stop-loss or a target level is reached for any of the "additional instruments" (GLL for instance), but not for the "main instrument" (gold in this case), we will view positions in both gold and GLL as still open and the stop-loss for GLL would have to be moved lower. On the other hand, if gold moves to a stop-loss level but GLL doesn't, then we will view both positions (in gold and GLL) as closed. In other words, since it's not possible to be 100% certain that each related instrument moves to a given level when the underlying instrument does, we can't provide levels that would be binding. The levels that we do provide are our best estimate of the levels that will correspond to the levels in the underlying assets, but it will be the underlying assets that one will need to focus on regarding the signs pointing to closing a given position or keeping it open. We might adjust the levels in the "additional instruments" without adjusting the levels in the "main instruments", which will simply mean that we have improved our estimation of these levels, not that we changed our outlook on the markets. We are already working on a tool that would update these levels daily for the most popular ETFs, ETNs and individual mining stocks.
Our preferred ways to invest in and to trade gold along with the reasoning can be found in the how to buy gold section. Furthermore, our preferred ETFs and ETNs can be found in our Gold & Silver ETF Ranking.
As a reminder, Gold & Silver Trading Alerts are posted before or on each trading day (we usually post them before the opening bell, but we don't promise doing that each day). If there's anything urgent, we will send you an additional small alert before posting the main one.
Thank you.
Przemyslaw Radomski, CFA
Founder, Editor-in-chief

