

Briefly: in our opinion, full (300% of the regular position size) speculative short positions in mining stocks are justified from the risk/reward point of view at the moment of publishing this Alert.
Gold’s rally days appear to be numbered based on its self-similar pattern, the situation in the USD Index, and given the weakness present in gold mining stocks.
¯\_(ツ)_/¯
The above is what you’ll get if you type /shrug in the Slack communicator. The above also represents gold miners’ reaction to the fact that gold rallied $11 yesterday. And this reaction is very important as it’s the cherry on the analytical cake baked using other signals that were available before yesterday’s session.
There are two major points that I would like to make today:
- Gold is moving almost exactly as it’s been moving between 2011 and mid-2013. The current moves are much faster but other than that, history appears to be repeating itself.
- The USD Index broke below its recent lows, and it seems ready to confirm this breakdown, which means that the proximity of the 90 level has just become a likely target.
Yesterday’s reaction in the gold miners serves as an excellent confirmation of what the above points imply. First things first, let’s take a look at gold.
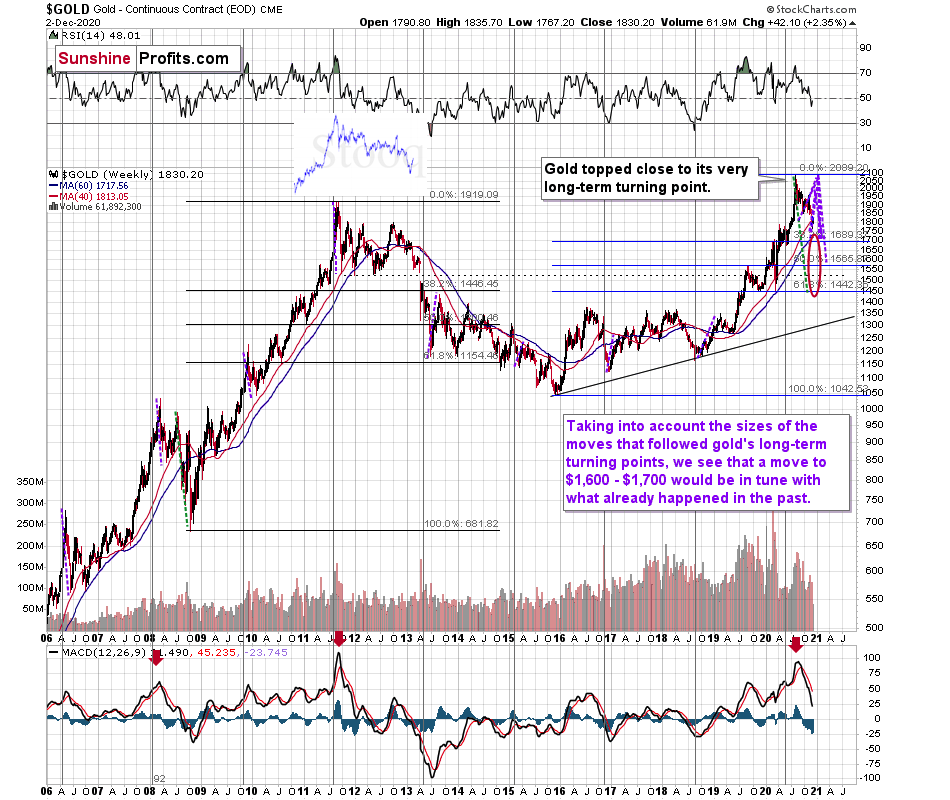
The odd thing about the chart is that I copied the most recent movement in gold and pasted it above gold’s 2011 – 2013 performance. But – admit it – at first glance, it was clear to you that both price moves were very similar.
And that’s exactly my point. The history tends to rhyme and that’s one of the foundations of the technical analysis in general. Retracements, indicators, cycles, and other techniques are used based on this very foundation – they are just different ways to approach the recurring nature of events.
However, every now and then, the history repeats itself to a much greater degree than is normally the case. In extremely rare cases, we get a direct 1:1 similarity, but in some (still rare, but not as extremely rare) cases we get a similarity where the price is moving proportionately to how it moved previously. That’s called a market’s self-similarity or the fractal nature of the markets. But after taking a brief look at the chart, you probably instinctively knew that since the price moves are so similar this time, then the follow-up action is also likely to be quite similar.
In other words, if something looks like a duck, and quacks like a duck, it’s probably a duck. And it’s likely to do what ducks do.
What did gold do back in 2013 at the end of the self-similar pattern? Saying that it declined is true, but it doesn’t give the full picture - just like saying that the U.S. public debt is not small. Back then, gold truly plunged. And before it plunged, it moved lower in a rather steady manner, with periodic corrections. That’s exactly what we see right now.
At the moment of writing these words (early on December 3), gold hasn’t moved back to its September lows, but it’s quite close to them. This level served as strong support previously, so it’s now likely to serve as strong resistance. This means that the corrective upswing is quite likely to be over rather soon.
Before moving to the second point, please note that the above chart shows gold’s very long-term turning points (vertical lines) and we see that gold topped a bit after it (not much off given their long-term nature). Based on how gold performed after previous long-term turning points (marked with purple, dashed lines), it seems that a decline to even $1,600 would not be out of ordinary.
Finally, please note the strong sell signal from the MACD indicator in the bottom part of the chart. The only other time when this indicator flashed a sell signal while being so overbought was at the 2011 top. The second most-similar case is the 2008 top.
The above-mentioned self-similarity covers the analogy to the 2011 top, but what about the 2008 performance?
If we take a look at how big the final 2008 decline was, we notice that if gold repeated it (percentage-wise), it would decline to about $1,450. Interestingly, this would mean that gold would move to the 61.8% Fibonacci retracement level based on the entire 2015 – 2020 rally. This is so interesting, because that’s the Fibonacci retracement level that (approximately) ended the 2013 decline.
History tends to rhyme, so perhaps gold is going to decline even more than the simple analogy to the previous turning points indicates. For now, this is relatively unclear, and my target area for gold’s final bottom is quite broad.
Moving to the second point, let’s take a look at the USD Index. After all, gold tends to make major moves when the USDX is also making major moves – and it tends to move in the opposite direction.
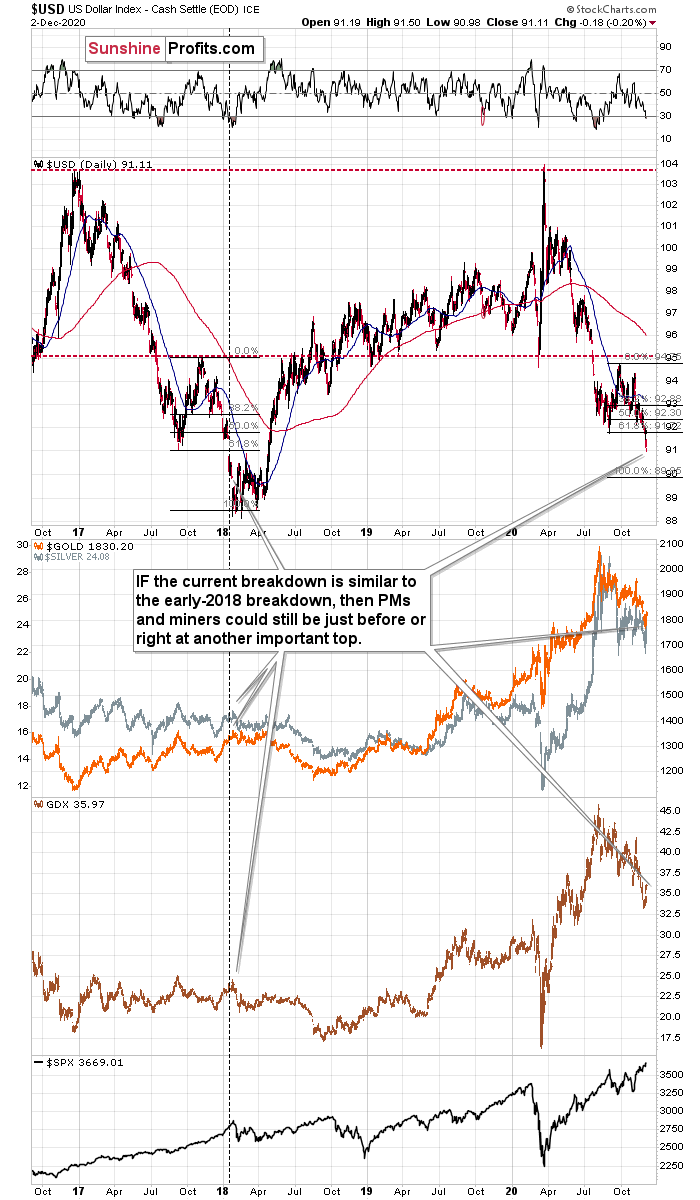
The USD Index broke below its previous 2020 lows and this breakdown is almost confirmed. However, since today’s pre-market low (at the moment of writing these words) is 90.78, it seems that the target for the bottom – the 90 level – is at hand. Therefore – and due to also another factor that I’ll discuss shortly – the implications for gold as not as bullish as they might seem at the first sight.
Why would the bottom in the USD Index form at about 90? Because this would be yet another way in which the history could rhyme. In case of the USD Index, we have more of a 1:1 repeat of what we already saw a few years earlier.
Namely, it appears that the USD Index is repeating its 2017 – 2018 decline to some extent. The starting points of the declines (horizontal red line) as well as the final high of the biggest correction are quite similar. The difference is that the recent correction was smaller than it was in 2017.
Since back in 2018, the USDX’s bottom was at about 1.618 Fibonacci extension of the size of the correction, we could expect something similar to happen this time. Applying the above to the current situation would give us the proximity of the 90 level as the downside target.
So, shouldn’t gold soar in this case? – would be a valid question to ask.
Well, if the early 2018 pattern was being repeated, then let’s check what happened to precious metals and gold stocks at that time.
In short, they moved just a little higher after the USDX’s breakdown. I marked the moment when the U.S. currency broke below its previous (2017) bottom with a vertical line, so that you can easily see what gold, silver, and GDX (proxy for mining stocks) were doing at that time. They were just before a major top. The bearish action that followed in the short term was particularly visible in the case of the miners.
Consequently, even if the USD Index is to decline further from here, then the implications are not particularly bullish for the precious metals market.
In fact, as the USD Index shows more weakness, gold might simply manage to rally back to its September lows ($1,851 in intraday terms, $1,866 in terms of the daily closing prices, or somewhere between them) and then slide once again. This would be in perfect tune with what happened in early 2018, and also what I discussed previously.
And now, finally, for the cherry on the analytical cake – yesterday’s weak performance of mining stocks.
Gold rallied $11 yesterday, so gold miners – whose profits depend on the price of gold – should have rallied as well.
At least this is what should have happened if the precious metals sector was truly in a bull mode. In the early parts of a rally miners lead gold, and right before (and at) tops, miners tend to lag behind gold or even decline despite gold’s rallies.
So, did miners rally as they should have?
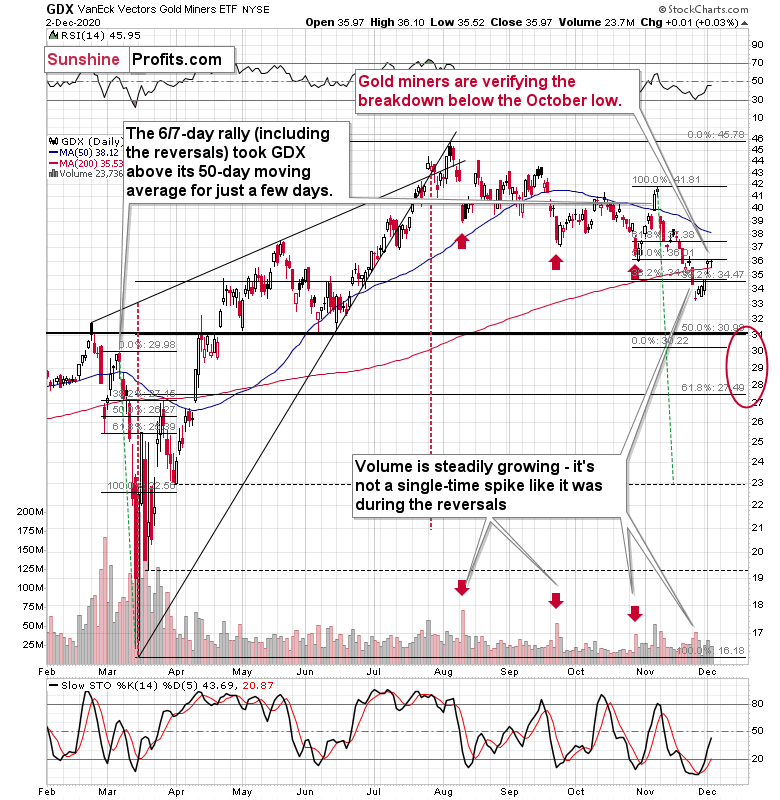
No! It’s true that they ended the session higher, but by a mere $0.01, which means that they were basically flat. Gold miners ignored gold’s rally, which tells us one major thing – the precious metals sector is not likely to rally after a major bottom; instead, it’s correcting after a bigger decline. This means that the next big move is likely to be to the downside, just like what the previous charts indicate.
Can miners move higher from here? Of course, they can, but this move is likely to be limited. While the USD Index could move to about 90, gold could move to about $1,851 - $1,866, and the GDX ETF could rally to $36.52 or so, which is the lowest daily close of October. In fact, miners could even correct to the mid-November high of about $38. Still, it’s likely that this would be just a very temporary phenomenon.
In other words, based on the analysis of gold’s self-similar patterns, the analogy present in the USD Index, and the recent (lack of) strength in the mining stocks, it seems that the additional decline in the USD Index would be likely to trigger the same kind of reaction in the gold mining stocks that we saw yesterday. However, it would likely be limited.
The outlook for the precious metals market remains bearish for the next few weeks. It might be tempting to jump on the bullish bandwagon based on the small rally that we just saw, but based on many factors, it seems that the medium-term trend remains down, and thus a different reaction would be justified toward this short-term upswing:
¯\_(ツ)_/¯
Summary
Summing up, the next big move lower in the precious metals market is definitely underway and it seems that it will take another 1-5 weeks (likely in mid-December or in its second half) before the decline ends. It seems that the part of the slide in gold that takes place below $1,700 is going to see a silver catching up with the decline in gold and miners. This week’s upswing seems to be a relatively normal bounce within a bigger decline.
Please note that even Warren Buffett is limiting his exposure to gold.
As the USD Index appears to have ended forming its broad bottom pattern, it’s likely to rally, causing gold to slide. At some point gold is likely to stop responding to dollar’s bearish indications, and based on the above analysis, it seems that we might expect this to take place in December.
Naturally, everyone's trading is their responsibility. But in our opinion, if there ever was a time to either enter a short position in the miners or increase its size if it was not already sizable, it's now. We made money on the March decline, and on the March rebound, with another massive slide already underway.
After the sell-off (that takes gold to about $1,700 or lower), we expect the precious metals to rally significantly. The final decline might take as little as 1-5 weeks, so it's important to stay alert to any changes.
Most importantly, please stay healthy and safe. We made a lot of money on the March decline and the subsequent rebound (its initial part) price moves (and we'll likely earn much more in the following weeks and months), but you have to be healthy to enjoy the results.
As always, we'll keep you - our subscribers - informed.
To summarize:
Trading capital (supplementary part of the portfolio; our opinion): Full speculative short positions (300% of the full position) in mining stocks is justified from the risk to reward point of view with the following binding exit profit-take price levels:
Senior mining stocks (price levels for the GDX ETF): binding profit-take exit price: $32.02; stop-loss: none (the volatility is too big to justify a SL order in case of this particular trade); binding profit-take level for the DUST ETF: $28.73; stop-loss for the DUST ETF: none (the volatility is too big to justify a SL order in case of this particular trade)
Junior mining stocks (price levels for the GDXJ ETF): binding profit-take exit price: $42.72; stop-loss: none (the volatility is too big to justify a SL order in case of this particular trade); binding profit-take level for the JDST ETF: $21.22; stop-loss for the JDST ETF: none (the volatility is too big to justify a SL order in case of this particular trade)
For-your-information targets (our opinion; we continue to think that mining stocks are the preferred way of taking advantage of the upcoming price move, but if for whatever reason one wants / has to use silver or gold for this trade, we are providing the details anyway. In our view, silver has greater potential than gold does):
Silver futures downside profit-take exit price: unclear at this time - initially, it might be a good idea to exit, when gold moves to $1,703.
Gold futures downside profit-take exit price: $1,703
Long-term capital (core part of the portfolio; our opinion): No positions (in other words: cash
Insurance capital (core part of the portfolio; our opinion): Full position
Whether you already subscribed or not, we encourage you to find out how to make the most of our alerts and read our replies to the most common alert-and-gold-trading-related-questions.
Please note that we describe the situation for the day that the alert is posted in the trading section. In other words, if we are writing about a speculative position, it means that it is up-to-date on the day it was posted. We are also featuring the initial target prices to decide whether keeping a position on a given day is in tune with your approach (some moves are too small for medium-term traders, and some might appear too big for day-traders).
Additionally, you might want to read why our stop-loss orders are usually relatively far from the current price.
Please note that a full position doesn't mean using all of the capital for a given trade. You will find details on our thoughts on gold portfolio structuring in the Key Insights section on our website.
As a reminder - "initial target price" means exactly that - an "initial" one. It's not a price level at which we suggest closing positions. If this becomes the case (like it did in the previous trade), we will refer to these levels as levels of exit orders (exactly as we've done previously). Stop-loss levels, however, are naturally not "initial", but something that, in our opinion, might be entered as an order.
Since it is impossible to synchronize target prices and stop-loss levels for all the ETFs and ETNs with the main markets that we provide these levels for (gold, silver and mining stocks - the GDX ETF), the stop-loss levels and target prices for other ETNs and ETF (among other: UGL, GLL, AGQ, ZSL, NUGT, DUST, JNUG, JDST) are provided as supplementary, and not as "final". This means that if a stop-loss or a target level is reached for any of the "additional instruments" (GLL for instance), but not for the "main instrument" (gold in this case), we will view positions in both gold and GLL as still open and the stop-loss for GLL would have to be moved lower. On the other hand, if gold moves to a stop-loss level but GLL doesn't, then we will view both positions (in gold and GLL) as closed. In other words, since it's not possible to be 100% certain that each related instrument moves to a given level when the underlying instrument does, we can't provide levels that would be binding. The levels that we do provide are our best estimate of the levels that will correspond to the levels in the underlying assets, but it will be the underlying assets that one will need to focus on regarding the signs pointing to closing a given position or keeping it open. We might adjust the levels in the "additional instruments" without adjusting the levels in the "main instruments", which will simply mean that we have improved our estimation of these levels, not that we changed our outlook on the markets. We are already working on a tool that would update these levels daily for the most popular ETFs, ETNs and individual mining stocks.
Our preferred ways to invest in and to trade gold along with the reasoning can be found in the how to buy gold section. Furthermore, our preferred ETFs and ETNs can be found in our Gold & Silver ETF Ranking.
As a reminder, Gold & Silver Trading Alerts are posted before or on each trading day (we usually post them before the opening bell, but we don't promise doing that each day). If there's anything urgent, we will send you an additional small alert before posting the main one.
Thank you.
Przemyslaw Radomski, CFA
Founder, Editor-in-chief

