

Briefly: In our opinion, full (150% of the regular full position) speculative short positions in gold, silver and mining stocks are justified from the risk/reward perspective at the moment of publishing this alert.
While the precious metals traders may have complained about the lack of action in the previous week, what we just saw suggests that this week will be anything but boring as, based on the volume reading, it seems that Friday’s session was the most important session of this year.
Let’s jump right into the charts for details (chart courtesy of http://stockcharts.com).
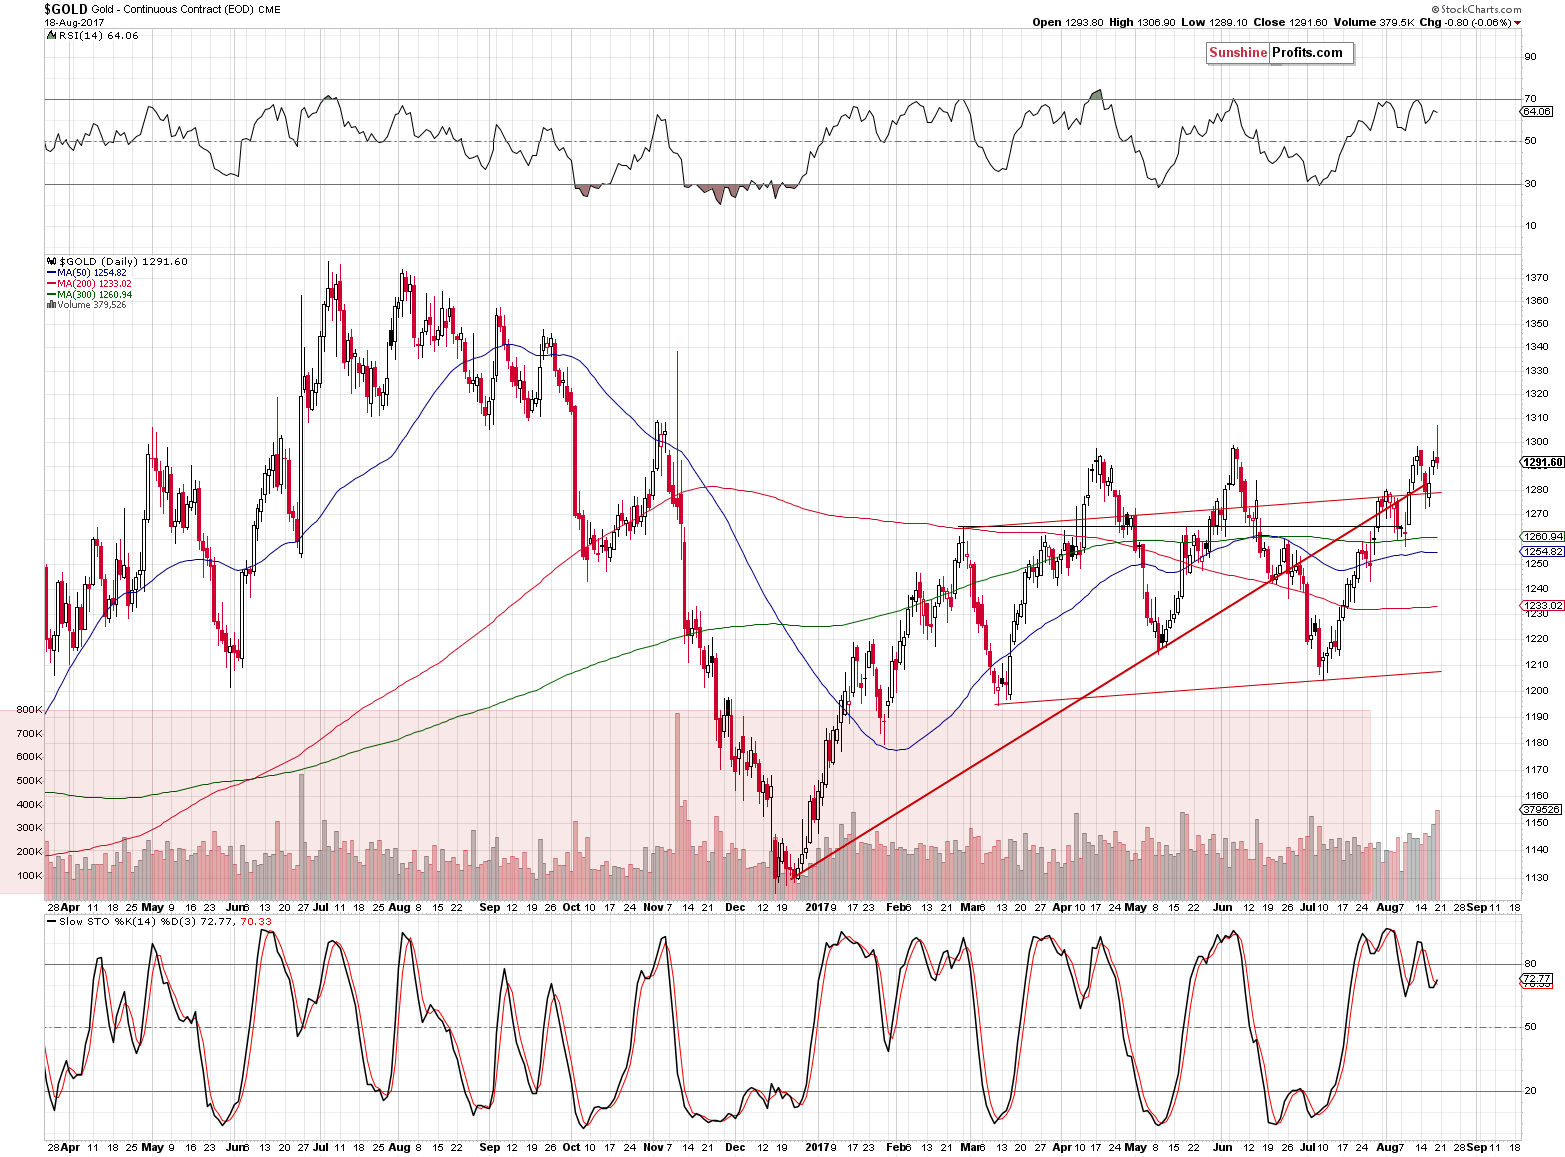
On Friday, gold showed strength initially rising above the April and June highs only to reverse the entire move and close the entire session lower. The size of the intra-day move was not small – it was a$15+ rally that was erased and it was accompanied by high volume. In fact, it was the highest volume reading that we’ve seen since November 2016 and one can say that because of that it was the most important session of this year.
There can be various reasons for a price to move back down despite an initial upswing, for instance that it’s simply taking a breather, however, the very high volume means that in all likelihood the reason for the move back down was that sellers had more strength than buyers. Why is the reason behind a move lower important? Because of the implications for the following days (and – in this case - weeks). If it had been a breather, a rally would be likely to follow as that was the previous short-term trend. However, it was a major reversal and it seems that the buyers don’t have enough strength to keep pushing the price of the yellow metal higher – despite a move lower in the USD and despite the nuclear tensions regarding North Korea.
This is a very strong sign that lower prices are very likely to be seen in the near future and possibly also in the following weeks and months. Did the highest-volume session mark the start of the final slide in gold? That’s quite possible.
It wasn’t just gold that invalidated a small breakout above its previous highs and ended the session lower. We saw the same thing in silver and mining stocks.
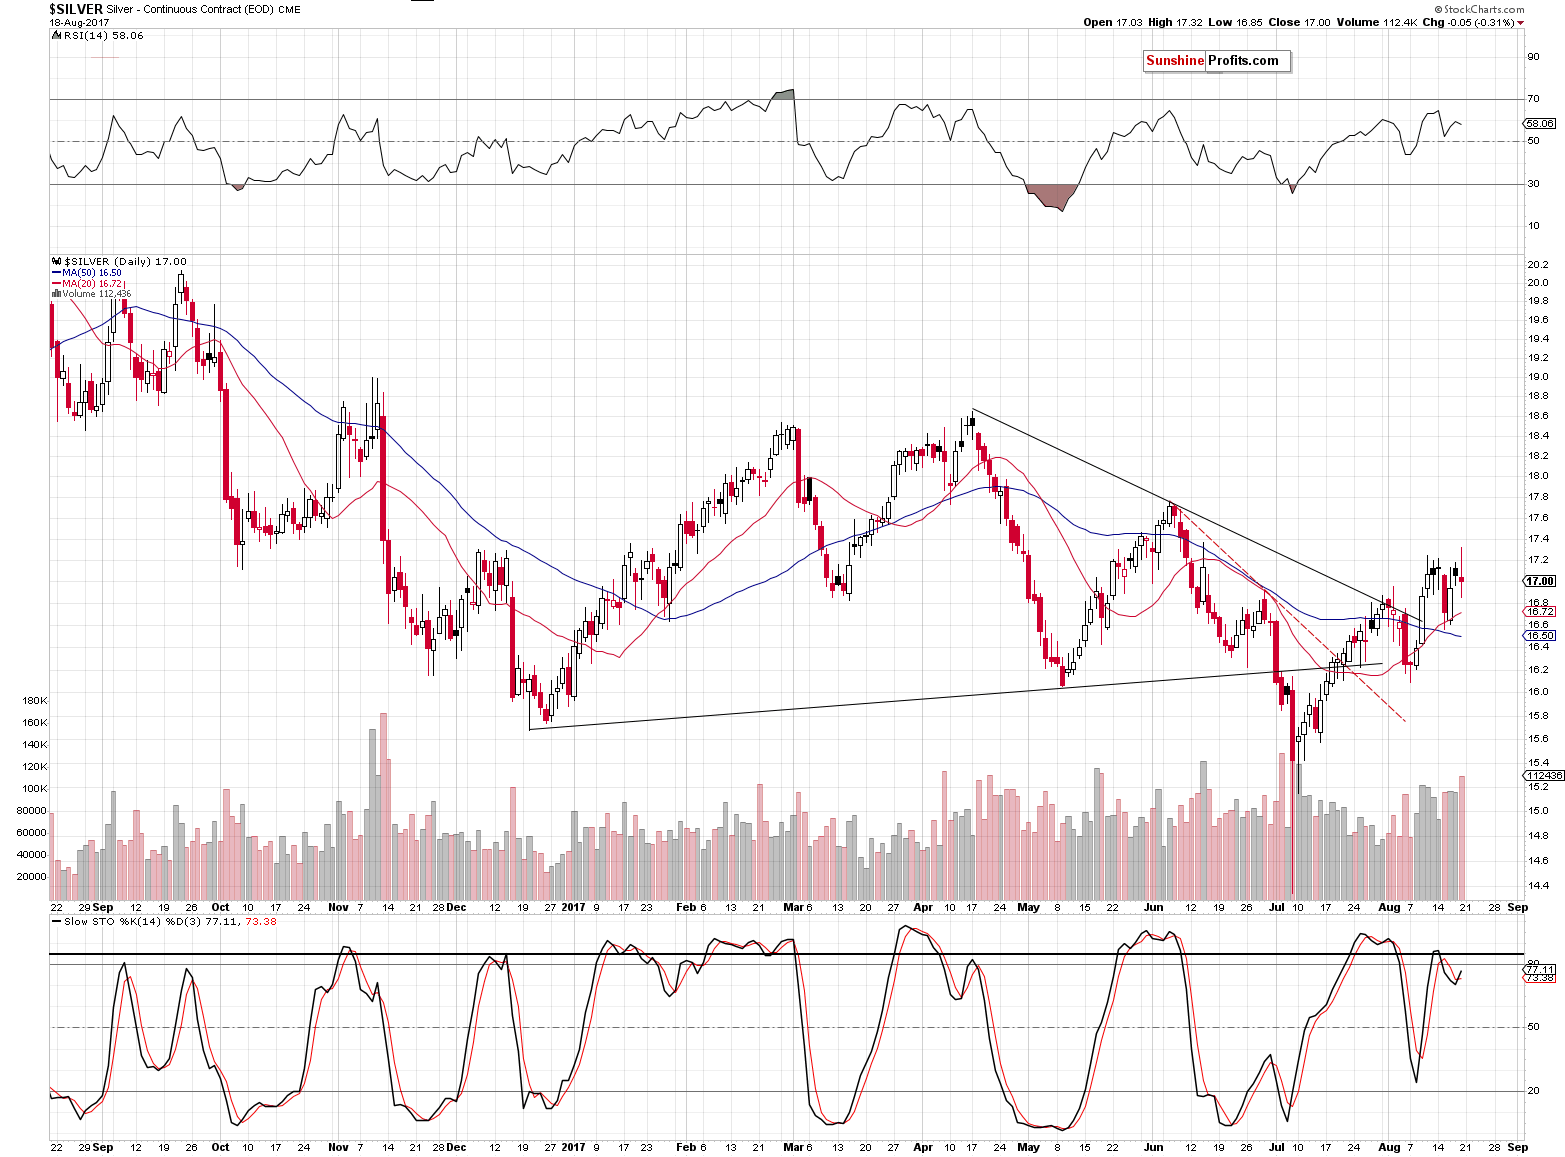
In the case of silver, the size of the volume was not as epic as it was in gold, but it was big enough to justify a reversal and confirm the one in gold. Silver may not appear to be at an important starting point for a big decline on the above chart, but looking at it from a bigger perspective suggests just that.
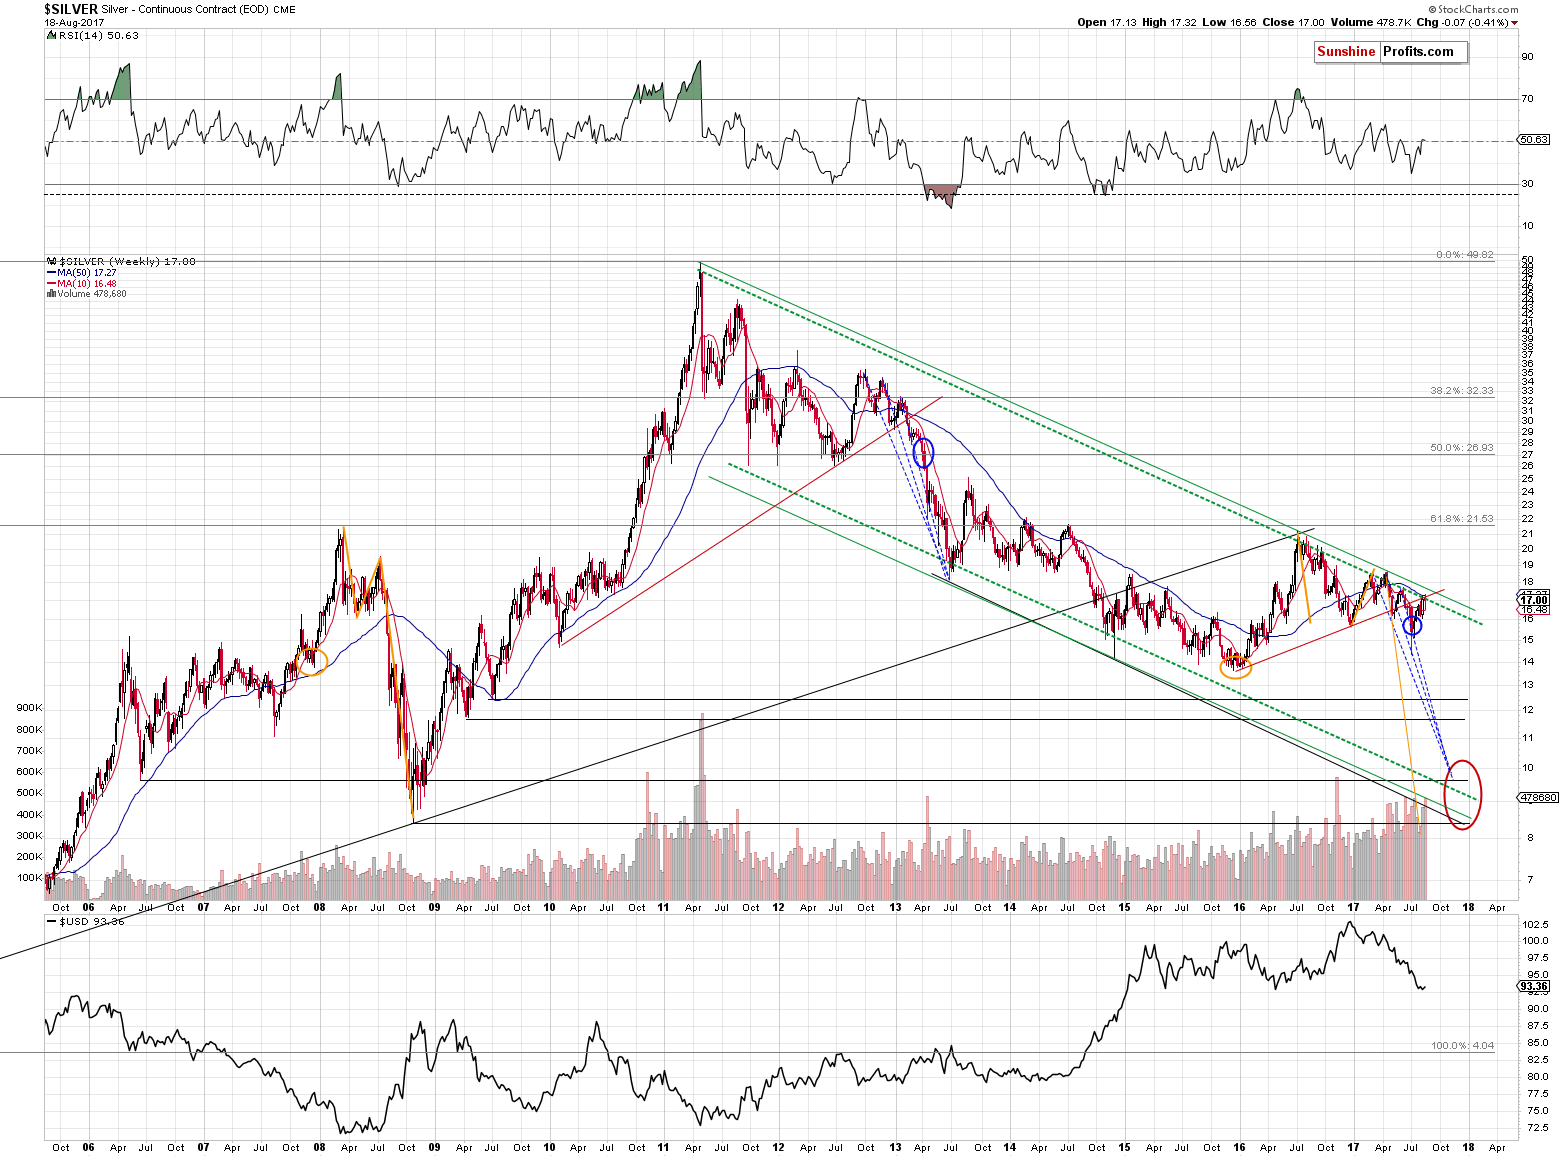
Silver has been trading more or less at the intersection of several very important resistance levels for several days and it seems that Friday’s – failed - attempt to move above them was the final one. The proximity of these resistance lines make the current price level a believable starting point for a big slide – after all, the entire recent rally could be viewed as a verification of the breakdown below the rising red support line.
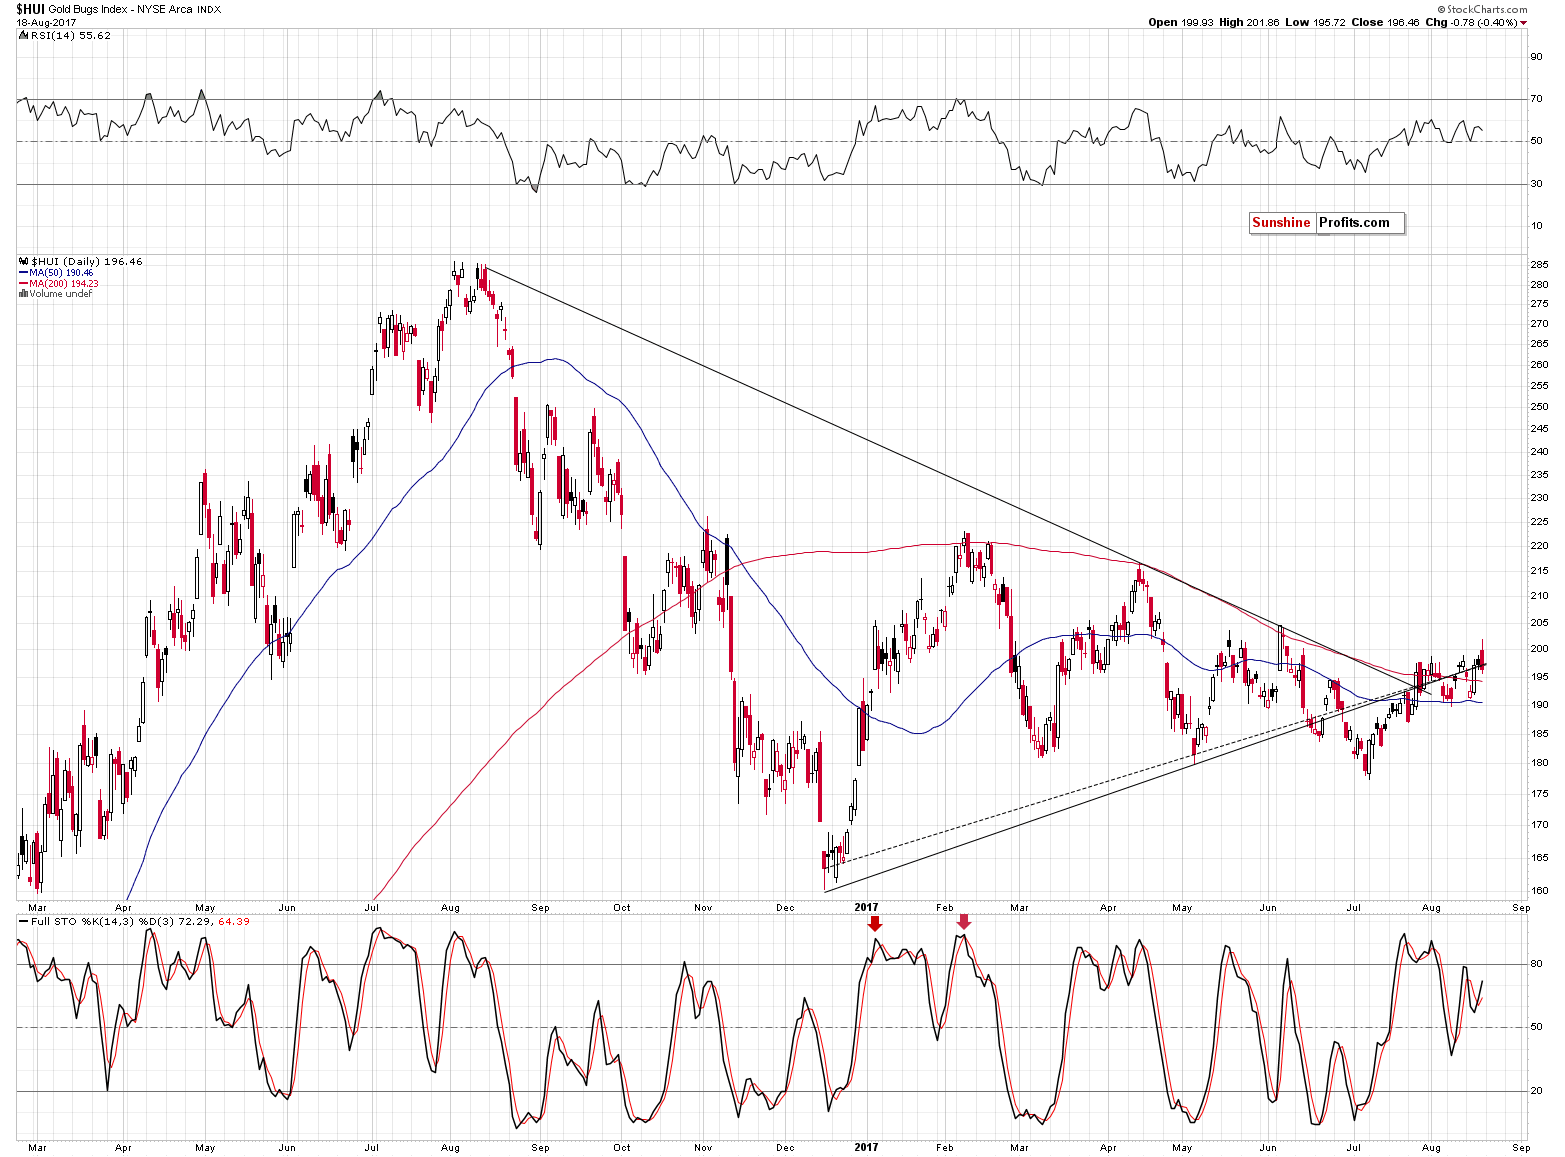
Gold stocks moved sharply higher and then sharply lower, just as gold did. The reversal is not as visible only because the gold miners started the session higher, however, the implications are the same. The reversal was still significant and gold stocks still ended the session lower, despite an attempt to move above the previous highs and the psychologically-important 200 level. What are the implications? Naturally, they are bearish as the action in miners and silver confirms that extremely important reversal in gold.
The most interesting part of the reversal is that it all happened without the USD’s help. The USD Index ended Friday’s session a bit lower, so precious metals had a good reason to rally at least a little – and the opposite happened.
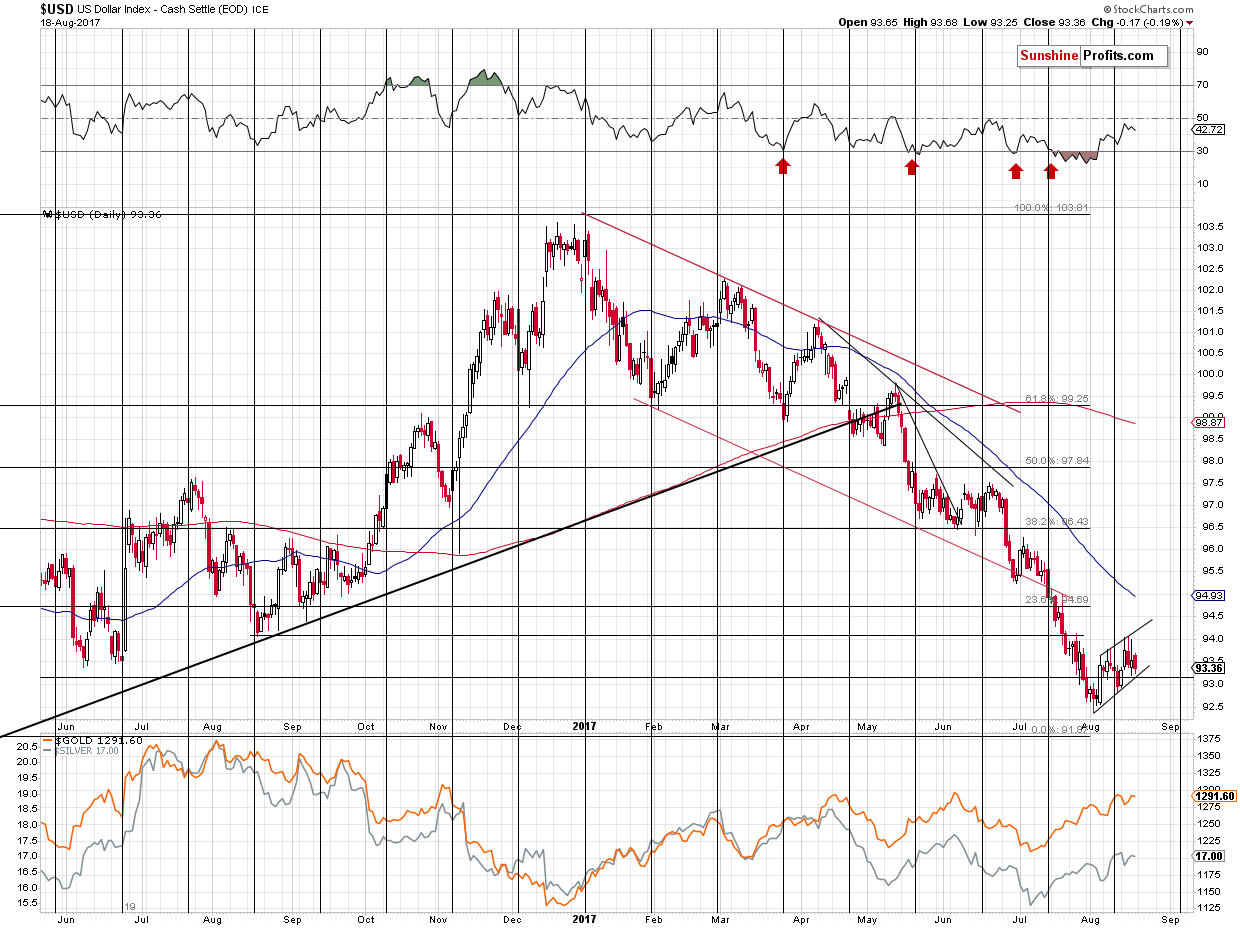
We previously wrote about the USD’s flag pattern and the likely assumption by most traders that the USD would break below and trigger another powerful slide and these comments remain up-to-date and so do the implications:
Since people are not taking the USD rally seriously yet, they are not reacting to it in a normal way. Still, if the USD rally continues (it is likely to continue based on the weekly reversal that we saw at the beginning of this month) and it becomes obvious that this upswing is something more than just a correction within a decline, traders are likely to catch up with their reaction – and precious metals are likely to catch up with their declines.
The USD Index is currently in a flag pattern, which is usually a sign of a continuation of the previous trend. Based on the recent weekly reversal this is not likely to be the case, but it seems natural for traders to assume that. The sell signal would come after a breakdown below the flag, close to the 93.2 level. Consequently, it’s no wonder that traders react when the USD gets closer to this level – something that happened also in today’s pre-market trading.
Will the USD Index break lower? Naturally, all is possible, but the decline that we’ve seen this year already made it extremely oversold and since it already reversed (weekly reversals are generally more important than daily ones) after reaching a very important weekly support, the odds are that the bottom is indeed in. What does that mean for the gold market? That the strength is temporary and short-term.
There is also the possibility that the market will need to move even higher before it starts to slide (given a confirmed breakout above the April and June highs), but that doesn’t appear likely.
The USD Index moved to the lower border of the flag pattern in today’s pre-market trading and once again PMs reacted by moving higher, however, this time, the strength of the move is very limited. It seems that the buying power and bulls’ willingness to continue purchasing at these prices dried up on Friday.
Summing up, Friday’s session in gold seems to be the most important session of 2017 as confirmed by the size of the volume and since this volume accompanied a clear and significant reversal, the implications are very bearish for short and medium term. The reversal was also seen in the case of silver and mining stocks, which further confirms the bearishness of the signal from gold. All in all, short positions in the precious metals sector seem to be well justified at this time. It’s likely that we won’t have to wait much longer for the final downswing and THE bottom.
As always, we will keep you – our subscribers – informed.
To summarize:
Trading capital (supplementary part of the portfolio; our opinion): Short positions (150% of the full position) in gold, silver and mining stocks are justified from the risk/reward perspective with the following stop-loss orders and initial target price levels / profit-take orders:
- Gold: initial target price level: $1,063; stop-loss: $1,317; initial target price for the DGLD ETN: $81.88; stop-loss for the DGLD ETN $41.88
- Silver: initial target price: $13.12; stop-loss: $19.22; initial target price for the DSLV ETN: $46.18; stop-loss for the DSLV ETN $17.93
- Mining stocks (price levels for the GDX ETF): initial target price: $9.34; stop-loss: $26.34; initial target price for the DUST ETF: $143.56; stop-loss for the DUST ETF $21.37
In case one wants to bet on junior mining stocks' prices (we do not suggest doing so – we think senior mining stocks are more predictable in the case of short-term trades – if one wants to do it anyway, we provide the details), here are the stop-loss details and initial target prices:
- GDXJ ETF: initial target price: $14.13; stop-loss: $45.31
- JDST ETF: initial target price: $417.04; stop-loss: $43.12
Long-term capital (core part of the portfolio; our opinion): No positions (in other words: cash)
Insurance capital (core part of the portfolio; our opinion): Full position
Important Details for New Subscribers
Whether you already subscribed or not, we encourage you to find out how to make the most of our alerts and read our replies to the most common alert-and-gold-trading-related-questions.
Please note that the in the trading section we describe the situation for the day that the alert is posted. In other words, it we are writing about a speculative position, it means that it is up-to-date on the day it was posted. We are also featuring the initial target prices, so that you can decide whether keeping a position on a given day is something that is in tune with your approach (some moves are too small for medium-term traders and some might appear too big for day-traders).
Plus, you might want to read why our stop-loss orders are usually relatively far from the current price.
Please note that a full position doesn’t mean using all of the capital for a given trade. You will find details on our thoughts on gold portfolio structuring in the Key Insights section on our website.
As a reminder – “initial target price” means exactly that – an “initial” one, it’s not a price level at which we suggest closing positions. If this becomes the case (like it did in the previous trade) we will refer to these levels as levels of exit orders (exactly as we’ve done previously). Stop-loss levels, however, are naturally not “initial”, but something that, in our opinion, might be entered as an order.
Since it is impossible to synchronize target prices and stop-loss levels for all the ETFs and ETNs with the main markets that we provide these levels for (gold, silver and mining stocks – the GDX ETF), the stop-loss levels and target prices for other ETNs and ETF (among other: UGLD, DGLD, USLV, DSLV, NUGT, DUST, JNUG, JDST) are provided as supplementary, and not as “final”. This means that if a stop-loss or a target level is reached for any of the “additional instruments” (DGLD for instance), but not for the “main instrument” (gold in this case), we will view positions in both gold and DGLD as still open and the stop-loss for DGLD would have to be moved lower. On the other hand, if gold moves to a stop-loss level but DGLD doesn’t, then we will view both positions (in gold and DGLD) as closed. In other words, since it’s not possible to be 100% certain that each related instrument moves to a given level when the underlying instrument does, we can’t provide levels that would be binding. The levels that we do provide are our best estimate of the levels that will correspond to the levels in the underlying assets, but it will be the underlying assets that one will need to focus on regarding the signs pointing to closing a given position or keeping it open. We might adjust the levels in the “additional instruments” without adjusting the levels in the “main instruments”, which will simply mean that we have improved our estimation of these levels, not that we changed our outlook on the markets. We are already working on a tool that would update these levels on a daily basis for the most popular ETFs, ETNs and individual mining stocks.
Our preferred ways to invest in and to trade gold along with the reasoning can be found in the how to buy gold section. Additionally, our preferred ETFs and ETNs can be found in our Gold & Silver ETF Ranking.
As a reminder, Gold & Silver Trading Alerts are posted before or on each trading day (we usually post them before the opening bell, but we don't promise doing that each day). If there's anything urgent, we will send you an additional small alert before posting the main one.
=====
Latest Free Trading Alerts:
Last week, a few important U.S. economic reports (including retail sales) were released. What do they imply for the gold market?
July Retail Sales, Other Data and Gold
S&P 500 index lost 0.2% on Friday, as it extended its short-term downtrend. Will it continue lower? Or is this some bottoming pattern before some upward reversal? Is holding medium-term short position still justified?
Mixed Expectations Following Last Week's S&P 500 Sell-Off
=====
Hand-picked precious-metals-related links:
Gold trades little changed as investors focus on geopolitics, central bank meet
Gold Speculators Keep Ramping Up Of Bullish Net Positions For 4th Week
A Cosmic Theory and 2-Inch Lump of Gold Spur 500% Novo Surge
=====
In other news:
Yellen, Draghi Head to Jackson Hole Amid Inflation Unease
Global investors look to Jackson Hole for signs of how QE will end
Unintended Consequences of MiFID: Job Losses, Trading Turmoil?
Diesel scandal is a risk to German economy, says ministry
Fed's Big Bond Unwind May Clobber U.S. Stocks, Corporate Debt
Bitcoin Analysts Compete for Highest Forecast as Profile Grows
=====
Thank you.
Sincerely,
Przemyslaw Radomski, CFA
Founder, Editor-in-chief, Gold & Silver Fund Manager
Gold & Silver Trading Alerts
Forex Trading Alerts
Oil Investment Updates
Oil Trading Alerts

