Briefly: in our opinion, full (300% of the regular position size) speculative short positions in mining stocks are justified from the risk/reward point of view at the moment of publishing this Alert.
Yesterday, I commented heavily on one of the factors that’s likely to impact the PMs (specifically, silver and mining stocks) in the future – stocks, and in particular, the NASDAQ. In today’s analysis, I’d like to get back to the core and talk more about the key precious metal – gold.
There is little to talk about with regard to gold’s short-term price action that I hadn’t written before, as the yellow metal continues to trade sideways.
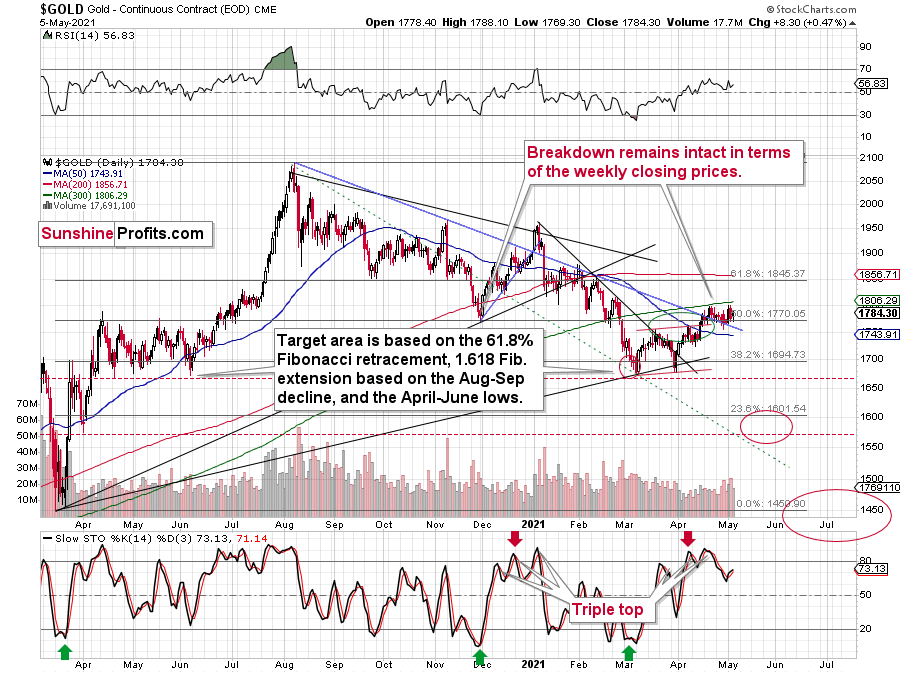
We saw a triple top pattern in the Stochastic indicator, we had gold reach the $1,800 level (psychologically important resistance) and it had also (almost) reached its 300-day moving average. On top of that, gold tried to break above its November 2020 low, and it failed. Gold’s declines in the recent days were accompanied by volume that was higher than the volume on which it rallied during the day. These are all bearish signs.
So, why does gold trade sideways instead of declining or rallying? It seems to me that a likely reason is that gold investors and traders remain skeptical about USD Index’s recovery.
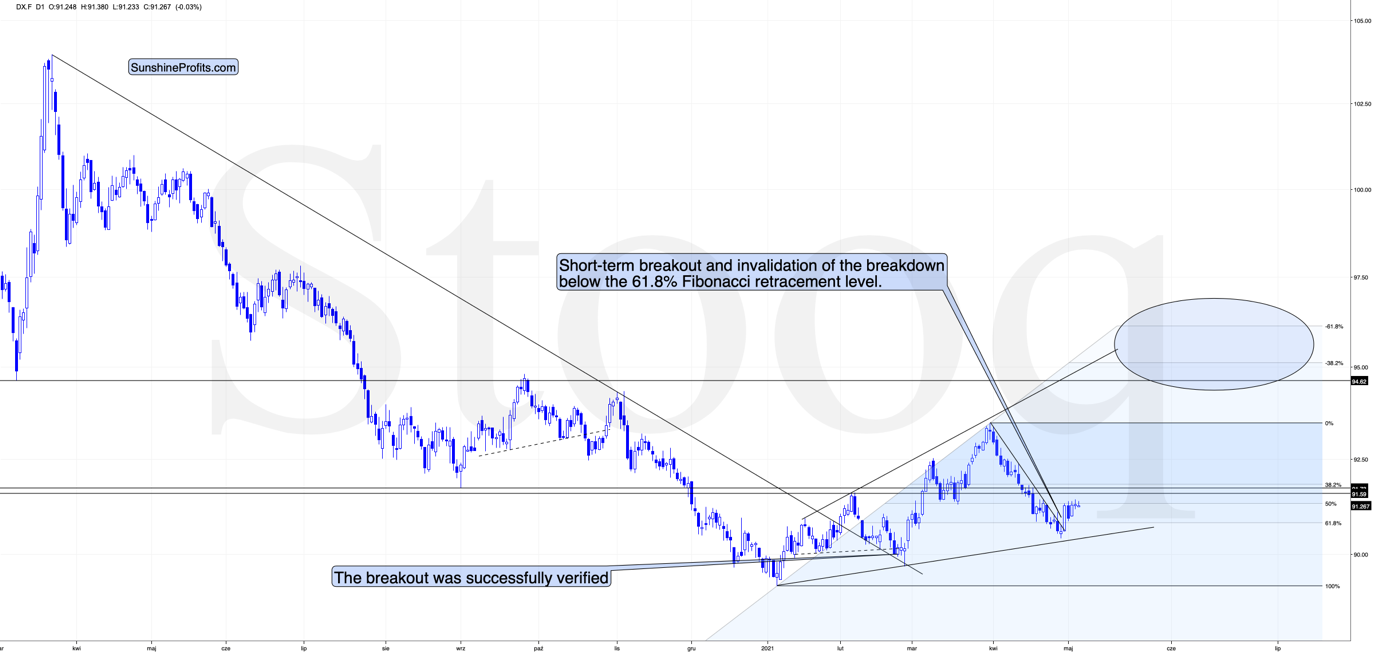
Yes, the USD Index soared on Friday, Apr. 30, and based on that it invalidated the breakdown below the 61.8% Fibonacci retracement level. It also broke above its declining resistance line, but it’s been trading sideways since that time. The rally didn’t continue, which likely makes traders question its validity.
What is really happening here is that the USD Index has been verifying the breakout – and it managed to do so. Consequently, the situation is bullish for the next several weeks (even if we see a very short-term move to somewhere around the recent lows).
This, in turn, means that gold is likely to fall in the following weeks (not necessarily in terms of days, though).
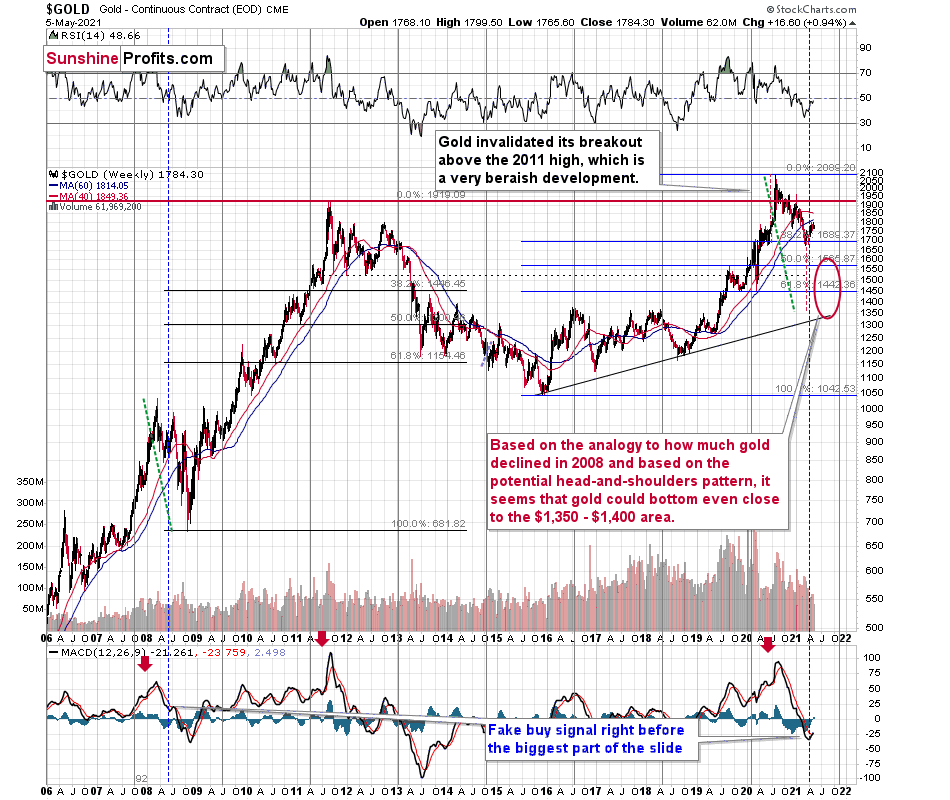
Gold’s long-term chart continues to point to lower gold prices ahead as well. Based on the shape of the movements and the values in the MACD indicator, it’s clear that the 2020 rally and the subsequent decline are similar to two cases from the past – the 2008 top and the subsequent decline, and the 2011 top and the subsequent decline.
Back in 2008, gold continued to fall until it more than doubled its initial decline – I copied its entire decrease to the current situation (the green, dashed line).
Back in 2012-2013, gold also continued to slide until it more than doubled its initial decline. In the current situation it’s not 100% clear what is gold’s “initial decline”, but since it seems that we’re about to see a broad head-and-shoulders pattern, it seems that we could count on gold reaching the target based on it. Interestingly, this would imply doubling the size of the 2020 top – March 2021 bottom decline. Consequently, it would be more or less in tune with the analogy to 2011 – 2013.
Moreover, gold has broken below both: 40- and 60-week moving averages (marked with blue and red, respectively), just like it did right before the 2013 slide. This is an important detail to note, especially given gold’s volatility in recent months.
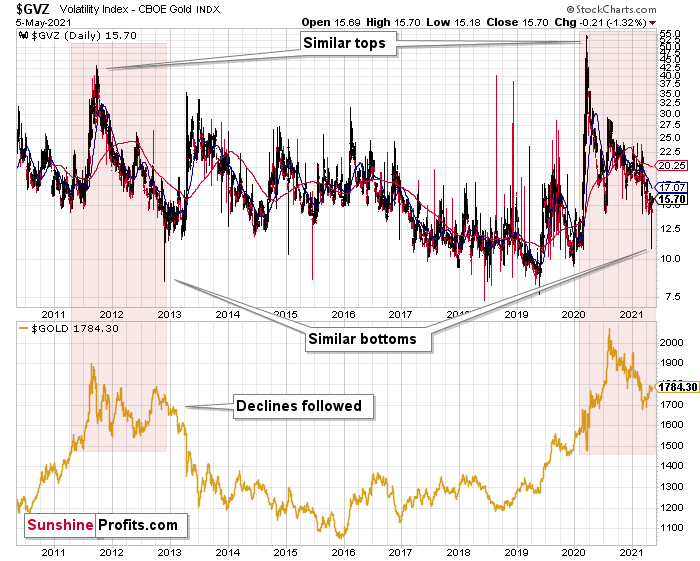
There were only two massive spikes in gold’s volatility, and that was in 2011 and 2020. Consequently, since history repeats itself, one might expect that something similar would happen after both tops. And indeed, something similar has happened.
Gold declined, moved back and forth on a month-to-month basis, and finished its last corrective upswing when the volatility index declined below its previous lows with a spike low. In both cases, gold’s volatility corrected back above its moving averages in the early part of its decline.
If history indeed rhymes, then we are currently in the part where the decline accelerates and gold slides the most.
I’ve previously written about seeing gold’s strength relative to the USD Index as a confirmation that the bottom in gold is in, and a big spike in volatility (this time during the decline) could be used as another confirmation.
All in all, the outlook for gold for the following weeks and months remains very bearish, while the outlook for the next several days is relatively unclear.
Having said that, let’s take a look at the markets from a more fundamental angle.
Sailing Toward the Iceberg
With the PMs becoming an ocean of optimistic and pessimistic mood swings, their daily waves have disguised a storm surge that’s building off in the distance. With inflation soaring and one policy error liable to capsize their entire vessel, precious metals investors are blindly sailing toward an iceberg.
Case in point: while market participants believe that the U.S. Federal Reserve (FED) has the ability to control interest rates, its powers are actually extremely limited. And with the FED’s bark much more vicious than its bite, the central bank has a monopoly on the ‘confidence’ market, not the bond market. Translation? As long as investors believe in the FED’s narrative, the ‘confidence’ filters across financial markets and allows asset prices to reflect the FED’s wishes. However, as history has shown, if that confidence erodes, all bets are off.
On Apr. 30, I warned that inflationary pressures could force the FED to raise interest rates much sooner than expected.
I wrote:
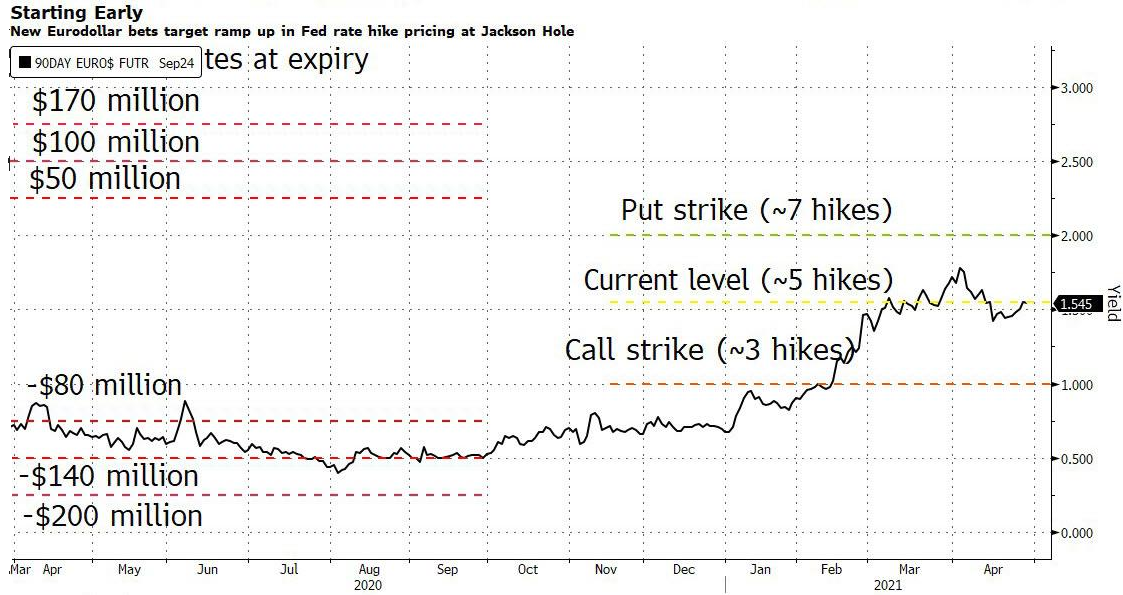
A material Eurodollar options position signals that a hawkish shift could occur by late August. With the options bet expiring on Sep. 10 – right before the FED’s Sep. 22 policy meeting – the date is rather peculiar. But with the FED’s annual Jackson Hole Symposium held in late August – where Powell unveiled a new policy framework for inflation in 2020 and then-FED Chair Ben Bernanke teased more bond purchases in 2012 – this year’s event could result in similar fireworks.
Please see below:
To explain, Eurodollar futures and options are used to speculate on short-term interest rates. More specifically, the contract reflects the implied 3-month U.S. dollar LIBOR (London Interbank Offered Rate). And with Eurodollar futures currently implying roughly five rate hikes by the FED by Mar. 2024 (contract settled at 98.7700 on Apr. 29), the large trader bought Eurodollar put options that imply roughly seven rate hikes by the FED by 2024. As a result, the "extremely high conviction" trade could be a $60 million windfall if Eurodollar futures fall sharply by Sept. 10.
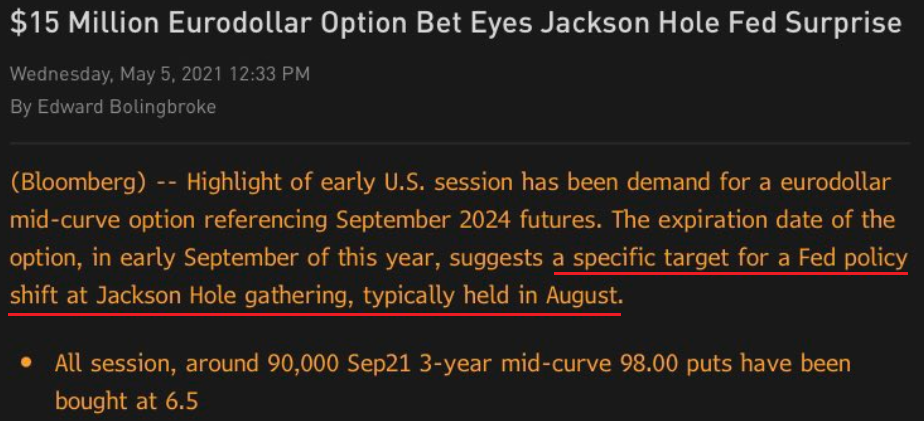
And with ‘confidence’ beginning to crumble, another 90,000 Eurodollar put options were purchased on May 5, mirroring the 200,000 put-option position that was opened last week. Thus, while a bevy of FED speakers reaffirmed their commitment to quantitative easing (QE) on May 5, investors suddenly aren’t so sure.
Please see below:
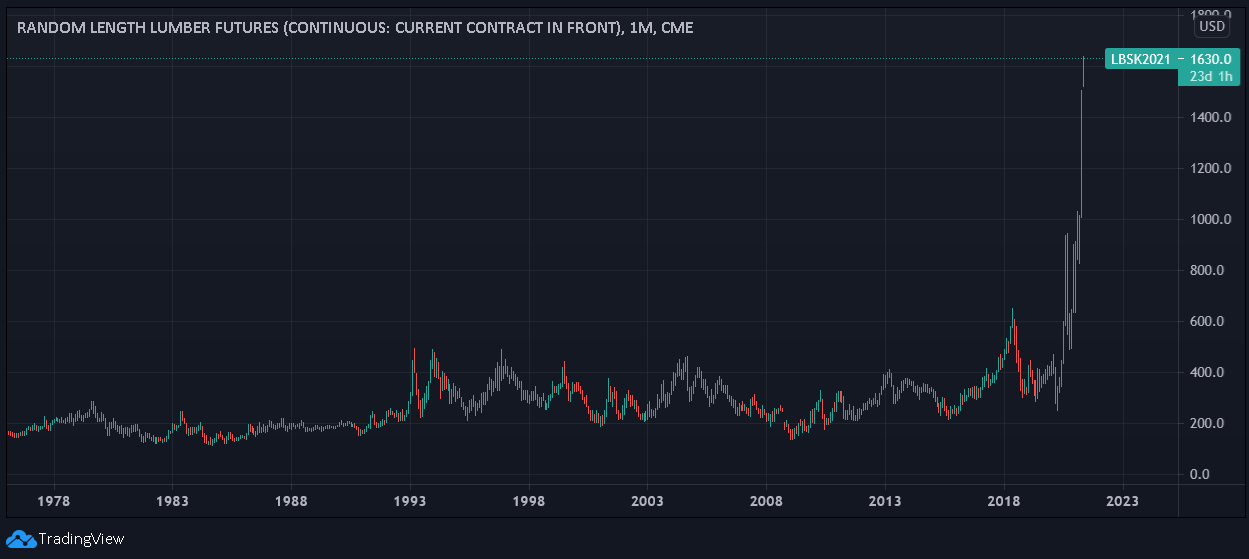
Hiding in plain sight, cost-push inflation continues to skyrocket. And with speculation in the commodities market showing no signs of slowing down, lumber futures have already surged by nearly 9% this week.
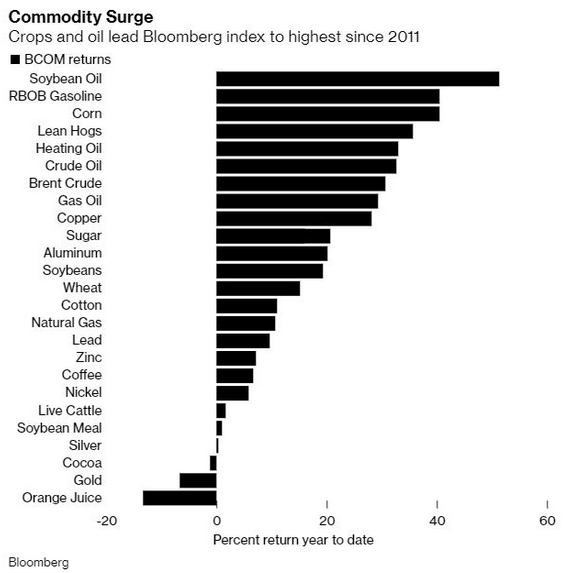
In addition, it’s not only lumber that’s sounding the alarm. While gold has been the second-worst performing commodity year-to-date (YTD), basic necessities like heating oil and pork products have been on a tear since New Year’s Day.
Please see below:
More importantly, though, once the effects of rampant commodity speculation have time to filter through the real economy, the FED’s promise of “transitory” inflation will likely lose credibility.
Bank of America Knows Something
We Don’t
If that wasn’t enough, the Institute for Supply Management (ISM) released its services PMI on May 5th. And in what’s become a recurring theme, the report read:
“The Prices Index figure of 76.8 percent is 2.8 percentage points higher than the March reading of 74 percent, indicating that prices increased in April, and at a faster rate. This is the index's highest reading since it reached 77.4 percent in July 2008 ….All 18 services industries reported an increase in prices paid during the month of April.”
For context, the ISM requires written permission before redistributing any of its content, and that’s why I quoted the findings rather than included a screenshot of the report. However, if you want to review the source material, you can find it here.
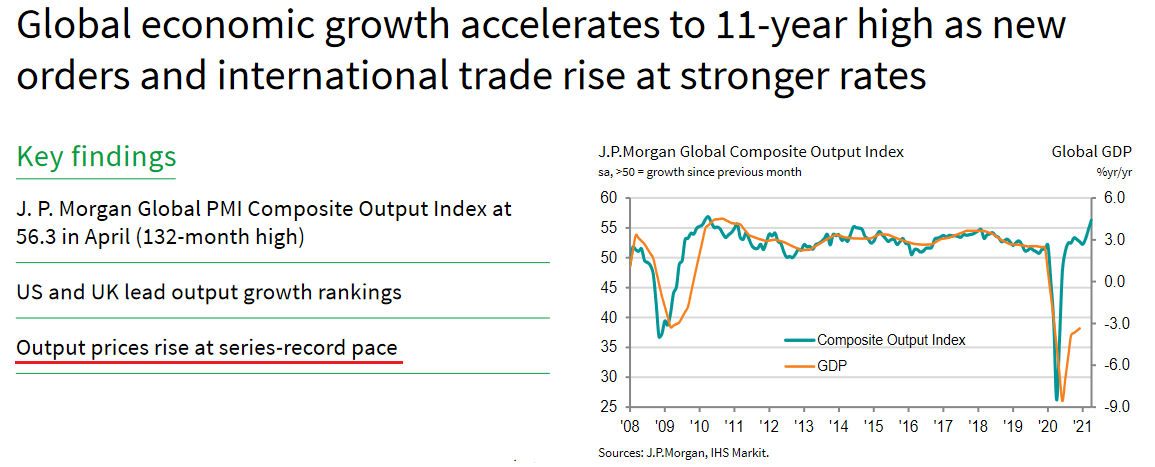
Continuing the theme, the J.P. Morgan Global Composite Output Index (also released on May 5) rose to its highest level (56.3) in 132 months. For context, the survey tallies responses from roughly 27,000 companies in more than 40 countries that account for roughly 89% of global GDP.
Please see below:
More importantly, though, rising commodity costs have already caused output inflation to surge at its fastest pace ever.
 Sources: J.P.Morgan, IHS Markit
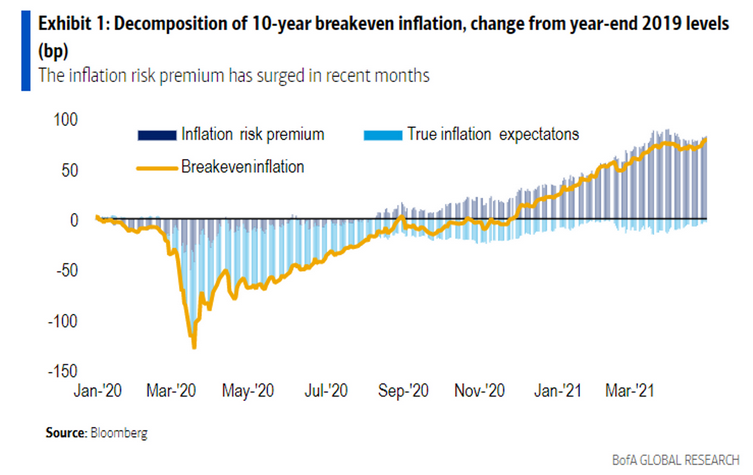
What’s more, Bank of America revealed on May 5th that investors have become increasingly skittish about rising inflation. Case in point: while the inflation risk premium has surged in recent months, we haven’t even scratched the surface of what’s likely to occur once coronavirus restrictions are lifted. And with investors already demanding increased compensation to weather the current storm, more bouts of volatility are likely to erupt over the medium term.
Please see below:
To explain, the dark blue bars above (they look gray) track the inflation risk premium. For context, the inflation risk premium represents the additional compensation that investors demand in order to hold assets that are negatively impacted by rising inflation (like long-term bonds and technology stocks). If you analyze the right side of the chart, you can see that investors have already started to doubt the FED’s ability to control the situation. More importantly, though, with Bank of America recommending that investors “shorten duration” – which is finance vernacular for “don’t own long-term bonds or technology stocks” – it’s only a matter of time before we witness another yield spike.
 Source: Bank of America/MarketWatch
Likewise, J.P. Morgan is also singing a similar tune:
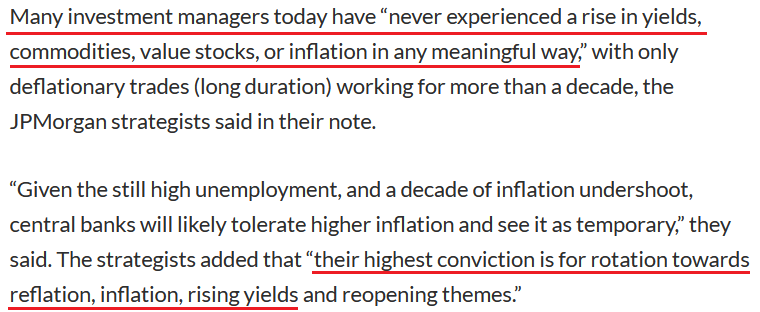 Source: J.P. Morgan/MarketWatch
The bottom line?
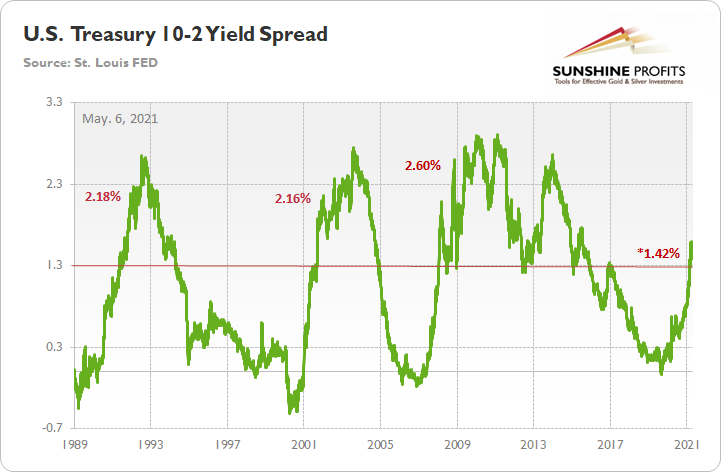
While the U.S. 10-Year Treasury yield remains in consolidation mode, it’s important to remember that the U.S. Treasury 10-2 yield spread hasn’t made a new low.
To explain, when the green line above is rising, it means that the U.S. 10-Year Treasury yield is increasing at a faster pace or declining at a slower pace than the U.S. 2-Year Treasury yield. Conversely, when the green line above is falling, it means that the U.S. 2-Year Treasury yield is increasing at a faster pace or declining at a slower pace than the U.S. 10-Year Treasury yield. In addition, the 10-2 spread is more relevant than analyzing their behavior in isolation because the ‘neutral rate of interest’ has changed dramatically over the last 30 years.
More importantly, though, after peaking at 1.59% on Mar. 29, the 10-2 spread corrected back to 1.39%. However, with the milestone marking a 20-basis-point decline over 18 trading days, the 10-2 spread’s behavior mirrors what we witnessed in 2001/2002.
To explain, I wrote previously:
After reaching an interim peak in 2001, the 10-2 spread declined by 20 basis points over a 17-day stretch. However, the 10-2 spread followed its 2001 swoon by rallying by 105 basis points over the following 97 days (into 2002).
If you analyze the horizontal red line, 1.30% is where historical roads got a little rocky. However, after recording a major bottom, rallying above 1.30% and then suffering a meaningful correction, the 10-2 spread proceeded to rally to 2.18% (1991), 2.16% (2002) and 2.60% (2008) before suffering a second meaningful correction.
Thus, while the PMs have enjoyed the U.S. 10-Year Treasury yield’s recent calm, the tranquility is unlikely to last over the medium term. Moreover, while the FED’s gambit of letting the genie out of the bottle is the easy part – by flooding the system with liquidity – putting him back in the bottle is unlikely to happen so smoothly.
In conclusion, gold moved higher on May 5th, while silver demonstrated relative weakness. And with the upside-down price action highlighting a lack of conviction among precious metals investors, the PMs have become increasingly rangebound. Moreover, with the U.S. 10-Year Treasury yield suffering from a similar affliction, the standoff is likely to continue until one side officially draws their guns. However, with fundamentals favoring the latter, the U.S. 10-Year Treasury yield has a lot more bullets in its chamber. As a result, the FED’s loyalty to liquidity will likely cause the PMs more harm than good over the medium term.
Overview of the Upcoming Part of the Decline
- It seems likely to me that the corrective upswing was already completed . Consequently, it seems that the next big move lower is already underway.
- After miners slide once again in a meaningful and volatile way, but silver doesn’t (and it just declines moderately), I plan to switch from short positions in miners to short positions in silver (this could take another 1-2 weeks to materialize). I plan to exit those short positions when gold shows substantial strength relative to the USD Index, while the latter is still rallying. This might take place with gold close to $1,450 - $1,500 and the entire decline (from above $1,700 to about $1,475) would be likely to take place within 1-12 weeks, and I would expect silver to fall hardest in the final part of the move. This moment (when gold performs very strongly against the rallying USD and miners are strong relative to gold – after gold has already declined substantially) is likely to be the best entry point for long-term investments, in my view. This might happen with gold close to $1,475, but it’s too early to say with certainty at this time. In other words, the entire decline could take between 1 and 12 weeks, with silver declines occurring particularly fast in the final 1-2 weeks.
- If gold declines even below $1,500 (say, to ~$1350 or so), then it could take another 10 weeks or so for it to bottom, but this is not what I view as a very likely outcome.
- As a confirmation for the above, I will use the (upcoming or perhaps we have already seen it?) top in the general stock market as the starting point for the three-month countdown. The reason is that after the 1929 top, gold miners declined for about three months after the general stock market started to slide. We also saw some confirmations of this theory based on the analogy to 2008. All in all, the precious metals sector would be likely to bottom about three months after the general stock market tops. If the last week’s highs in the S&P 500 and NASDAQ were the final highs, then we might expect the precious metals sector to bottom in the middle of the year – in late July or in August
- The above is based on the information available today, and it might change in the following days/weeks.
Please note that the above timing details are relatively broad and “for general overview only” – so that you know more or less what I think and how volatile I think the moves are likely to be – on an approximate basis. These time targets are not binding or clear enough for me to think that they should be used for purchasing options, warrants or similar instruments.
Summary
To summarize, the PMs’ medium-term decline is well underway and based on the recent performance of the USD Index, gold, and mining stocks, it seems that the corrective upswing is already over. The confirmed breakout in the USD Index is yet another confirmation of the bearish outlook for the precious metals market, and the same goes for the symmetric nature of the potential broad head-and-shoulders in gold and gold stocks.
After the sell-off (that takes gold to about $1,350 - $1,500), we expect the precious metals to rally significantly. The final part of the decline might take as little as 1-5 weeks, so it's important to stay alert to any changes.
Most importantly, please stay healthy and safe. We made a lot of money last March and this March, and it seems that we’re about to make much more on the upcoming decline, but you have to be healthy to enjoy the results.
As always, we'll keep you - our subscribers - informed.
By the way, we’re currently providing you with a possibility to extend your subscription by a year, two years or even three years with a special 20% discount. This discount can be applied right away, without the need to wait for your next renewal – if you choose to secure your premium access and complete the payment upfront. The boring time in the PMs is definitely over and the time to pay close attention to the market is here. Naturally, it’s your capital, and the choice is up to you, but it seems that it might be a good idea to secure more premium access now, while saving 20% at the same time. Our support team will be happy to assist you in the above-described upgrade at preferential terms – if you’d like to proceed, please contact us.
To summarize:
Trading capital (supplementary part of the portfolio; our opinion): Full speculative short positions (300% of the full position) in mining stocks are justified from the risk to reward point of view with the following binding exit profit-take price levels:
Mining stocks (price levels for the GDXJ ETF): binding profit-take exit price: $24.12; stop-loss: none (the volatility is too big to justify a stop-loss order in case of this particular trade)
Alternatively, if one seeks leverage, we’re providing the binding profit-take levels for the JDST (2x leveraged) and GDXD (3x leveraged – which is not suggested for most traders/investors due to the significant leverage). The binding profit-take level for the JDST: $39.87; stop-loss for the JDST: none (the volatility is too big to justify a SL order in case of this particular trade); binding profit-take level for the GDXD: $94.87; stop-loss for the GDXD: none (the volatility is too big to justify a SL order in case of this particular trade).
For-your-information targets (our opinion; we continue to think that mining stocks are the preferred way of taking advantage of the upcoming price move, but if for whatever reason one wants / has to use silver or gold for this trade, we are providing the details anyway.):
Silver futures upside profit-take exit price: unclear at this time - initially, it might be a good idea to exit, when gold moves to $1,512.
Gold futures upside profit-take exit price: $1,512.
Long-term capital (core part of the portfolio; our opinion): No positions (in other words: cash
Insurance capital (core part of the portfolio; our opinion): Full position
Whether you already subscribed or not, we encourage you to find out how to make the most of our alerts and read our replies to the most common alert-and-gold-trading-related-questions.
Please note that we describe the situation for the day that the alert is posted in the trading section. In other words, if we are writing about a speculative position, it means that it is up-to-date on the day it was posted. We are also featuring the initial target prices to decide whether keeping a position on a given day is in tune with your approach (some moves are too small for medium-term traders, and some might appear too big for day-traders).
Additionally, you might want to read why our stop-loss orders are usually relatively far from the current price.
Please note that a full position doesn't mean using all of the capital for a given trade. You will find details on our thoughts on gold portfolio structuring in the Key Insights section on our website.
As a reminder - "initial target price" means exactly that - an "initial" one. It's not a price level at which we suggest closing positions. If this becomes the case (like it did in the previous trade), we will refer to these levels as levels of exit orders (exactly as we've done previously). Stop-loss levels, however, are naturally not "initial", but something that, in our opinion, might be entered as an order.
Since it is impossible to synchronize target prices and stop-loss levels for all the ETFs and ETNs with the main markets that we provide these levels for (gold, silver and mining stocks - the GDX ETF), the stop-loss levels and target prices for other ETNs and ETF (among other: UGL, GLL, AGQ, ZSL, NUGT, DUST, JNUG, JDST) are provided as supplementary, and not as "final". This means that if a stop-loss or a target level is reached for any of the "additional instruments" (GLL for instance), but not for the "main instrument" (gold in this case), we will view positions in both gold and GLL as still open and the stop-loss for GLL would have to be moved lower. On the other hand, if gold moves to a stop-loss level but GLL doesn't, then we will view both positions (in gold and GLL) as closed. In other words, since it's not possible to be 100% certain that each related instrument moves to a given level when the underlying instrument does, we can't provide levels that would be binding. The levels that we do provide are our best estimate of the levels that will correspond to the levels in the underlying assets, but it will be the underlying assets that one will need to focus on regarding the signs pointing to closing a given position or keeping it open. We might adjust the levels in the "additional instruments" without adjusting the levels in the "main instruments", which will simply mean that we have improved our estimation of these levels, not that we changed our outlook on the markets. We are already working on a tool that would update these levels daily for the most popular ETFs, ETNs and individual mining stocks.
Our preferred ways to invest in and to trade gold along with the reasoning can be found in the how to buy gold section. Furthermore, our preferred ETFs and ETNs can be found in our Gold & Silver ETF Ranking.
As a reminder, Gold & Silver Trading Alerts are posted before or on each trading day (we usually post them before the opening bell, but we don't promise doing that each day). If there's anything urgent, we will send you an additional small alert before posting the main one.
Thank you.
Przemyslaw Radomski, CFA
Founder, Editor-in-chief


