

Briefly: in our opinion, full (300% of the regular position size) speculative short positions in mining stocks are justified from the risk/reward point of view at the moment of publishing this Alert.
The key indications for the precious metals market are likely arriving from the USD Index, but it's not yet apparent for the PMs investors and traders. Let's start with the long-term background and then we'll move to the latest short-term indications.
Speaking of indications pointing to the situation being excessive, let's take a look at the USD Index.
Remember when in early 2018 we wrote that the USD Index was bottoming due to a very powerful combination of support levels? Practically nobody wanted to read that as everyone "knew" that the USD Index is going to fall below 80. We were notified that people were hating on us in some blog comments for disclosing our opinion - that the USD Index was bottoming, and gold was topping. People were very unhappy with us writing that day after day, even though the USD Index refused to soar, and gold was not declining.
Well, it's the same right now.
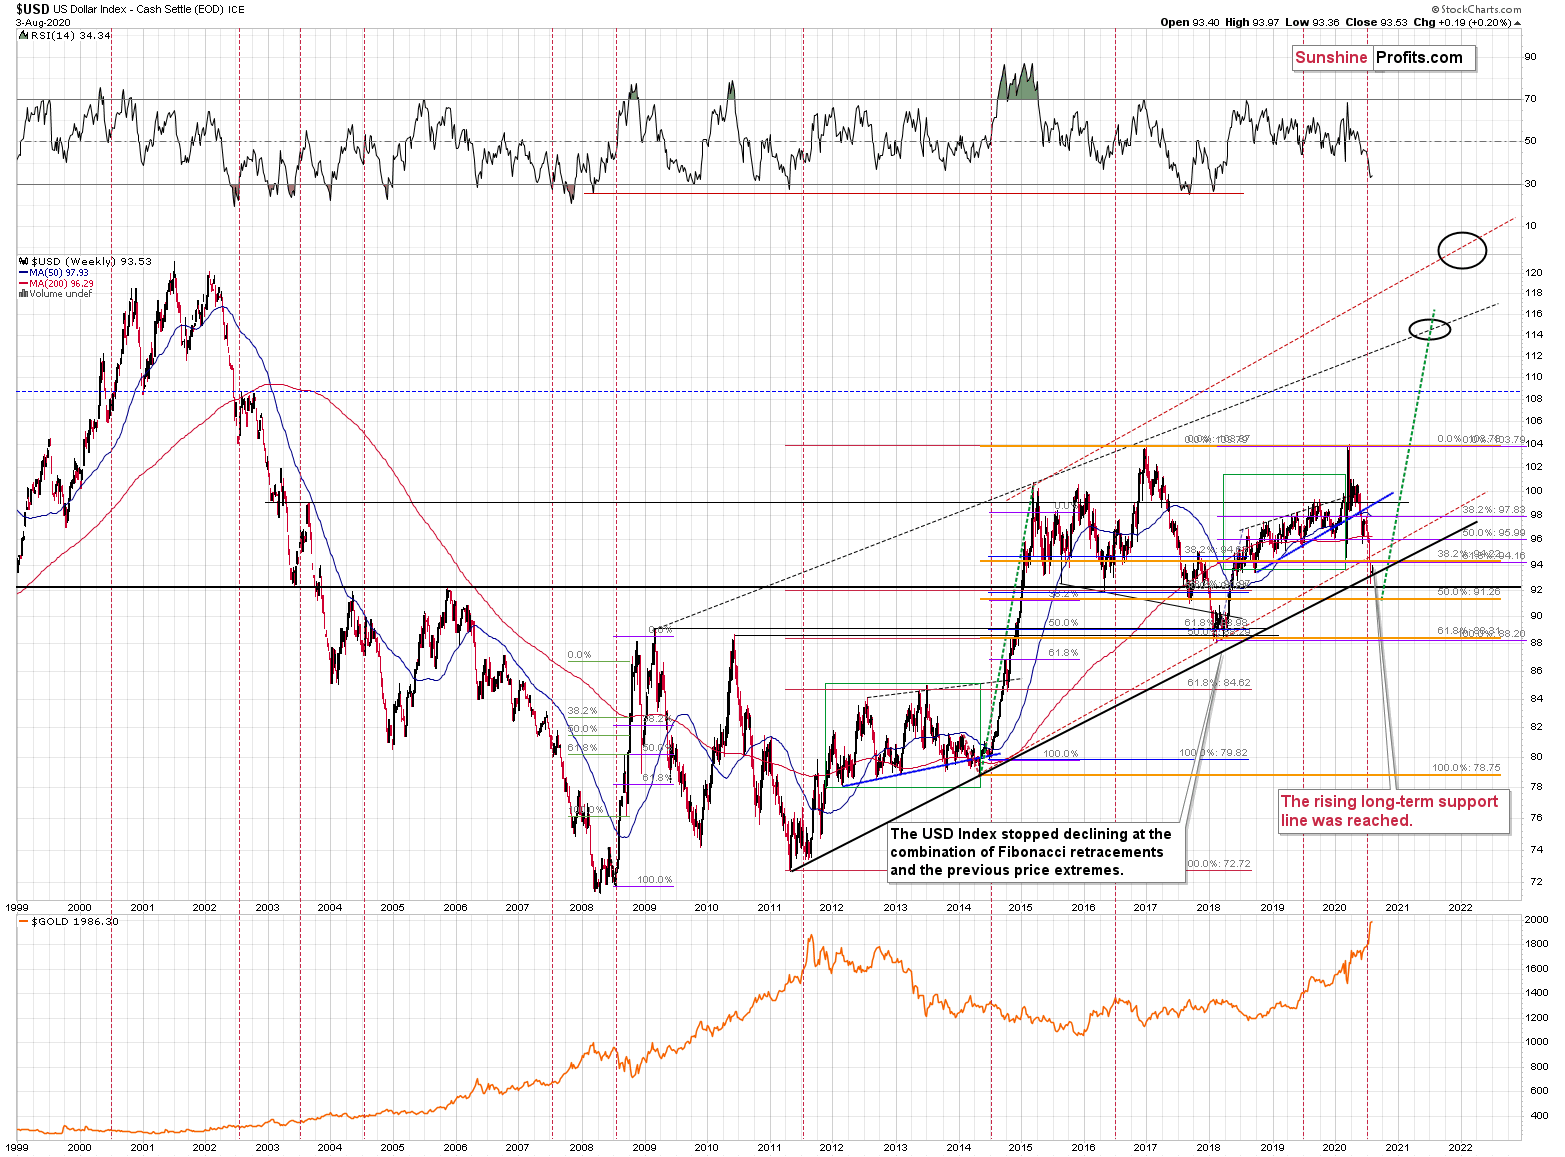
The USD Index is at a powerful combination of support levels. One of them is the rising, long-term, black support line that's based on the 2011 and 2014 bottoms.
The other major, long-term factor is the proximity to the 92 level - that's when gold topped in 2004, 2005, and where it - approximately - bottomed in 2015, and 2016.
The USDX just moved to these profound support levels, and it's very oversold on a short-term basis. It all happened in the middle of the year, which is when the USDX formed major bottoms on many occasions. This makes a short-term rally here very likely.
We even saw a confirmation from USD's short-term chart.
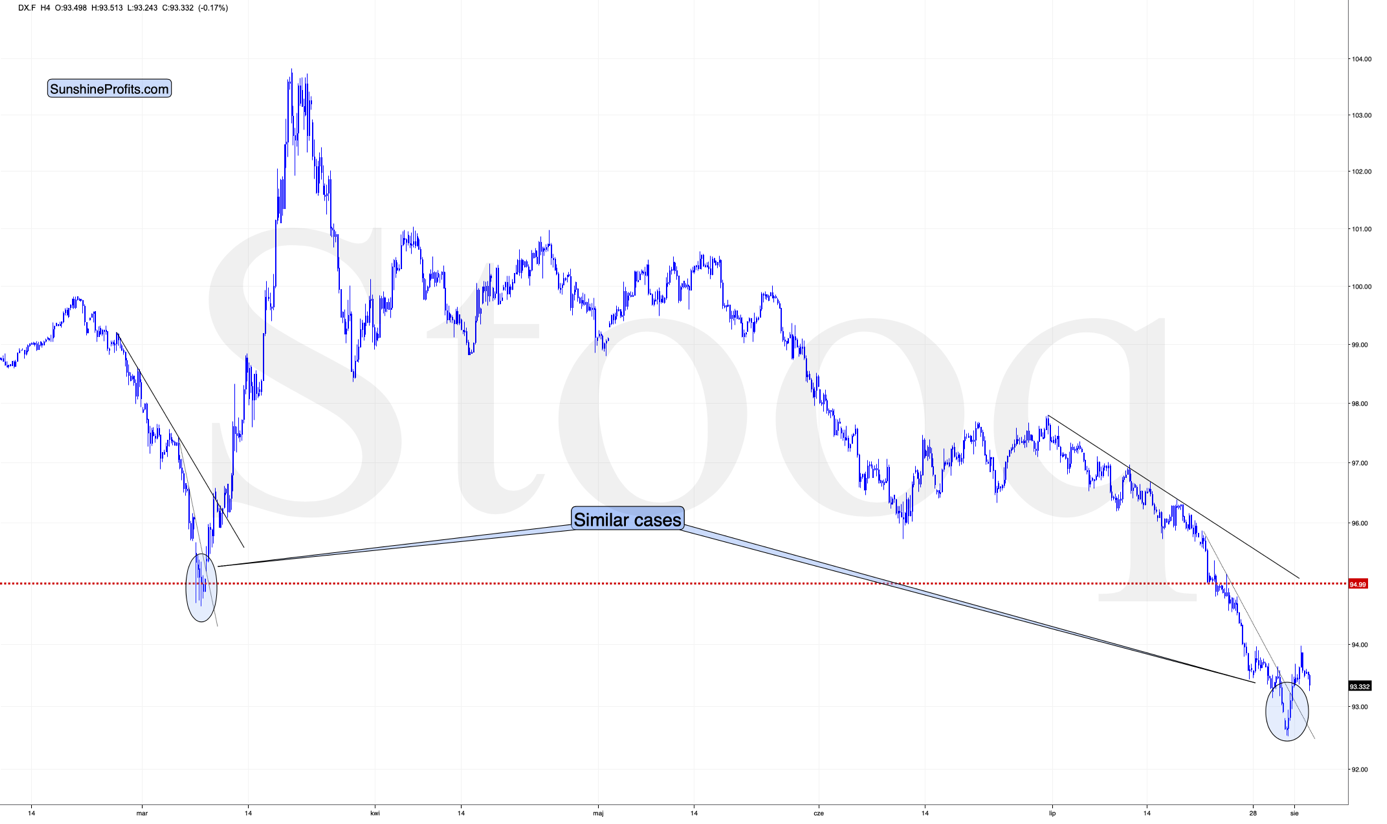
Precisely, the USD Index moved visibly above the declining resistance line, and it paused. The action that we see in the USD Index right now, is what we saw in it on March 10 and 11. And what was gold doing at that time?
We marked it with a purple dashed line. It was already after the top, but the gold price was hovering relatively close to the previous top. We were shorting the precious metals sector at that time, but in general, very few people realized that what was about to follow, was not bullish at all. Conversely, the pause in the USD Index and the corresponding pause in gold were the final moments before PMs' slide.
And it's not just gold that paused at that time.
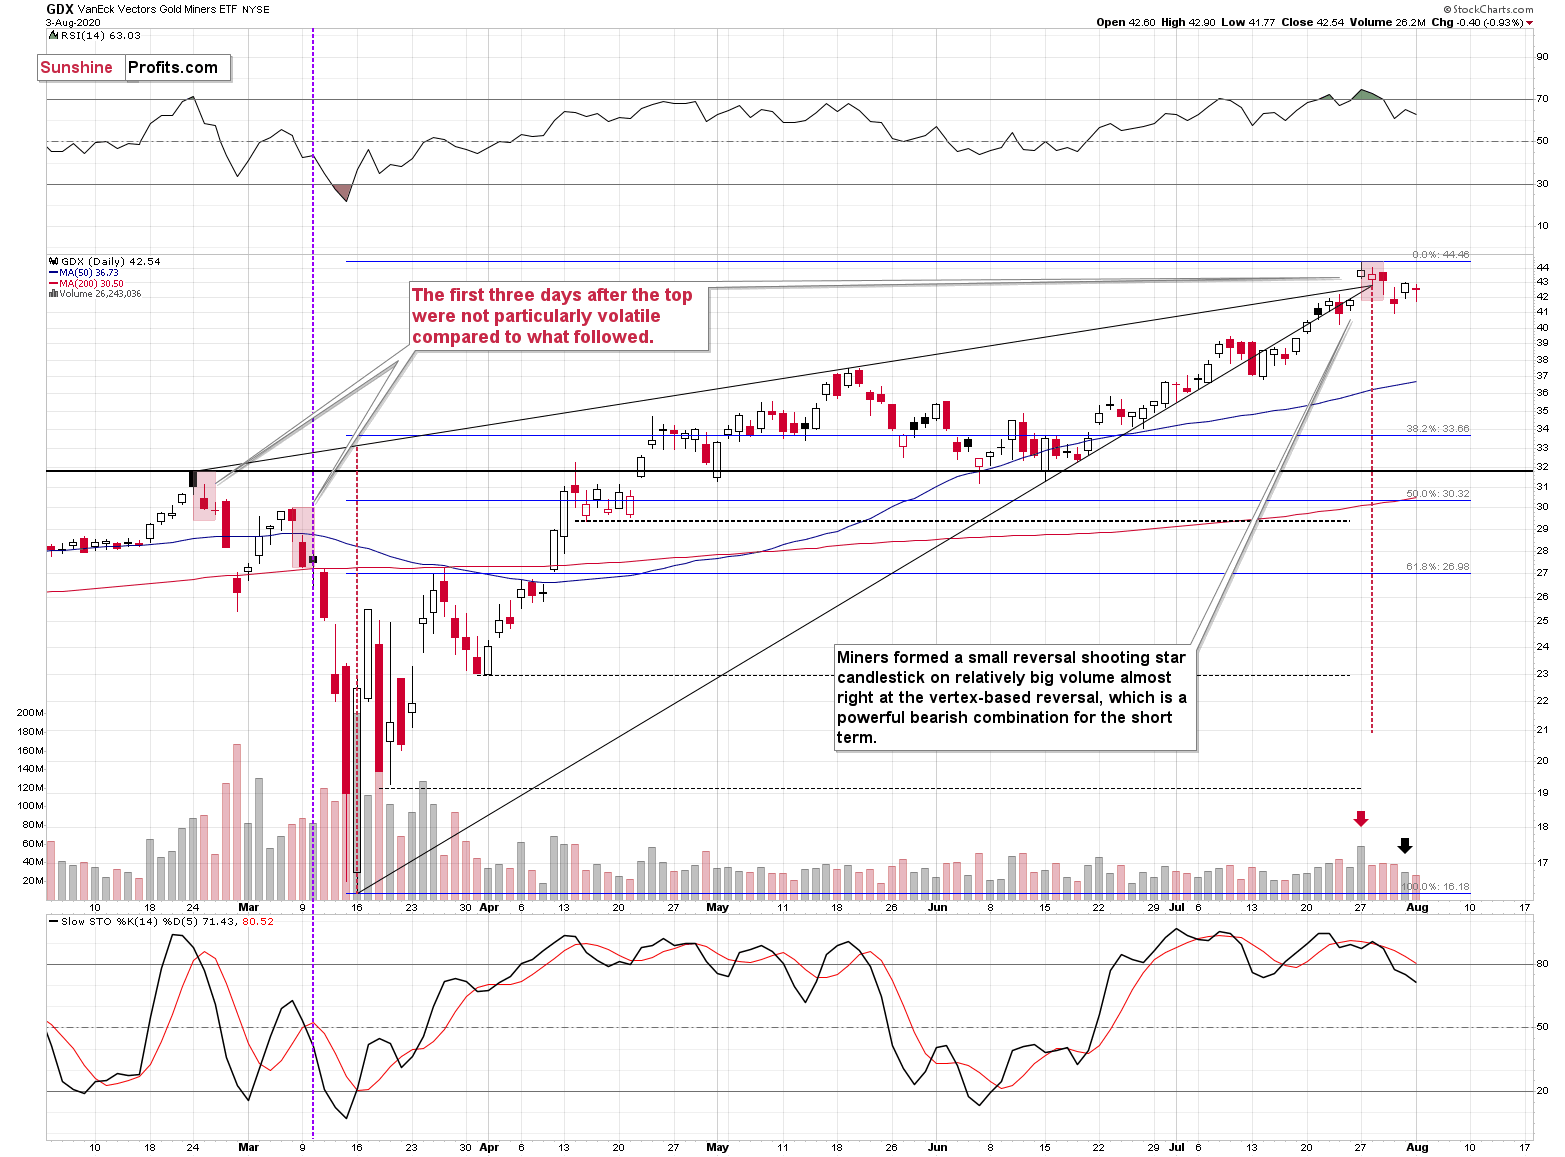
Gold miners were already after the top, and also after a longer period of underperformance. The same is the case right now, even though the price moves are not as volatile. Miners are after the top, underperforming gold.
What happened in March? Miners declined substantially, and they have done so sooner than gold did. They also bottomed first. We could see something very similar also this time.
Consequently, based on this analogy, the implications for the near term are bearish for PMs. Especially, when we consider the fact that Gold Miners Bullish Percent Index showed the highest possible overbought reading recently.
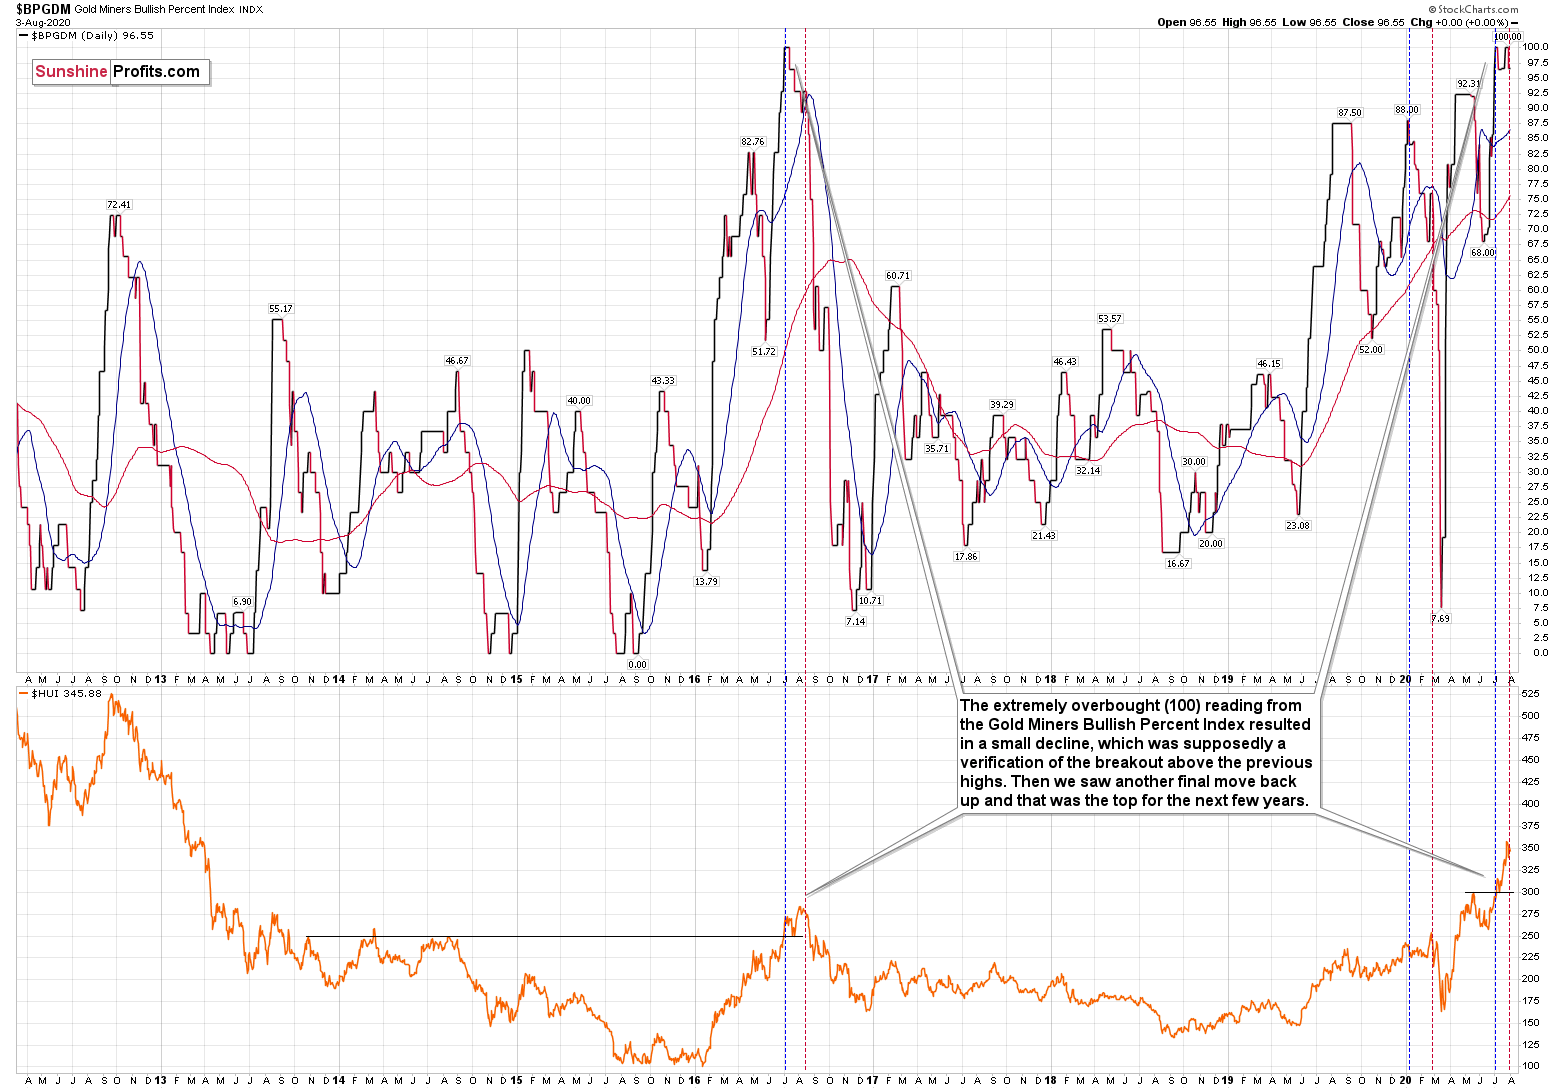
In yesterday's analysis, we commented on the above chart in the following way:
The excessive bullishness was present at the 2016 top as well and it didn't cause the situation to be any less bearish in reality. All markets periodically get ahead of themselves regardless of how bullish the long-term outlook really is. Then, they correct. If the upswing was significant, the correction is also quite often significant.
Please note that back in 2016, there was an additional quick upswing before the slide and this additional upswing has caused the Gold Miners Bullish Percent Index to move up once again for a few days. It then declined once again. We saw something similar also this time. In this case, this move up took the index once again to the 100 level, while in 2016 this wasn't the case. But still, the similarity remains present.
Back in 2016, when we saw this phenomenon, it was already after the top, and right before the big decline. Given the situation in the USD Index it seems that we're seeing the same thing also this time.
Today, we would like to add that we saw something similar also earlier this year. The Gold Miners Bullish Percent Index moved to 88 (marked with blue), then declined and then moved higher once again very briefly (marked with red). This was the final top. It seems quite likely that the final top for this short-term rally has already been formed.
Overview of the Upcoming Decline
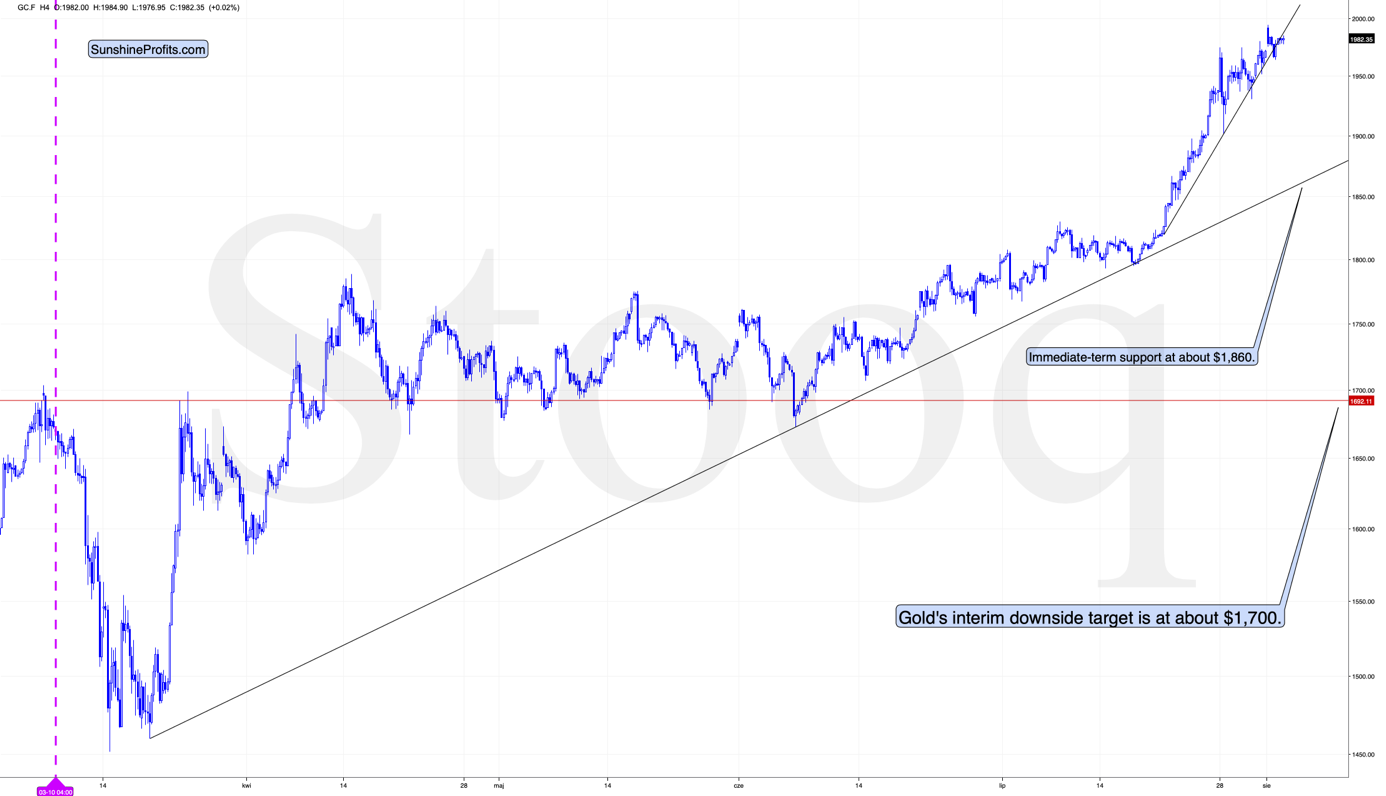
As far as the current overview of the upcoming decline is concerned, I think that after bottoming temporarily at about $1,700, gold, silver and miners will bounce back - perhaps $30-$50 or so in gold, and then we will probably see another move lower, with silver declining more than miners. That would be in tune with how the markets initially reacted to the Covid-19 threat.
At this time it seems that after the initial decline to $1,700, gold could correct and then decline to $1,500 - $1,600 and that would be the final bottom - one that would hold for years, perhaps decades.
Still, it's possible that the $1,700 bottom in gold would be the final bottom.
How will we tell, which scenario is more likely - a decline visibly below $1,700 or just to it? Based on the way different parts of the precious metals sector react to the decline and to the initial rebound. If silver catches up with the decline when gold moves to $1,700, but miners lead on the way back up (strongly so), it will be more likely that the bullish scenario prevails. If we see the opposite - miners are weak during the rebound and silver doesn't catch up with the decline once gold approaches $1,700, the bearish case will prevail. Anything in between will require additional confirmations and we will keep you - our subscribers - updated in any case.
The impact of all the new rounds of money printing in the U.S. and Europe on the precious metals prices is very positive in the long run, but it doesn't make the short-term decline unlikely. In the very near term, markets can and do get ahead of themselves and then need to decline - sometimes very profoundly - before continuing their upward march.
Summary
Summing up, it seems that gold has formed a triple-top pattern just as the USD Index seems to have finally bottomed. Once USD's short-term breakout is confirmed, it's likely to rally further and the precious metals sector is likely to fall. The extremely overbought reading from the Gold Miners Bullish Percent Index and the individual price moves make the current case very similar to the 2016 topping pattern, and other important indications (especially gold's and USD's long-term cycles) point to likely - sizable - decline in the following several weeks.
Naturally, everyone's trading is their responsibility, but in our opinion, if there ever was a time to either enter a short position in the miners or to increase its size if it wasn't already sizable, it's now. We made money on the March decline and on the March rebound, and it seems that another massive slide is about to start. When everyone is on one side of the boat, it's a good idea to be on the other side, and the Gold Miners Bullish Percent Index literally indicates that this is the case with mining stocks.
After the sell-off (that takes gold below $1,600), we expect the precious metals to rally significantly. The final decline might take as little as 1-6 weeks, so it's important to stay alert to any changes.
Most importantly - stay healthy and safe. We made a lot of money on the March decline and the subsequent rebound (its initial part) price moves (and we'll likely make much more in the following weeks and months), but you have to be healthy to really enjoy the results.
As always, we'll keep you - our subscribers - informed.
To summarize:
Trading capital (supplementary part of the portfolio; our opinion): Full speculative short positions (300% of the full position) in mining stocks is justified from the risk to reward point of view with the following binding exit profit-take price levels:
Senior mining stocks (price levels for the GDX ETF): binding profit-take exit price: $32.02; stop-loss: none (the volatility is too big to justify a SL order in case of this particular trade); binding profit-take level for the DUST ETF: $28.73; stop-loss for the DUST ETF: none (the volatility is too big to justify a SL order in case of this particular trade)
Junior mining stocks (price levels for the GDXJ ETF): binding profit-take exit price: $42.72; stop-loss: none (the volatility is too big to justify a SL order in case of this particular trade); binding profit-take level for the JDST ETF: $21.22; stop-loss for the JDST ETF: none (the volatility is too big to justify a SL order in case of this particular trade)
For-your-information targets (our opinion; we continue to think that mining stocks are the preferred way of taking advantage of the upcoming price move, but if for whatever reason one wants / has to use silver or gold for this trade, we are providing the details anyway. In our view, silver has greater potential than gold does):
Silver futures downside profit-take exit price: unclear at this time - initially, it might be a good idea to exit, when gold moves to $1,703.
Gold futures downside profit-take exit price: $1,703
Long-term capital (core part of the portfolio; our opinion): No positions (in other words: cash
Insurance capital (core part of the portfolio; our opinion): Full position
Whether you already subscribed or not, we encourage you to find out how to make the most of our alerts and read our replies to the most common alert-and-gold-trading-related-questions.
Please note that the in the trading section we describe the situation for the day that the alert is posted. In other words, it we are writing about a speculative position, it means that it is up-to-date on the day it was posted. We are also featuring the initial target prices, so that you can decide whether keeping a position on a given day is something that is in tune with your approach (some moves are too small for medium-term traders and some might appear too big for day-traders).
Plus, you might want to read why our stop-loss orders are usually relatively far from the current price.
Please note that a full position doesn't mean using all of the capital for a given trade. You will find details on our thoughts on gold portfolio structuring in the Key Insights section on our website.
As a reminder - "initial target price" means exactly that - an "initial" one, it's not a price level at which we suggest closing positions. If this becomes the case (like it did in the previous trade) we will refer to these levels as levels of exit orders (exactly as we've done previously). Stop-loss levels, however, are naturally not "initial", but something that, in our opinion, might be entered as an order.
Since it is impossible to synchronize target prices and stop-loss levels for all the ETFs and ETNs with the main markets that we provide these levels for (gold, silver and mining stocks - the GDX ETF), the stop-loss levels and target prices for other ETNs and ETF (among other: UGLD, DGLD, USLV, DSLV, NUGT, DUST, JNUG, JDST) are provided as supplementary, and not as "final". This means that if a stop-loss or a target level is reached for any of the "additional instruments" (DGLD for instance), but not for the "main instrument" (gold in this case), we will view positions in both gold and DGLD as still open and the stop-loss for DGLD would have to be moved lower. On the other hand, if gold moves to a stop-loss level but DGLD doesn't, then we will view both positions (in gold and DGLD) as closed. In other words, since it's not possible to be 100% certain that each related instrument moves to a given level when the underlying instrument does, we can't provide levels that would be binding. The levels that we do provide are our best estimate of the levels that will correspond to the levels in the underlying assets, but it will be the underlying assets that one will need to focus on regarding the signs pointing to closing a given position or keeping it open. We might adjust the levels in the "additional instruments" without adjusting the levels in the "main instruments", which will simply mean that we have improved our estimation of these levels, not that we changed our outlook on the markets. We are already working on a tool that would update these levels on a daily basis for the most popular ETFs, ETNs and individual mining stocks.
Our preferred ways to invest in and to trade gold along with the reasoning can be found in the how to buy gold section. Additionally, our preferred ETFs and ETNs can be found in our Gold & Silver ETF Ranking.
As a reminder, Gold & Silver Trading Alerts are posted before or on each trading day (we usually post them before the opening bell, but we don't promise doing that each day). If there's anything urgent, we will send you an additional small alert before posting the main one.
Thank you.
Sincerely,
Przemyslaw Radomski, CFA
Editor-in-chief, Gold & Silver Fund Manager

