

Briefly: in our opinion, full (300% of the regular position size) speculative short positions in junior mining stocks are justified from the risk/reward point of view at the moment of publishing this Alert.
It was no surprise that both gold and silver suffered a lot last week, since they usually react with a weakening to the dollar's success. As predicted, at the sight of the Fed’s hawk spreading its wings, after Powell announced that the Fed would raise interest rates in March, the precious metals moved lower with their tails between their legs.
Okay, but the dollar’s rally has to end sometime, or at least slow down, and that means an opportunity for gold and silver to win back. Indeed, this was the case just before last weekend. The dollar ran out of fuel for a while, but the precious metals got confused again and instead of making up for the losses, they generated more.
Why did this happen? A similar situation has already taken place this month. On January 13, I wrote:
I’ve been writing this over and over again, and yet I’ll write it once more. Markets don’t move in a straight line up or down, and periodic corrections are natural. However, the way markets interact during those corrections tells us a lot about what’s likely to take place next, at least in the case of some markets.
The USD Index declined quite visibly yesterday and in today’s overnight trading.
The key questions are: so what, and if that was completely unexpected.
Starting with the latter, it wasn’t unexpected. It’s something in tune with gold’s long-term chart.
When the weekly RSI (based on the weekly price changes) for the USD Index hit 70, I wrote the following:
Also, please note that the recent medium-term rally has been calmer than any major upswing witnessed over the last 20 years, where the USD Index’s RSI has hit 70. I marked the recent rally in the RSI with an orange rectangle, and I did the same with the second-least and third-least volatile of the medium-term upswings.
The sharp rallies in 2008 and 2014 were of much larger magnitudes. And in those historical analogies, the USD Index continued its surge for some time without suffering any material corrections.
As a result, the short-term outlook is more of a coin flip.
Consequently, the current decline is not unexpected, it’s rather normal.
Another thing is that after a series of declines, the outlook for gold for the next few days was not too rosy. As rising expectations of US interest rate hikes pushed the dollar to a multi-month high, making gold less attractive to investors, the end of January was supposed to be the yellow metal's worst week since late November.
Meanwhile, gold prices did not change on Monday, breaking a weak trend in the international market. Perhaps my theory that gold's idleness and the way it resists is actually its strength is reaffirmed. Not only did gold not hit its annual lows when the dollar peaked, but it was able to hold a stable position once the bears visualized the crash.
For context, I wrote on Jan. 27:
The U.S. currency just moved above its previous 2022 and 2021 highs, while gold is not at its 2021 lows.
Yet.
I wouldn’t view gold’s performance as true strength against the USD Index at this time just yet. Why? Because of the huge consolidation that gold has been trading in.
The strength that I want to see in gold is its ability not to fall or soar back up despite everything thrown against it, not because it’s stuck in a trading range.
In analogy, you’ve probably seen someone, who’s able to hold their ground, and not give up despite the world throwing every harm and obstacle at them. They show their character. They show their strength. Inaction could represent greater wisdom and/or love and focus on one’s goal that was associated with the lack of action. You probably know someone like that. You might be someone like that.
The above “inaction” is very different from “inaction” resulting from someone not knowing what to do, not having enough energy, or willpower.
However, wasn’t gold strong against the USD Index’s strength in 2021?
It was, but it was very weak compared to the ridiculous amounts of money that were printed in 2020 and 2021 and given the global pandemic. These are the circumstances, where gold “should be” soaring well above its 2011 highs, not invalidating the breakout above it. The latter, not the former, happened. Besides, the “strength” was present practically only in gold. Silver and miners remain well below their 2011 highs – they are not even close to them and didn’t move close to them at any point in 2020 or 2021.
In the coming days, the greenback will again be the most likely driver of gold prices. In addition, both the dollar and gold are expected to reflect the risk of the conflict between Russia and Ukraine, as I have already mentioned.
Having said that, let’s take a look at the markets from a more fundamental point of view.
USD: As Expected
After the USD Index surpassed its 2021 high on Jan. 27, my expectations for further dollar strength have materialized. Moreover, with the PMs often moving inversely to the U.S. dollar, they’ve struggled mightily in recent days. However, with a predictable cooling-off period commencing on Jan. 28, I noted that the dollar basket could pause and catch its breath. I wrote:
It’s crucial to avoid speculation and wait for confirmation of breakdowns and breakouts. In its absence, the price action often pulls you in the wrong direction. Remember the supposedly bearish move below 95 when the USD Index moved even below its rising support line? It’s been just 2 weeks since that development.
Fortunately, if you’ve been following my analyses, the recent price moves didn’t catch you by surprise. What’s next? While the USD Index still needs to confirm the recent breakout and some consolidation may ensue, the bullish medium-term thesis remains intact.
That's precisely what we saw on Jan. 28. However, the important development is that gold and silver did not exhibit strength. While the yellow metal could have recouped some losses while the USD Index paused, it declined by 0.47%. Similarly, silver underperformed and declined by 1.65%. As a result, the PMs' inability to muster relief rallies is profoundly bearish.
Furthermore, I've warned on several occasions that the S&P 500 can influence mining stocks. However, while the S&P 500 and the NASDAQ Composite rallied by 2.43% and 3.13%, respectively, on Jan. 28, the GDX ETF declined by 1.28% and the GDXJ ETF fell by 0.88%. Moreover, the GDXJ ETF closed below its 2021 low. As such, the PMs' weakness is visible from many angles.
Having said that, let's take a look at the situation from a fundamental point of view.
Don’t Fight the Fed
While I’ve been warning for months that surging inflation would elicit a hawkish shift from the Fed, the forecast became a reality on Jan. 26. Moreover, with the PMs highly allergic to higher interest rates, their fundamental frailty was on full display.
To that point, while the Fed tries to make up for its “transitory” mistake, Atlanta Fed President Raphael Bostic upped the hawkish ante on Jan. 28. Speaking to the Financial Times, he said that “the reduction of accommodation should translate into tighter financial markets” and that reducing the Fed’s balance sheet should happen “as quickly as possible” without causing another taper tantrum.
However, the important point is that Bostic said he would support a 50 basis point rate hike if inflation remains elevated.
Please see below:
 Source: the Financial Times
Thus, while some market participants assumed that the Fed would let inflation run wild, and gold, silver, and mining stocks would be material beneficiaries, I warned that the prospect was much more semblance than substance. Moreover, in four months, we went from maybe one rate hike in 2022 to the possibility of a 50 basis point rate hike in March.
To explain, I wrote on Sep. 27:
FOMC participants are split 50/50 when it comes to a 2022 rate hike. However, if the inflationary rush continues and Powell\s accelerated taper fails to quell the momentum, another pull-forward of the FOMC’s ‘dot plot’ could result in another sell-off of the PMs.
To that point, the U.S. 10-Year real yield has surged in 2022. Since higher real interest rates reduce the fundamental attractiveness of the PMs, last week’s sell-off was logical. However, with gold still materially elevated relative to real interest rates, more downside should materialize over the medium term.
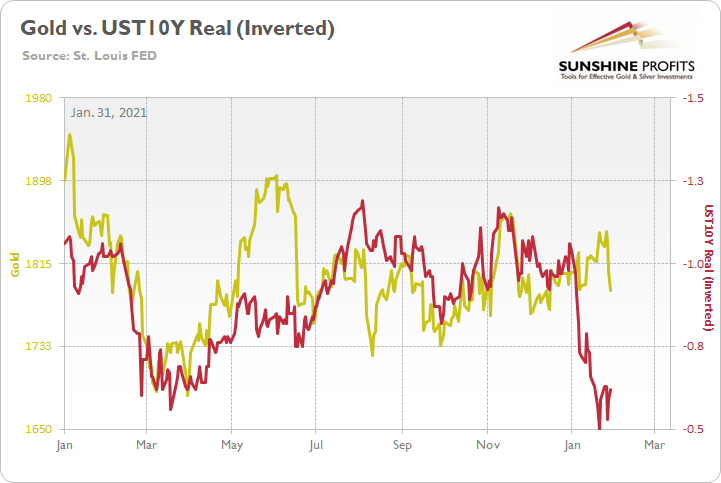
To explain, I wrote on Jan. 20:
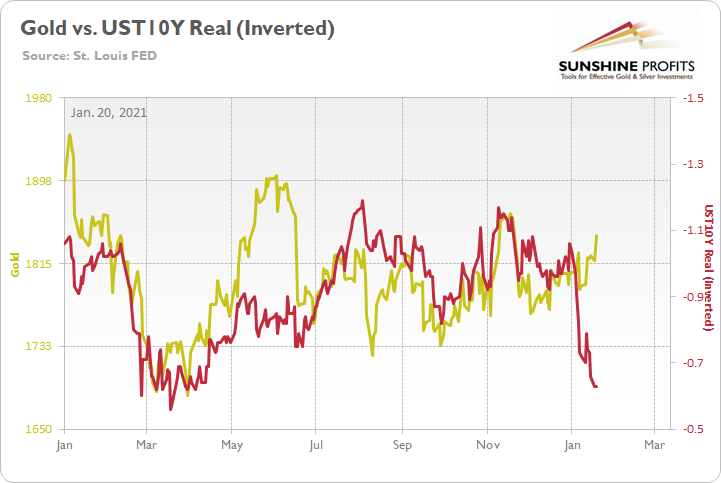
To explain, the gold line above tracks the London Bullion Market Association (LBMA) Gold Price since January 2021, while the red line above tracks the inverted U.S. 10-Year real yield. For context, inverted means that the latter’s scale is flipped upside down, and that a rising red line represents a falling U.S. 10-Year real yield, and a falling red line represents a rising U.S. 10-Year real yield.
If you analyze the relationship, you can see that the former’s performance is closely linked to the latter’s performance. Moreover, if you focus your attention on the right side of the chart, you can see that the U.S. 10-Year real yield has risen precipitously in 2022 and is gunning for its March 2021 lows (depicted by the red line moving sharply lower). As a result, the reading implies an LBMA Gold Price of roughly $1,690.
Likewise, notice what happened in May and early June when gold attempted to run away from the U.S. 10-Year real yield? Initially, it took off like a rocket, only to come back down to earth and reconnect with the red line soon after. As a result, while the yellow metal attempts to defy fundamental and historical precedent, is this time really different?
To that point, last week’s sell-off was relatively small, and with the U.S. 10-Year real yield consolidating at higher levels, gold still has plenty of catching up to do.
Please see below:
In addition, I’ve repeated that a bullish U.S. economy is bearish for the PMs and the NASDAQ Composite. In a nutshell: a resilient U.S. economy keeps the pressure on the Fed. Thus, as long as economic growth remains constructive and inflation is high, the Fed is unlikely to perform a dovish 180.
Moreover, the U.S. Bureau of Economic Analysis (BEA) released its advance estimate for fourth-quarter GDP on Jan. 27. The report revealed:
“Real GDP accelerated in the fourth quarter, increasing 6.9 percent after increasing 2.3 percent in the third quarter. The acceleration in real GDP in the fourth quarter primarily reflected an upturn in exports, accelerations in private inventory investment and PCE, and smaller decreases in residential fixed investment and federal government spending that were partly offset by a downturn in state and local government spending. Imports accelerated.”
Please see below:
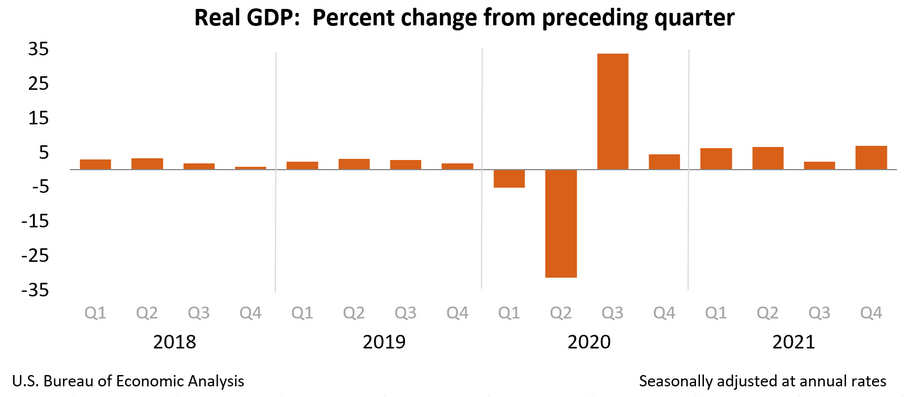
As a result, the U.S. economy is growing well ahead of its pre-pandemic trend. Moreover, while disruptions from the Omicron variant will likely slow growth in Q1, the outbreak should calm down when warmer weather arrives. Moreover, with the season also allowing for patio dining, camping trips, and other outdoor activities that support economic growth, Q1’s weakness should be short-lived.
As further evidence, the Cleveland Fed’s recession probability indicator continues to hit new lows. For context, the regional Fed bank uses the spread between the U.S. 10-Year Treasury yield and the 3-month Treasury Bill to predict economic stress.
Please see below:
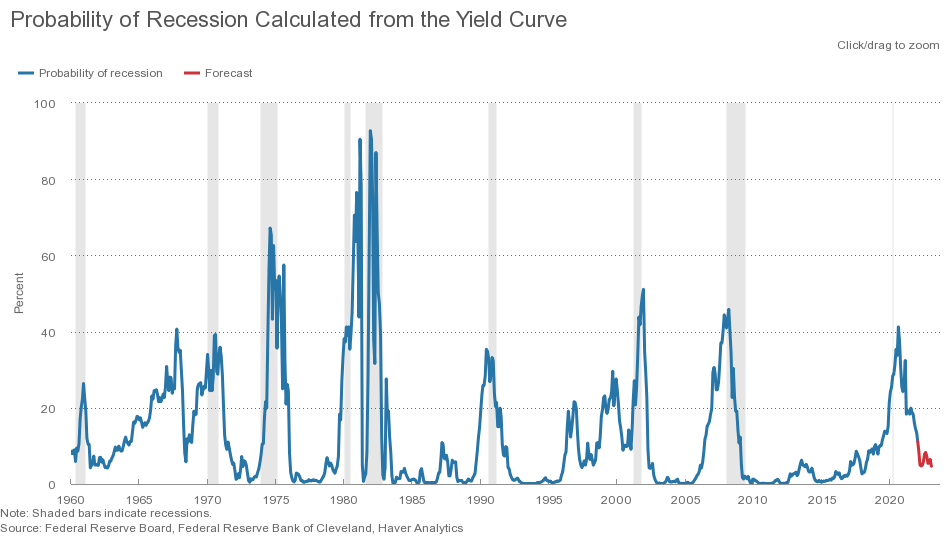
To explain, the blue line above tracks the Cleveland Fed’s recession indicator, while the shaded gray areas above represent U.S. recessions. If you analyze the behavior, you can see that the indicator often rises in advance of U.S. recessions. However, with the blue line on the right side of the chart continuing to fall, the data implies that the U.S. economy remains on solid ground.
Likewise, the Cleveland Fed’s 12-month projection also signals lower lows in 2022 (the red line on the right side of the chart above). As a result, Fed officials’ tightening indicators are flashing green, and they’re unlikely to reverse course anytime soon.
Finally, I’ve noted how U.S. President Joe Biden’s approval rating continues to follow consumer confidence. With the University of Michigan’s Consumer Sentiment Index (CSI) “sinking to its lowest level since November 2011” on Jan. 28, chief economist Richard Curtin said:
“Overall confidence in government economic policies is at its lowest level since 2014, and the major geopolitical risks may add to the pandemic active confrontations with other countries. Although their primary concern is rising inflation and falling real incomes (see the chart), consumers may misinterpret the Fed's policy moves to slow the economy as part of the problem rather than part of the solution.”
Please see below:
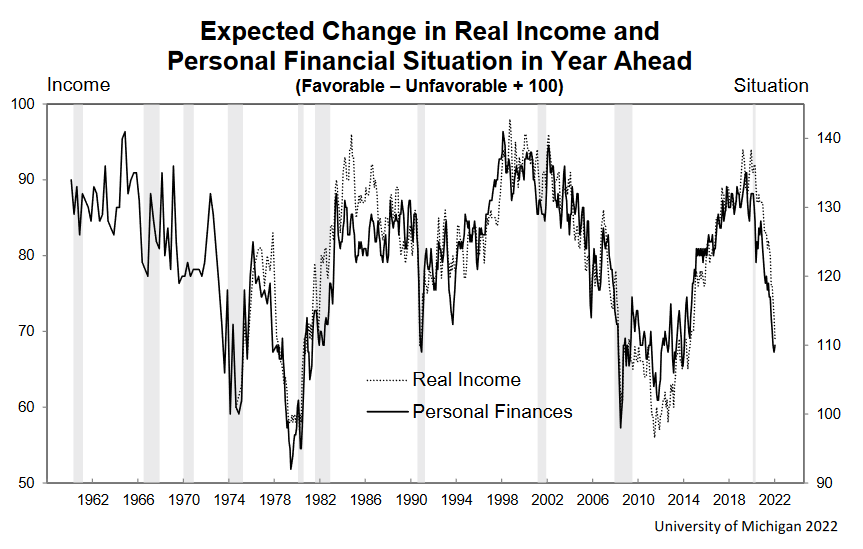
To explain, the black and gray lines above track Americans’ expectations for their real (inflation-adjusted) incomes and their personal finances over the next 12 months. If you analyze the sharp drop on the right side of the chart, you can see that Americans are unhappy with the inflationary onslaught. As a result, Biden needs Powell to stem the tide before it’s too late.
The bottom line? The Fed is hawked up, Biden is anxious, and the economic outlook supports rate hikes in the coming months. Moreover, with higher real interest rates the key to calming inflation, the U.S. 10-Year real yield should rise over the medium term. As such, with gold already materially overvalued relative to real interest rates, don’t be surprised if more daily flash crashes occur.
In conclusion, the PMs declined on Jan. 28, and silver was the daily underperformer. Moreover, with the PMs known to ignore fundamentals until the pressure becomes too much, last week’s sell-off was likely far from capitulation. As a result, more downside should materialize before short-term buying opportunities emerge.
Overview of the Upcoming Part of the Decline
- It seems to me that the corrective upswing is over or close to being over, and that gold, silver, and mining stocks are now likely to continue their medium-term decline.
- It seems that the first (bigger) stop for gold will be close to its previous 2021 lows, slightly below $1,700. Then it will likely correct a bit, but it’s unclear if I want to exit or reverse the current short position based on that – it depends on the number and the nature of the bullish indications that we get at that time.
- After the above-mentioned correction, we’re likely to see a powerful slide, perhaps close to the 2020 low ($1,450 - $1,500).
- If we see a situation where miners slide in a meaningful and volatile way while silver doesn’t (it just declines moderately), I plan to – once again – switch from short positions in miners to short positions in silver. At this time, it’s too early to say at what price levels this could take place, and if we get this kind of opportunity at all – perhaps with gold close to $1,600.
- I plan to exit all remaining short positions once gold shows substantial strength relative to the USD Index while the latter is still rallying. This may be the case with gold close to $1,350 - $1,400. I expect silver to fall the hardest in the final part of the move. This moment (when gold performs very strongly against the rallying USD and miners are strong relative to gold after its substantial decline) is likely to be the best entry point for long-term investments, in my view. This can also happen with gold close to $1,375, but at the moment it’s too early to say with certainty.
- As a confirmation for the above, I will use the (upcoming or perhaps we have already seen it?) top in the general stock market as the starting point for the three-month countdown. The reason is that after the 1929 top, gold miners declined for about three months after the general stock market started to slide. We also saw some confirmations of this theory based on the analogy to 2008. All in all, the precious metals sector is likely to bottom about three months after the general stock market tops.
- The above is based on the information available today, and it might change in the following days/weeks.
You will find my general overview of the outlook for gold on the chart below:
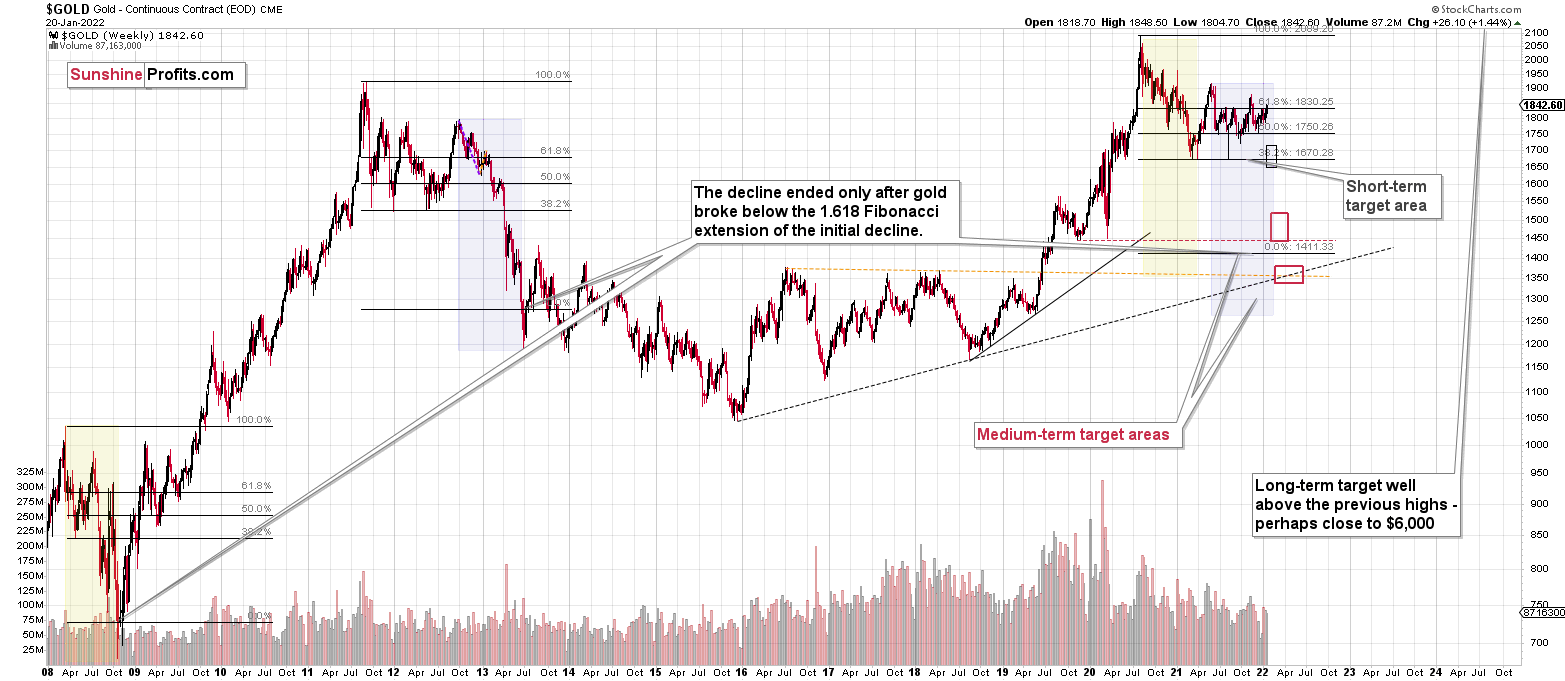
Please note that the above timing details are relatively broad and “for general overview only” – so that you know more or less what I think and how volatile I think the moves are likely to be – on an approximate basis. These time targets are not binding or clear enough for me to think that they should be used for purchasing options, warrants or similar instruments.
IMPORTANT REMINDER:
Administrative Info for This Week
I – PR – will be traveling this week, which means that the analyses will take a slightly different shape.
Regular analyses will include only the fundamental parts of the analyses, and while the technical details will not be posted regularly, I’ll still be monitoring the markets for most days, and I’ll send you intraday Alerts, if the situation requires it (in particular, if some extra changes are required in the trading or investment positions).
To be precise, the target levels presented in the “Trading capital” part below summary are “binding”, which means that if the price touches a given level, the trade should be executed (in my opinion, that is; it’s your capital, and you can do whatever you want with it) without waiting for my confirmation. I’m usually sending them for additional clarification, anyway, but this likely won’t be the case next week. In other words, if you haven’t placed an exit order on your trades, yet you’d like to apply the above suggestion, it might be a good idea to place those exit orders right away.
By “most days”, I mean that I know that there will be two days when I’ll have no access to any internet / electronics whatsoever, but I don’t know which days those will be. So, conservatively, I’ll provide you with a game-plan for the next week below. This way, my intraday comments are not that important as you’re up-to-date in advance, and if it’s necessary for me to provide you with an intraday update and I have the ability to do so, let’s treat it as an “extra value” that is not necessary (you’ll already be up-to-date because of the below details), but welcome. The gameplan is really an answer to the following question:
What to do next, if the exit levels are reached and the market then moves significantly?
Basically, there could be three scenarios in this case:
- If – after reaching the exit levels – the price moves back up significantly, then it would be a good idea to re-enter the short position in the GDXJ at $35.94 (at 300% of the size of the regular position, so the same size of the position that we have right now).
- If – after reaching the exit levels – the price moves lower significantly (in other words, it doesn’t bottom, but keeps falling), then I think it would be a good idea to re-enter the short position in the GDXJ at $31.47.
- If – after reaching the exit levels – the GDXJ price moves back-and-forth and/or doesn’t move to any of the prices in the previous points, then I think no additional action would be necessary.
The first scenario is positive (we gain more by re-entering short positions at higher prices), and the second scenario is negative (we gain less by re-entering short positions at lower prices). The third scenario is neutral.
The most likely outcome, in my view, is that the GDXJ ETF price will either not manage to get to the $34.63 target next week, or that it will manage to do so, and then it will rebound just a little or trade sideways (third scenario).
After all, let’s keep in mind that mining stocks tend to show strength before gold does, and things are not as volatile as they were in early 2020. This means that the short-term bottom is likely to be rather normal, meaning a situation where miners first show strength by declining just a little while gold declines more, then perhaps rally somewhat while gold doesn’t decline or declines just a little. It takes time for the above to take place.
Consequently, the most likely outcome, in my view, is that next week, the profits on the short position in the junior mining stocks will simply grow while we keep the positions intact.
All in all, you’re already equipped with the strategy for the next week, and the odds are that it won’t be necessary to take action, anyway.
Summary
Summing up, it seems to me that the corrective upswing is over, and that gold, silver, and mining stocks are now likely to continue their medium-term decline.
Please note that if last week’s rally was indeed based on supposedly increased tensions regarding Ukraine, then it’s likely that this rally is not going to be significant, and it might already be over. The “supposedly shocking” news already hit the market, and without any real follow-up (material) action, like Russian troops marching across the border with Ukraine, it seems that there’s nothing additional that markets could rally on. The market already “knows” that the tensions are very high and the chance for military conflict is high, regardless of whether that’s true or not. There’s not much more that can be said to increase that even further – only real action is likely to do it – and seeing such action is very unlikely in my view.
I continue to think that junior mining stocks are currently likely to decline the most out of all parts of the precious metals sector.
From the medium-term point of view, the key two long-term factors remain the analogy to 2013 in gold and the broad head and shoulders pattern in the HUI Index. They both suggest much lower prices ahead.
It seems that our profits from the short positions are going to become truly epic in the following months.
After the sell-off (that takes gold to about $1,350 - $1,500), I expect the precious metals to rally significantly. The final part of the decline might take as little as 1-5 weeks, so it's important to stay alert to any changes.
Most importantly, please stay healthy and safe. We made a lot of money last March and this March, and it seems that we’re about to make much more on the upcoming decline, but you have to be healthy to enjoy the results.
As always, we'll keep you - our subscribers - informed.
To summarize:
Trading capital (supplementary part of the portfolio; our opinion): Full speculative short positions (300% of the full position) in junior mining stocks are justified from the risk to reward point of view with the following binding exit profit-take price levels:
Mining stocks (price levels for the GDXJ ETF): binding profit-take exit price: $34.63; stop-loss: none (the volatility is too big to justify a stop-loss order in case of this particular trade)
Alternatively, if one seeks leverage, we’re providing the binding profit-take levels for the JDST (2x leveraged) and GDXD (3x leveraged – which is not suggested for most traders/investors due to the significant leverage). The binding profit-take level for the JDST: $14.98; stop-loss for the JDST: none (the volatility is too big to justify a SL order in case of this particular trade); binding profit-take level for the GDXD: $25.48; stop-loss for the GDXD: none (the volatility is too big to justify a SL order in case of this particular trade).
For-your-information targets (our opinion; we continue to think that mining stocks are the preferred way of taking advantage of the upcoming price move, but if for whatever reason one wants / has to use silver or gold for this trade, we are providing the details anyway.):
Silver futures downside profit-take exit price: $19.12
SLV profit-take exit price: $17.72
ZSL profit-take exit price: $38.28
Gold futures downside profit-take exit price: $1,683
HGD.TO – alternative (Canadian) inverse 2x leveraged gold stocks ETF – the upside profit-take exit price: $11.79
HZD.TO – alternative (Canadian) inverse 2x leveraged silver ETF – the upside profit-take exit price: $29.48
Long-term capital (core part of the portfolio; our opinion): No positions (in other words: cash
Insurance capital (core part of the portfolio; our opinion): Full position
Whether you already subscribed or not, we encourage you to find out how to make the most of our alerts and read our replies to the most common alert-and-gold-trading-related-questions.
Please note that we describe the situation for the day that the alert is posted in the trading section. In other words, if we are writing about a speculative position, it means that it is up-to-date on the day it was posted. We are also featuring the initial target prices to decide whether keeping a position on a given day is in tune with your approach (some moves are too small for medium-term traders, and some might appear too big for day-traders).
Additionally, you might want to read why our stop-loss orders are usually relatively far from the current price.
Please note that a full position doesn't mean using all of the capital for a given trade. You will find details on our thoughts on gold portfolio structuring in the Key Insights section on our website.
As a reminder - "initial target price" means exactly that - an "initial" one. It's not a price level at which we suggest closing positions. If this becomes the case (like it did in the previous trade), we will refer to these levels as levels of exit orders (exactly as we've done previously). Stop-loss levels, however, are naturally not "initial", but something that, in our opinion, might be entered as an order.
Since it is impossible to synchronize target prices and stop-loss levels for all the ETFs and ETNs with the main markets that we provide these levels for (gold, silver and mining stocks - the GDX ETF), the stop-loss levels and target prices for other ETNs and ETF (among other: UGL, GLL, AGQ, ZSL, NUGT, DUST, JNUG, JDST) are provided as supplementary, and not as "final". This means that if a stop-loss or a target level is reached for any of the "additional instruments" (GLL for instance), but not for the "main instrument" (gold in this case), we will view positions in both gold and GLL as still open and the stop-loss for GLL would have to be moved lower. On the other hand, if gold moves to a stop-loss level but GLL doesn't, then we will view both positions (in gold and GLL) as closed. In other words, since it's not possible to be 100% certain that each related instrument moves to a given level when the underlying instrument does, we can't provide levels that would be binding. The levels that we do provide are our best estimate of the levels that will correspond to the levels in the underlying assets, but it will be the underlying assets that one will need to focus on regarding the signs pointing to closing a given position or keeping it open. We might adjust the levels in the "additional instruments" without adjusting the levels in the "main instruments", which will simply mean that we have improved our estimation of these levels, not that we changed our outlook on the markets. We are already working on a tool that would update these levels daily for the most popular ETFs, ETNs and individual mining stocks.
Our preferred ways to invest in and to trade gold along with the reasoning can be found in the how to buy gold section. Furthermore, our preferred ETFs and ETNs can be found in our Gold & Silver ETF Ranking.
As a reminder, Gold & Silver Trading Alerts are posted before or on each trading day (we usually post them before the opening bell, but we don't promise doing that each day). If there's anything urgent, we will send you an additional small alert before posting the main one.
Thank you.
Przemyslaw Radomski, CFA
Founder, Editor-in-chief

