

Briefly: In our opinion, full (200% of the regular size of the position) speculative short positions in gold, silver and mining stocks are justified from the risk/reward perspective at the moment of publishing this alert.
Gold soared yesterday, likely based on the escalation of the trade conflict between the U.S. and China, but after several hours the rally was over. The tensions didn’t really subside, but the price of gold is already about $10 below the price at which it was trading when yesterday’s rally had started. Is gold trying to say something? No. It’s not saying – it’s screaming.
There is a combination of two factors that makes the current situation particularly interesting and meaningful. The first factor is what we already discussed in the previous alerts – gold’s decline was delayed because new bullish fundamental news kept emerging. We wrote that eventually there would be no new bullish news and that the price of gold would move back to its default mode and resume its decline.
The second factor is that if a given market no longer reacts to factors that should trigger a specific kind of reaction, then it’s a clear sign that the market is about to move in the opposite direction. Yesterday’s session in gold showed exactly that – gold should have rallied, and it did – but only initially. There was not enough buying power to keep pushing gold higher. In fact, buyers were not even able to prevent gold’s decline in the final part of yesterday’s session. Today’s pre-market downswing (gold is at about $1,325 at the moment of writing these words) confirms that the buying power (at least temporarily) almost dried up.
Combining the two previous paragraphs gives us a picture in which gold is not only unwilling to rally substantially based on positive news – it’s not even likely to rally temporarily based on them. It means that both: gold’s next move is likely to be a sizable downswing and that the time for the consolidation is up or almost up.
Before we move to charts, we would like to explain how the market tends to react if it really wants to move in one way (here: decline), but the fundamentals keep interrupting it (here: bullish fundamental news). We’ll not going to explain a sophisticated econometric model for this and we’ll not going to use terms as first derivative or diminishing marginal returns. Instead, we’ll use a simple analogy to something from real life. It will not be a pleasant analogy, but if it generates any emotions, then it’s more likely that it will be easier to keep in mind.
Think of a hardcore drug addict. They have to keep on getting more and more of their “stuff” to keep them happy. They have to constantly increase the amounts of drugs that they take to get the same effect. Even though the final effect is the same – they get their “enjoyment” - the cause is only the increase in dosage. If they didn’t increase it, they would get smaller effects up to the point when it would not be noticeable. If they stop taking the drug at all (eventually, they are likely to run out of it, or their health is too damaged), their “enjoyment” turns into a nightmare.
Similarly, the price needs more and more bullish news to keep on rallying and at some point, the same amount of news (or the same importance of them) will start to generate smaller and smaller rallies. It would take more dramatic and more bullish pieces of news to trigger the same upswings. If the bullish news dosage stays the same, the price will rally at a slower pace and finally stop to rally at all. Once the bullish news is gone (or we have bearish news), the rally turns into a decline.
Yesterday’s session in gold likely shows the final stages of the above cycle and the implications are very bearish.
Having said that, let’s take a look at the charts starting with gold (chart courtesy of http://stockcharts.com).
Gold’s Daily Reversal
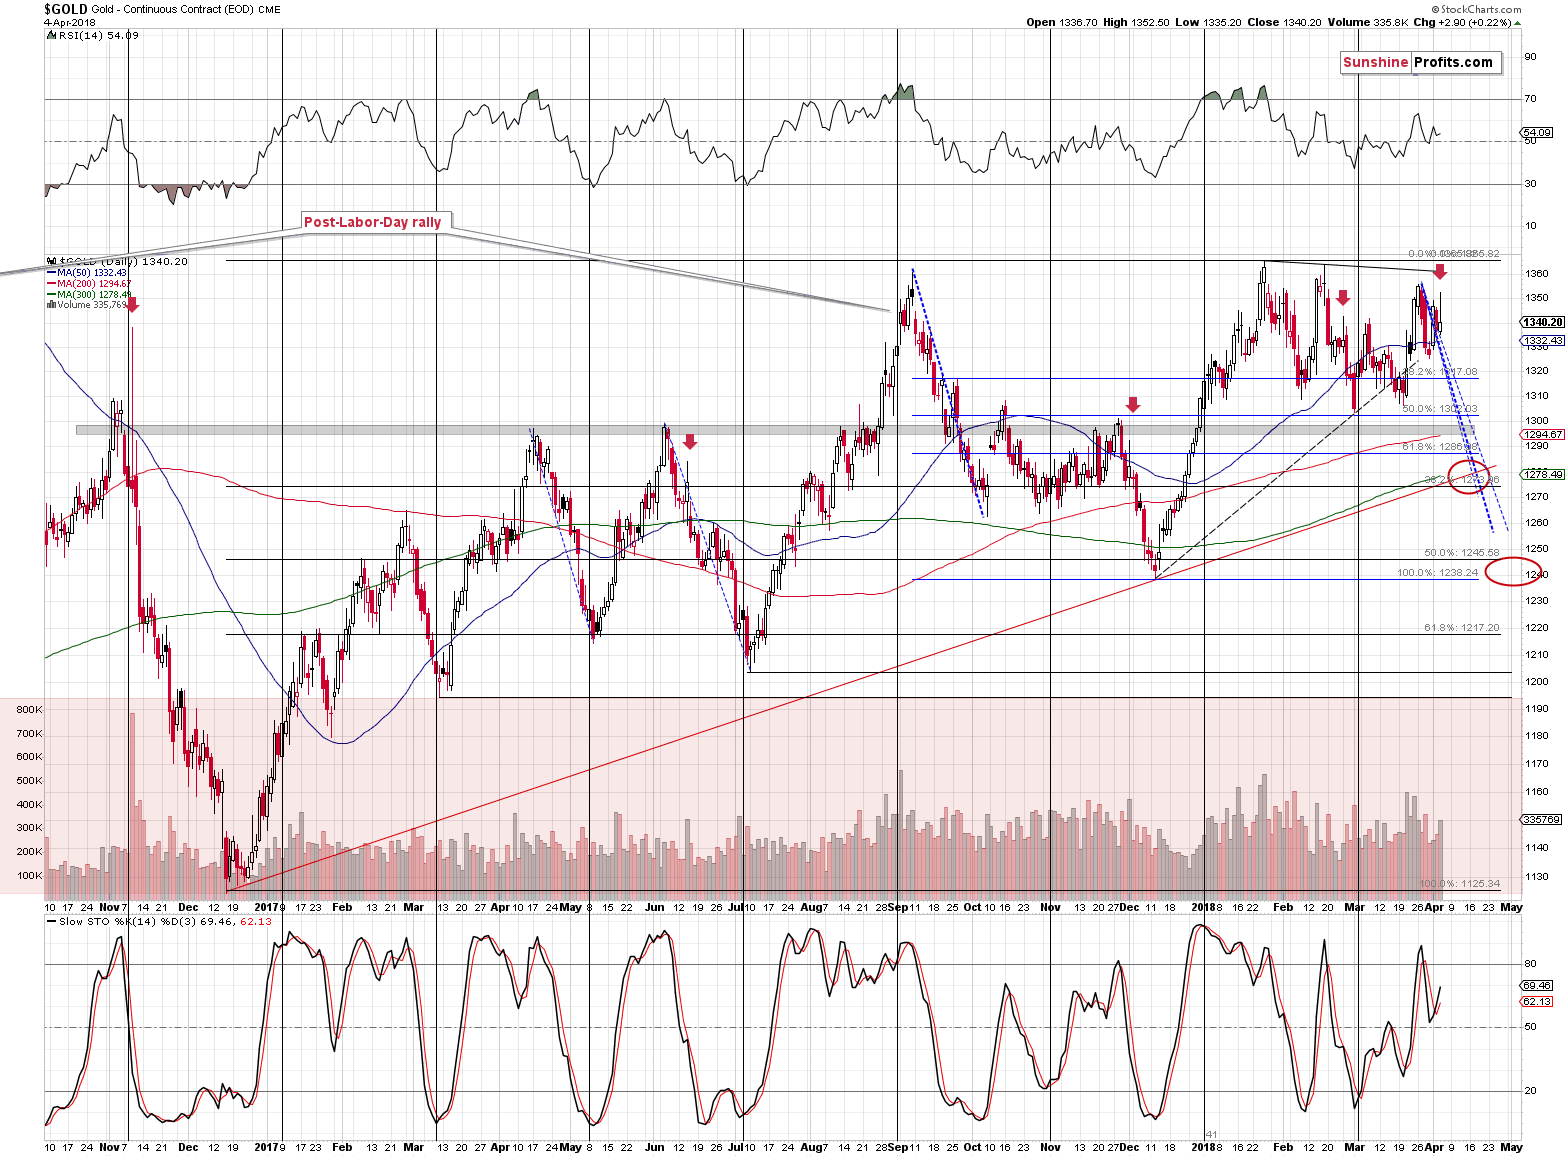
Technically speaking, gold reversed on significant volume, which is a classic sell signal. The implications are even greater than based on just the above, because we also have supporting analogies. Namely, this is the kind of reversal that we saw quite a few times before big slides, but after tops in terms of daily closing prices. We marked those cases with red arrows.
The most prominent example is early November 2016 and we can see the remaining ones (that are actually more similar to the current situation) in June 2017, on Dec. 1, 2017 and in late February 2018. They were all followed by declines practically right away and it seems that today’s pre-market decline proves that history is repeating itself.
Silver’s Daily “Strength” Invalidated
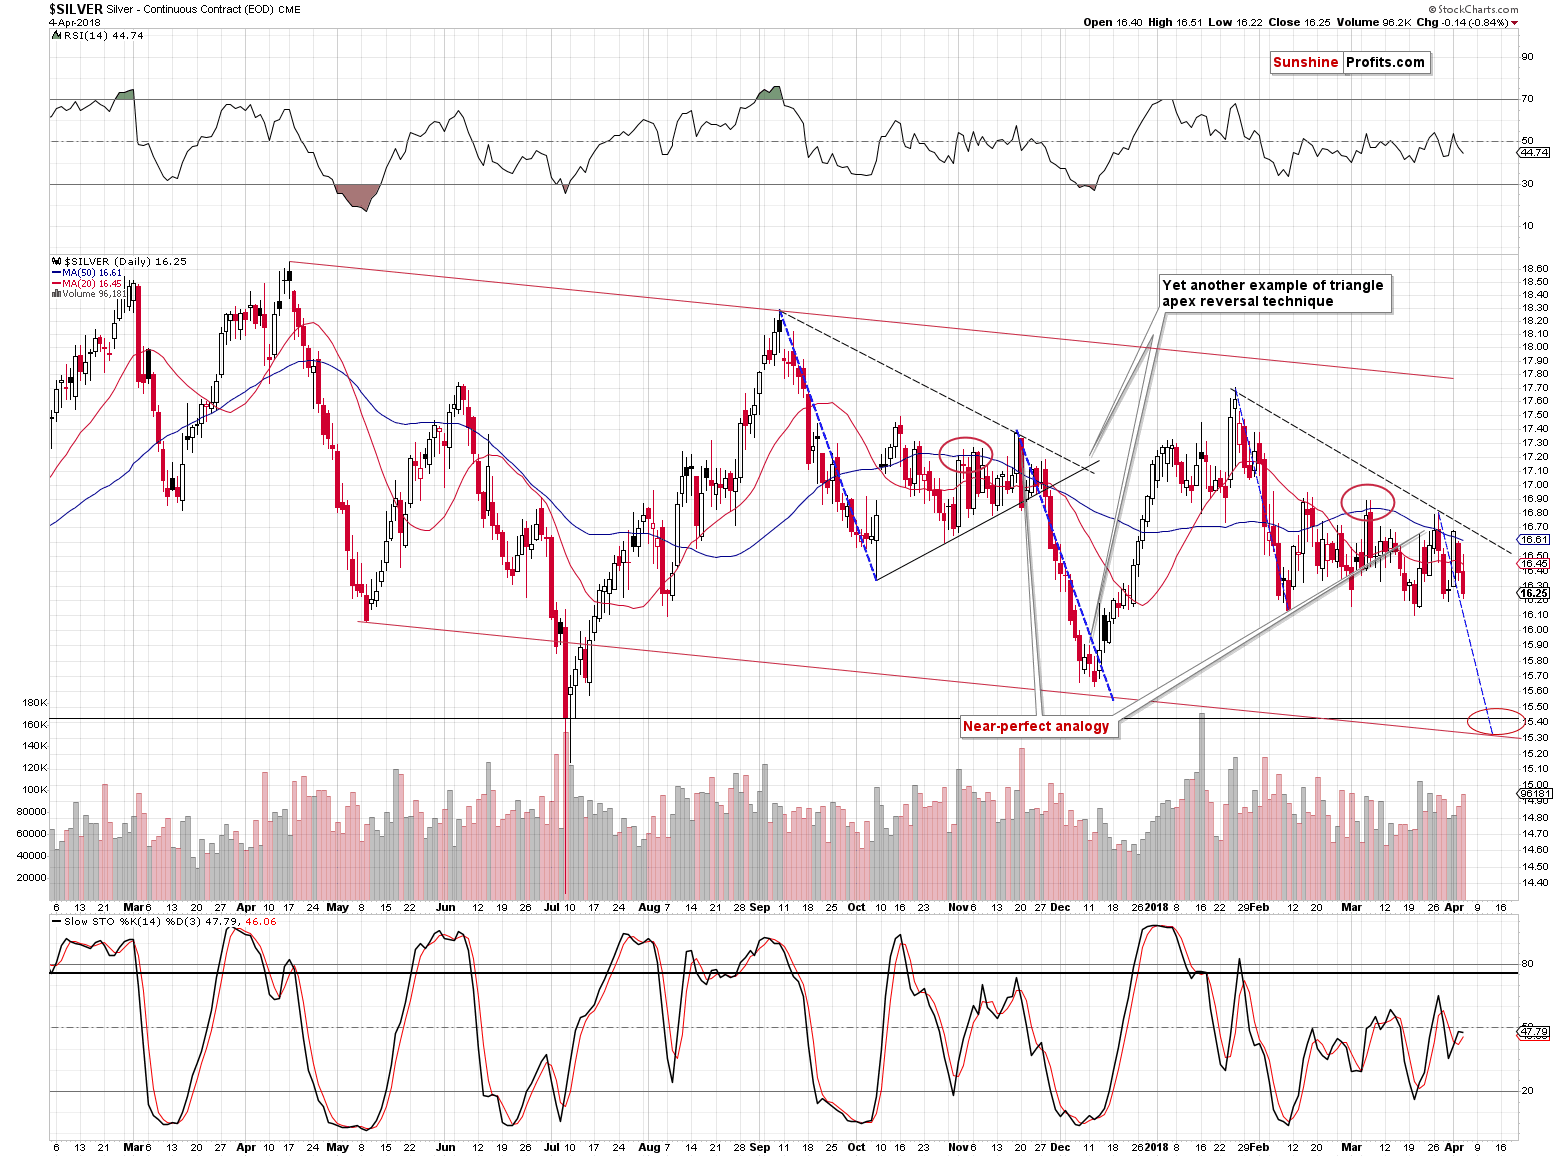
This week’s early strength is now fully invalidated. Actually, in today’s pre-market trading, silver even moved below the late-March low. In the previous alerts, we warned you not to trust the silver upswing and it was indeed followed by lower prices practically immediately.
Please note that for more than a week, silver’s daily declines have been accompanied by volume that’s higher than what we have seen during daily upswings. The implications are bearish.
In terms of the analogy to the pattern that we saw from September 2017 to early December 2017, we are now likely in a situation similar to Nov. 28, 2017 – right before the decline.
Miners’ Underperformance Continues
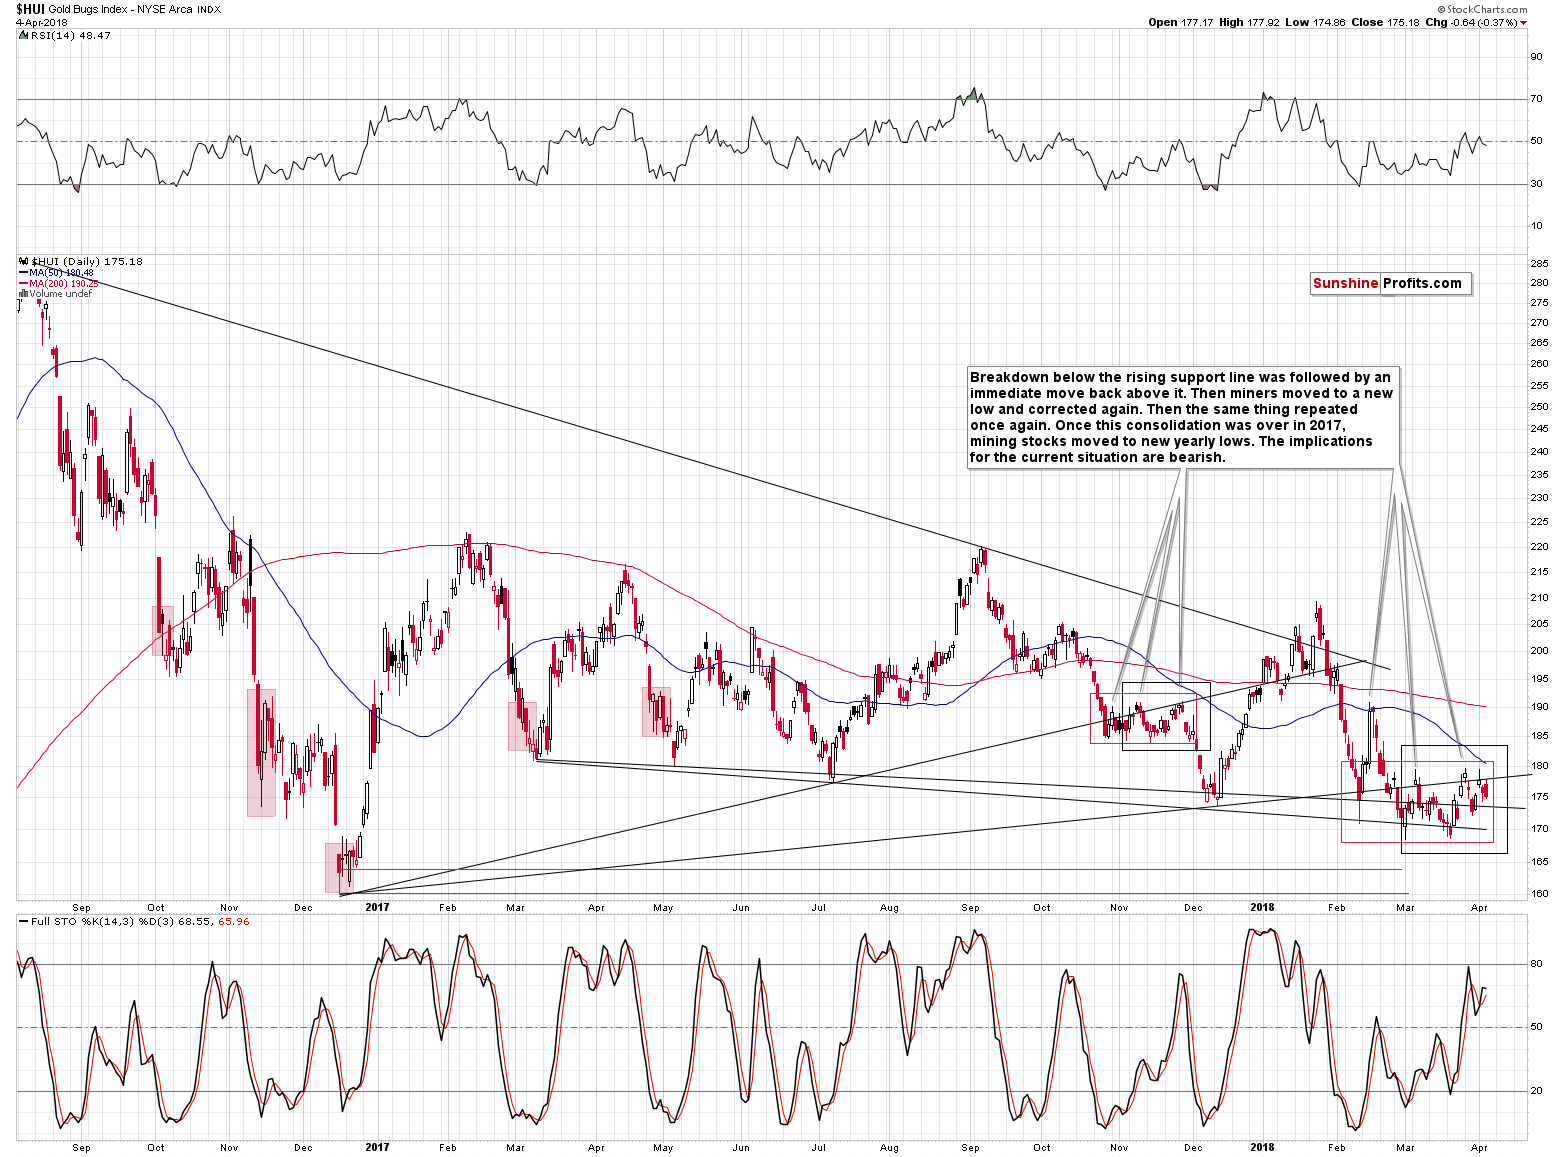
Even though gold moved a bit higher yesterday, gold stocks declined. That’s yet another clear sign of underperformance of the miners. The implications thereof remain bearish.
The EUR/USD Trigger
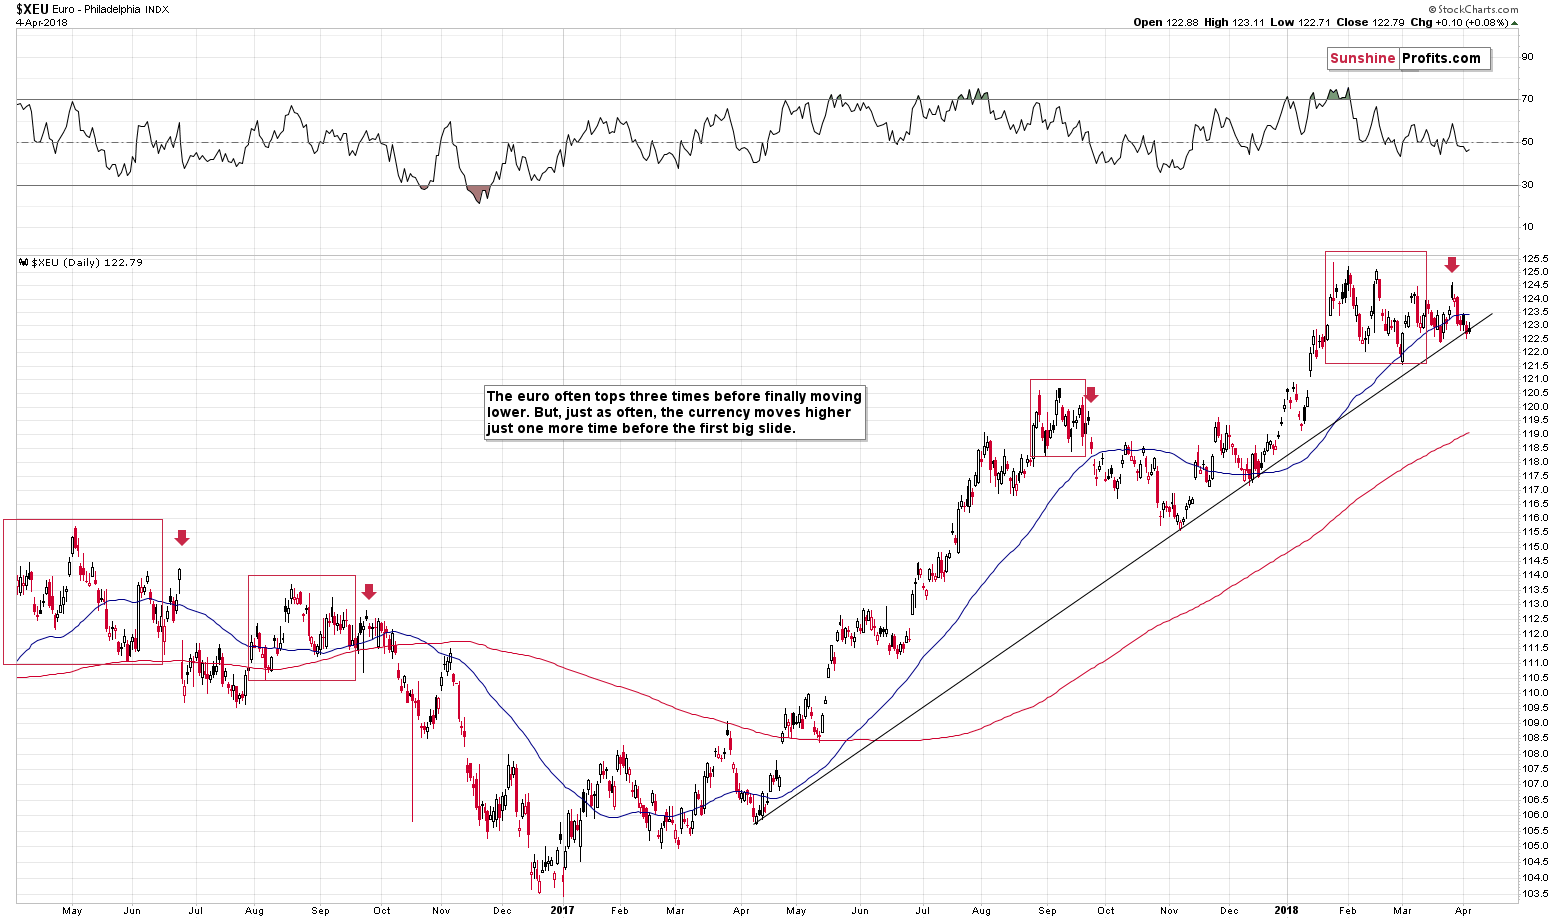
In yesterday’s alert we wrote that the situation in the EUR/USD currency pair remained tense and we wrote that it the pair was likely to break below its rising medium-term support line sooner rather than later. We wrote the following:
This support is what’s keeping the currency pair in check, which in turns keeps the USD Index in check. But, i.a. based on the triple-top formation it seems that we’ll see a big breakdown in the euro relatively soon. The implications are bullish for the USD Index and bearish for the precious metals sector.
The above remains up-to-date. The thing that we would like to add today is that despite the increased trade conflict tensions the USD’s value didn’t really decrease, which can be a sign that it really wants to move higher, not lower. That’s in perfect tune with our technical analysis of the USDX and also a factor supporting the scenario in which the EUR/USD pair breaks lower shortly.
Summary
Summing up, the fact that gold reversed its initial news-based rally is a very bearish sign for the following days and it suggests that the prolonged consolidation is over. Meanwhile, the next reversal date is looming, and it’s another reason that suggests that we’ll either see a decline shortly or that we’ll see more back-and-forth movement and a decline on April 9 or close to this date. The former is more likely at the moment. The Euro Index is on the verge of breaking lower, which is likely to push the USD higher and trigger a slide in the PMs.
As always, we will keep you – our subscribers – informed.
To summarize:
Trading capital (supplementary part of the portfolio; our opinion): Full short positions (200% of the full position) in gold, silver and mining stocks are justified from the risk/reward perspective with the following stop-loss orders and initial target price levels:
- Gold: initial target price: $1,218; stop-loss: $1,382; initial target price for the DGLD ETN: $53.98; stop-loss for the DGLD ETN $37.68
- Silver: initial target price: $14.63; stop-loss: $17.33; initial target price for the DSLV ETN: $33.88; stop-loss for the DSLV ETN $21.48
- Mining stocks (price levels for the GDX ETF): initial target price: $19.22; stop-loss: $23.54; initial target price for the DUST ETF: $39.88; stop-loss for the DUST ETF $21.46
In case one wants to bet on junior mining stocks' prices (we do not suggest doing so – we think senior mining stocks are more predictable in the case of short-term trades – if one wants to do it anyway, we provide the details), here are the stop-loss details and initial target prices:
- GDXJ ETF: initial target price: $27.82; stop-loss: $36.14
- JDST ETF: initial target price: $94.88 stop-loss: $41.86
Long-term capital (core part of the portfolio; our opinion): No positions (in other words: cash)
Insurance capital (core part of the portfolio; our opinion): Full position
Important Details for New Subscribers
Whether you already subscribed or not, we encourage you to find out how to make the most of our alerts and read our replies to the most common alert-and-gold-trading-related-questions.
Please note that the in the trading section we describe the situation for the day that the alert is posted. In other words, it we are writing about a speculative position, it means that it is up-to-date on the day it was posted. We are also featuring the initial target prices, so that you can decide whether keeping a position on a given day is something that is in tune with your approach (some moves are too small for medium-term traders and some might appear too big for day-traders).
Plus, you might want to read why our stop-loss orders are usually relatively far from the current price.
Please note that a full position doesn’t mean using all of the capital for a given trade. You will find details on our thoughts on gold portfolio structuring in the Key Insights section on our website.
As a reminder – “initial target price” means exactly that – an “initial” one, it’s not a price level at which we suggest closing positions. If this becomes the case (like it did in the previous trade) we will refer to these levels as levels of exit orders (exactly as we’ve done previously). Stop-loss levels, however, are naturally not “initial”, but something that, in our opinion, might be entered as an order.
Since it is impossible to synchronize target prices and stop-loss levels for all the ETFs and ETNs with the main markets that we provide these levels for (gold, silver and mining stocks – the GDX ETF), the stop-loss levels and target prices for other ETNs and ETF (among other: UGLD, DGLD, USLV, DSLV, NUGT, DUST, JNUG, JDST) are provided as supplementary, and not as “final”. This means that if a stop-loss or a target level is reached for any of the “additional instruments” (DGLD for instance), but not for the “main instrument” (gold in this case), we will view positions in both gold and DGLD as still open and the stop-loss for DGLD would have to be moved lower. On the other hand, if gold moves to a stop-loss level but DGLD doesn’t, then we will view both positions (in gold and DGLD) as closed. In other words, since it’s not possible to be 100% certain that each related instrument moves to a given level when the underlying instrument does, we can’t provide levels that would be binding. The levels that we do provide are our best estimate of the levels that will correspond to the levels in the underlying assets, but it will be the underlying assets that one will need to focus on regarding the signs pointing to closing a given position or keeping it open. We might adjust the levels in the “additional instruments” without adjusting the levels in the “main instruments”, which will simply mean that we have improved our estimation of these levels, not that we changed our outlook on the markets. We are already working on a tool that would update these levels on a daily basis for the most popular ETFs, ETNs and individual mining stocks.
Our preferred ways to invest in and to trade gold along with the reasoning can be found in the how to buy gold section. Additionally, our preferred ETFs and ETNs can be found in our Gold & Silver ETF Ranking.
As a reminder, Gold & Silver Trading Alerts are posted before or on each trading day (we usually post them before the opening bell, but we don't promise doing that each day). If there's anything urgent, we will send you an additional small alert before posting the main one.
=====
Latest Free Trading Alerts:
Yesterday, the U.S. dollar moved sharply lower against its Canadian counterpart, which took the exchange rate to our next downside target. Thanks to the seller’s attack, we noticed a potential pro-bearish formation on the horizon, which can make positions even more profitable…
USD/CAD – Happy and Profitable Bears
=====
Hand-picked precious-metals-related links:
PRECIOUS-Gold slips as fears ease over U.S.-China trade conflict
Gold miners sustaining costs up 22% since the gold price bottomed
=====
In other news:
World stocks advance as trade war worries cool
Dollar bounces as trade war fears fade
Euro-Area Growth Momentum Slows as Economy Pulls Back From Peak
'Even Shooting Wars End in Negotiations.' Wilbur Ross Isn't Worried About a Trade War With China
=====
Thank you.
Sincerely,
Przemyslaw Radomski, CFA
Founder, Editor-in-chief, Gold & Silver Fund Manager
Gold & Silver Trading Alerts
Forex Trading Alerts
Oil Investment Updates
Oil Trading Alerts

