

Briefly: in our opinion, full (300% of the regular position size) speculative short positions in mining stocks are justified from the risk/reward point of view at the moment of publishing this Alert.
In yesterday’s analysis, I wrote that while it seemed unlikely, I wouldn’t rule out a very brief (minutes? hours?) move in gold to even $2,000. Gold didn’t rally so far, but it did move sharply higher yesterday, rallying above $1,950. Will this move hold, or will the 2016 performance repeat itself?
So far, we see indications for the latter. Back in 2016, the outcome of the elections was clear from the start and the market’s reaction was sudden. This year, the outcome is far from being clear and quick. Instead, the uncertainty has been growing steadily since the elections began and it might have reached its peak yesterday. After all, gold moved lower in today’s pre-market trading, the general stock market failed to break above its resistance line and crude oil is declining once again. Plus, the obvious reason – the election count is almost over. Yes, it will likely be disputed, taken to court and so on, but a good portion of uncertainty will be removed once the count is completed.
This means that the analogy to 2016 might still be intact, even though it’s not clearly visible as its being played in slow-motion. Instead of an overnight jump in gold prices and a reversal we got a weekly rally. Did gold reverse yet? This seems quite likely, and even if not, it’s likely to reverse shortly.
Let’s start today’s analysis by examining what happened in the USD Index. Yesterday’s plunge was dramatic, and the USD Index even managed to invalidate its previous short-term breakout. This is bearish, but there are more powerful bullish forces that remain intact, so the above didn’t change the outlook.
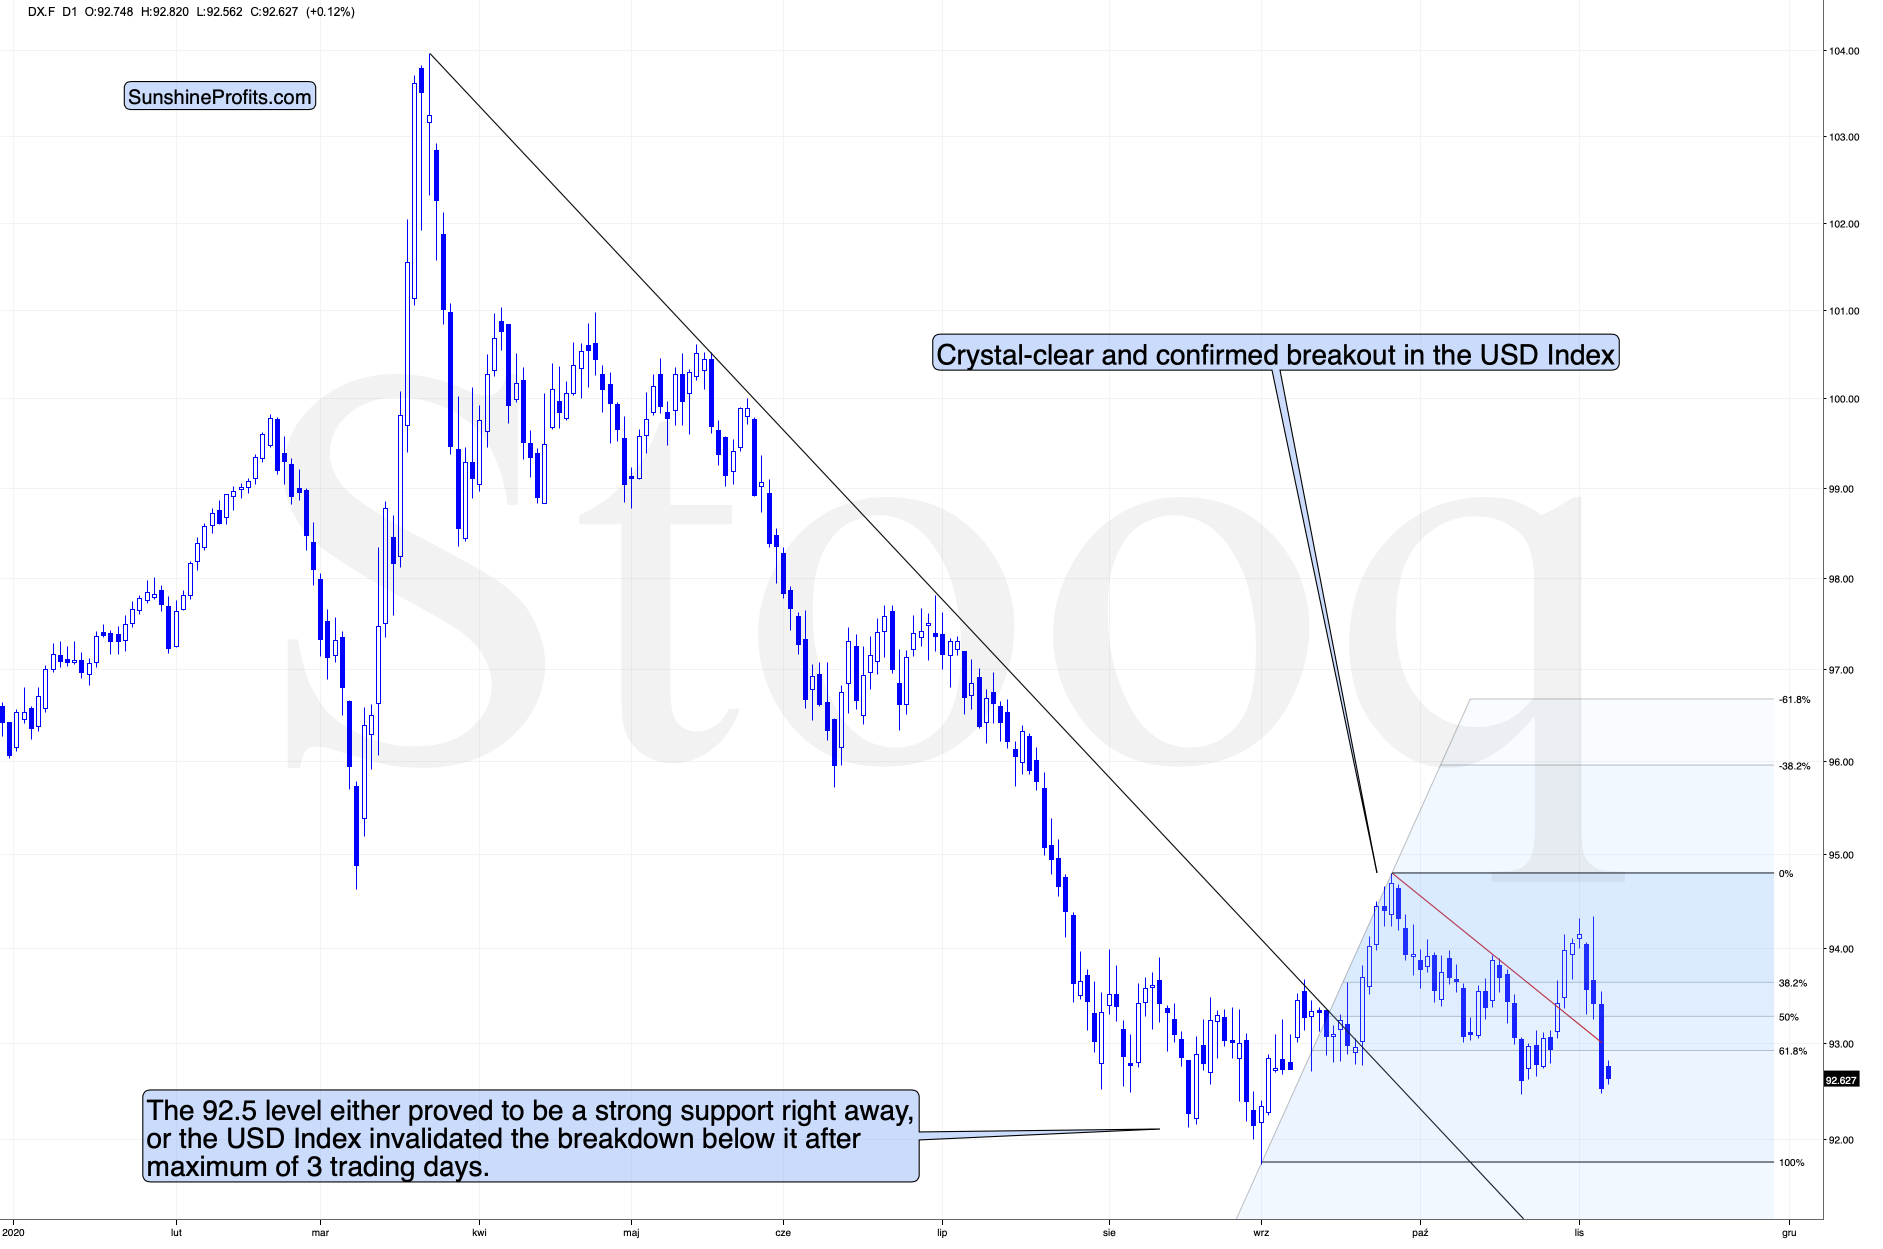
The quite obvious – and important – detail that we see in the above chart is that the USD Index didn’t slide to new lows, let alone the previously broken medium-term declining support line. Short-term indications are not as important as medium or long-term ones…and speaking of the latter – let’s zoom out.
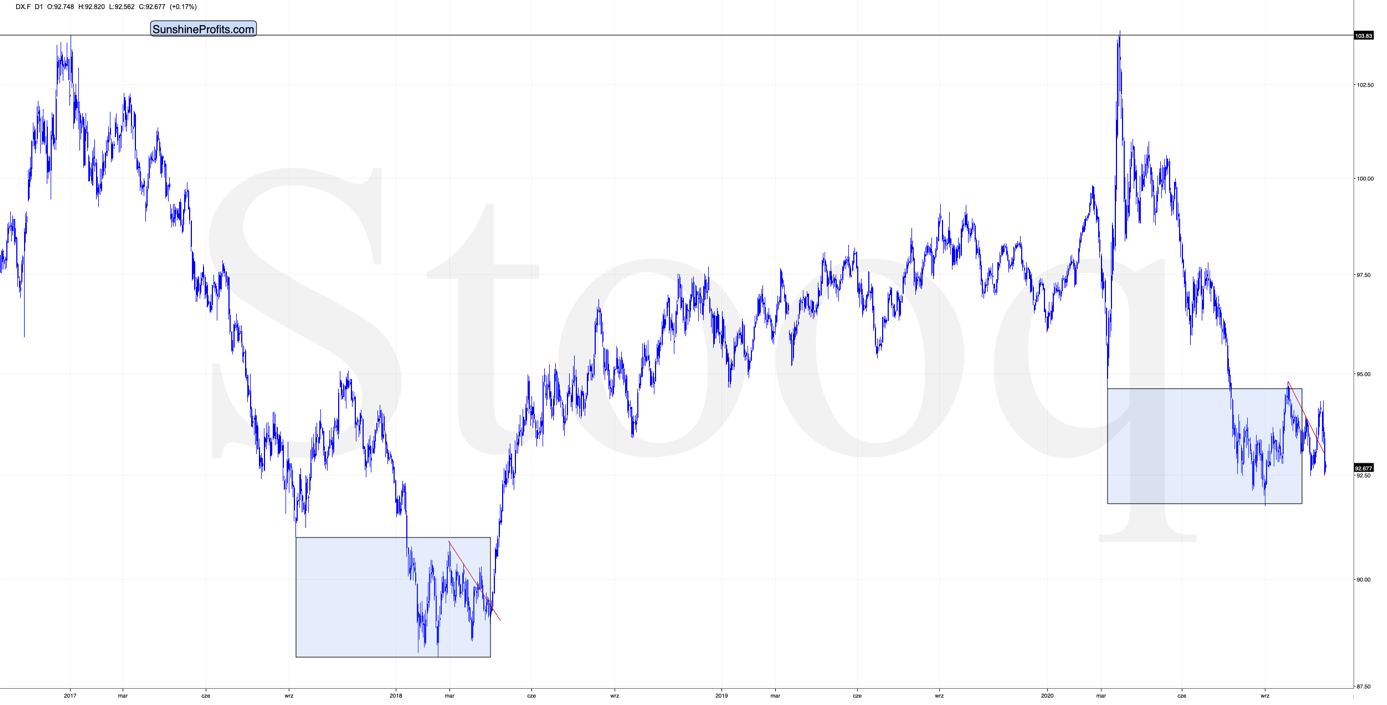
Please note that the shape of the current broad bottom is almost identical to what we saw in early 2018. The rectangles on the above chart are 100% identical. The left rectangle is based on the September 2017 low, the 2018 low, and final low of the broad bottom. Copying this rectangle and attaching it to the March 2020 bottom provides us with an almost 100% precise downside target for the recent low. The follow-up highs (March 2018 and September 2020) are very closely aligned as well.
Moreover, in both cases, the initial bottom was not the final one, but the final one followed shortly. We then saw (again, in both cases), a relatively sharp rally that failed and then another low that was not as low as the previous bottom. Then there was yet another fake rally (and a fake breakout above the declining red resistance line). This breakout was then invalidated and what followed was THE final bottom in the USD Index.
Oh, and both declines started from the same level (about 103.8).
Yes, the situation is as ridiculously similar as I described above. But wait, there’s more!
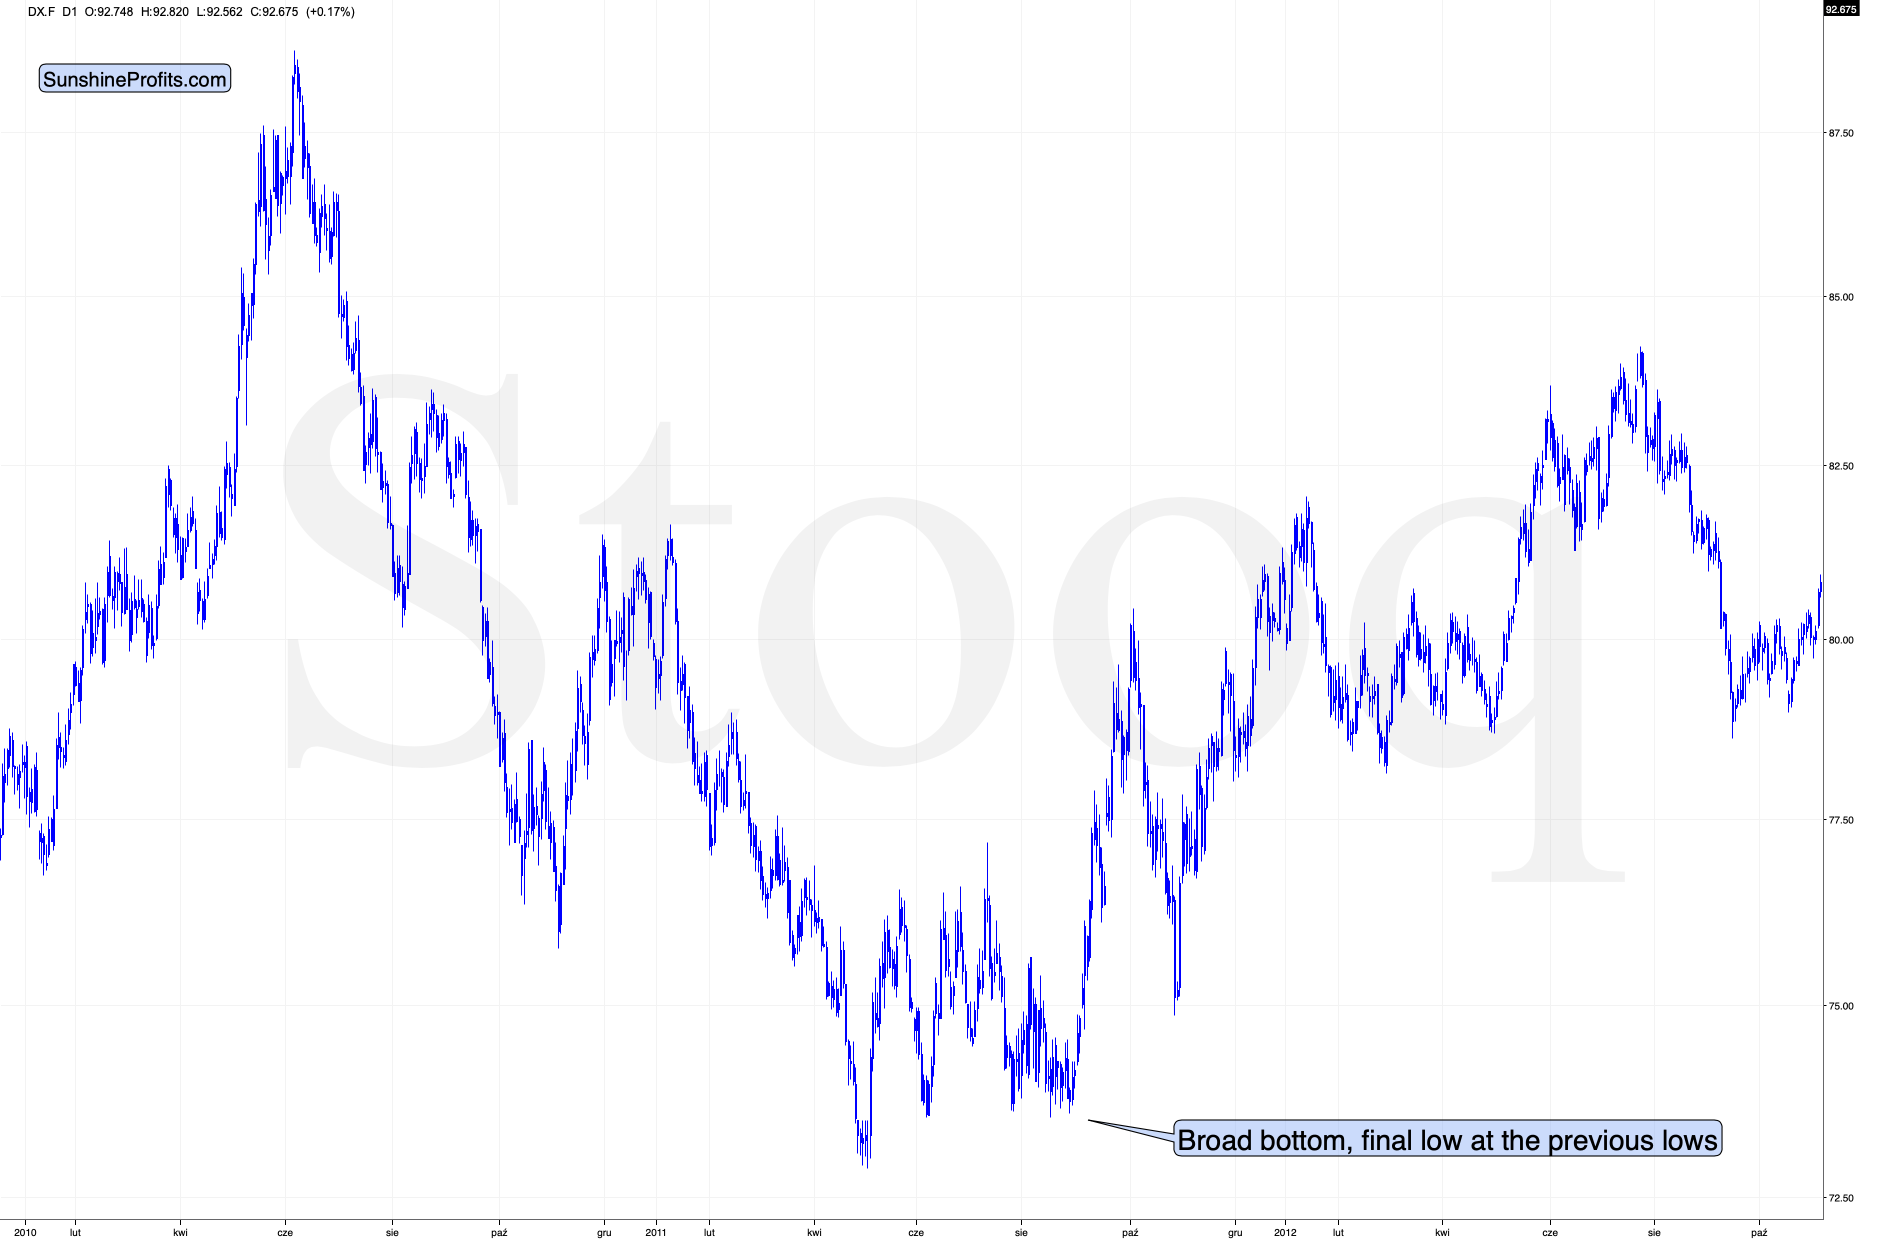
The bottoming pattern in 2011 is also very similar to what we see right now and what we saw earlier this year. The final bottom even took place at the previous lows – just like what we saw yesterday. This analogy is particularly important because August 2011 is when gold formed its multi-year high.
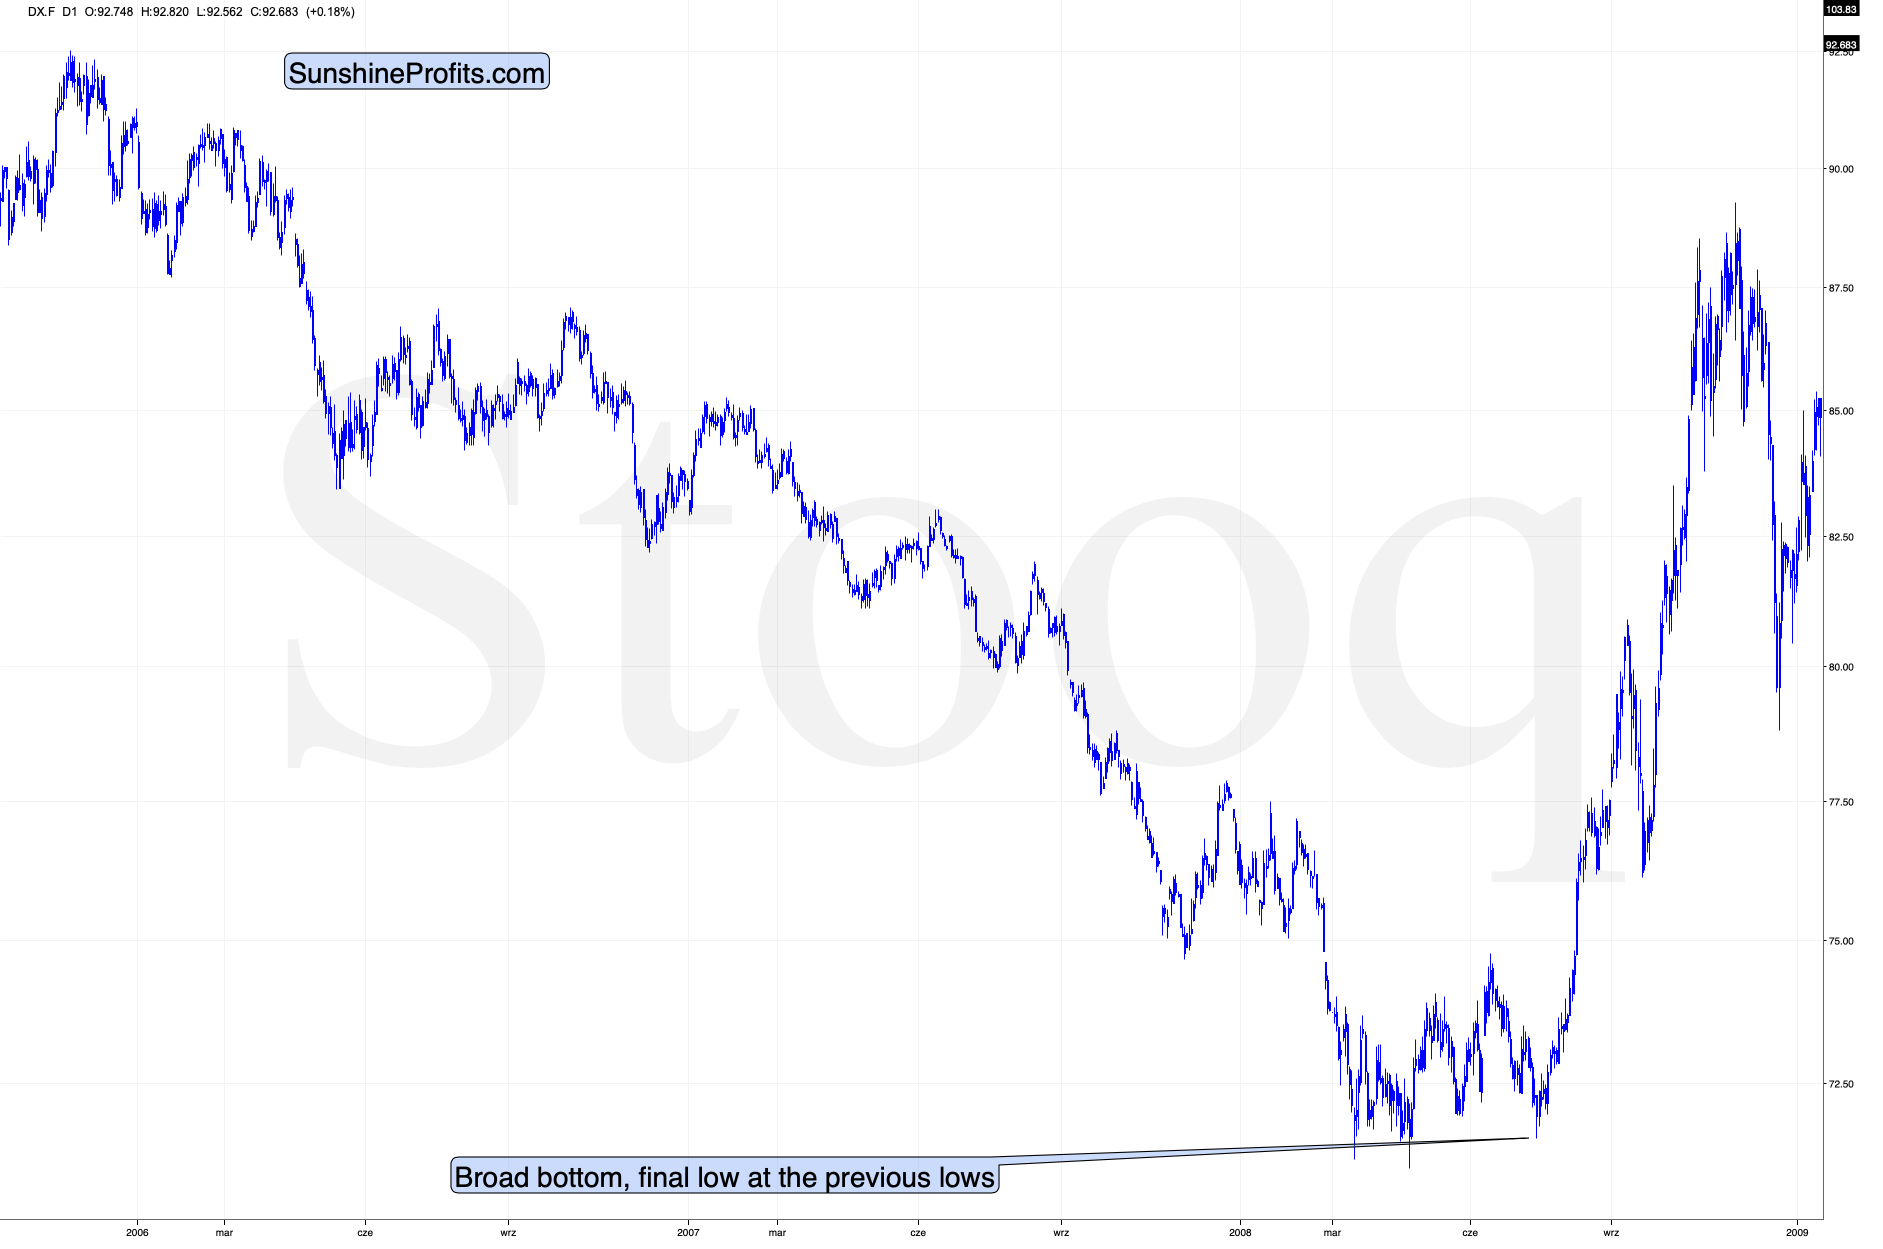
Back in 2008, the USD Index bottomed in a very similar manner. And yes, the final bottom formed close to the previous lows – once again just like what we saw this week.
So, does the invalidation of the short-term breakout in the USD Index really make the outlook bearish right now? In light of the above powerful analogies to the past major bottoms – absolutely not.
And as the USD Index soars, gold is likely to slide.
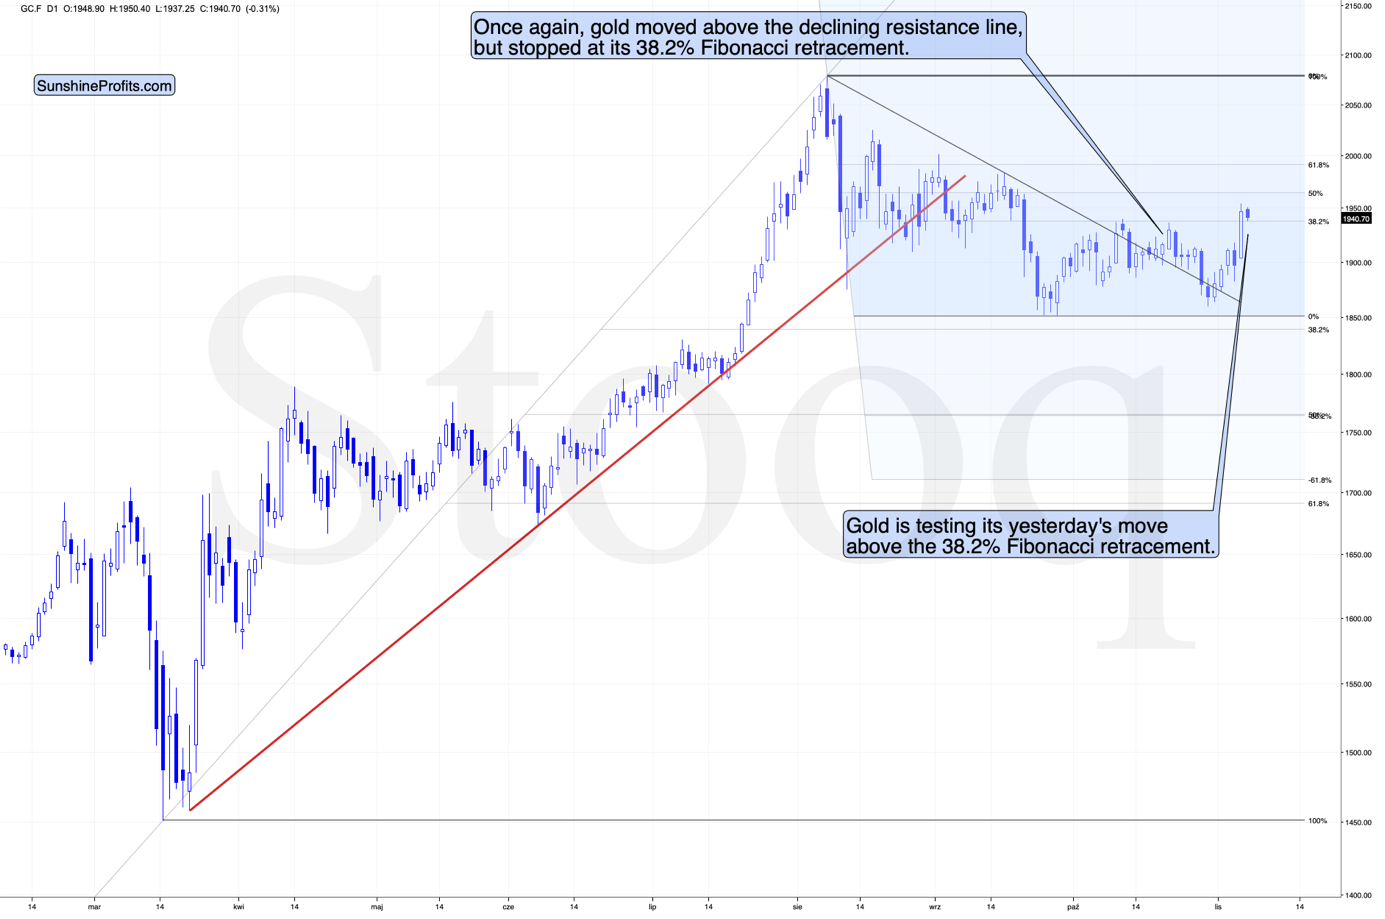
This means that the current test of the 38.2% Fibonacci retracement level (and the October highs) by the gold price is likely to have bearish aftermath.
I previously wrote that gold could rally just before or right after the U.S. elections – that’s what we saw. It doesn’t change the fact that gold seems to have topped above $2,000 earlier this year and has been in decline since then.
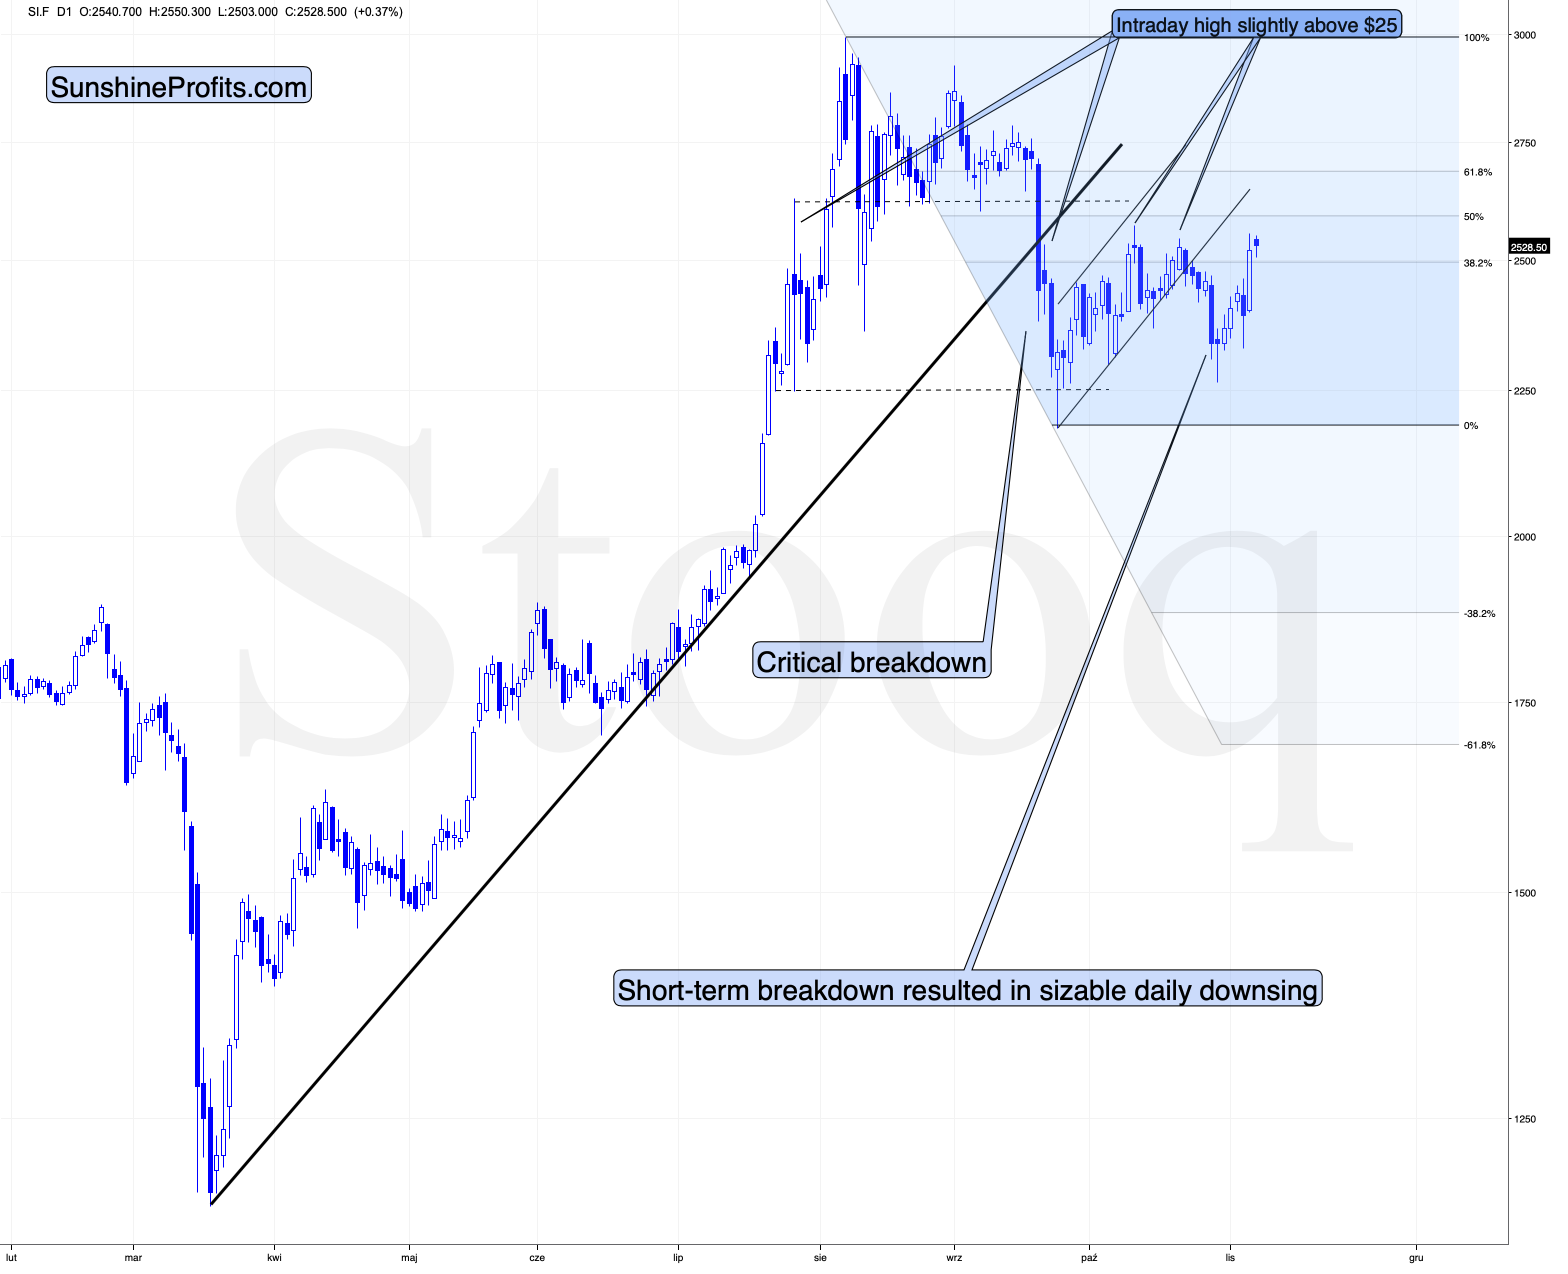
Silver moved sharply higher yesterday, and it rallied more (percentage-wise) than gold. Consequently, my comment yesterday on the white metal remains up-to-date:
At the moment of writing these words, gold is up by 1.22% in today’s pre-market trading, and silver is up by 3.22%.
Considering both: yesterday’s session and today’s pre-market move, silver is up by about 1.4%, and gold is up by about 0.5%.
It’s not a shocking and screaming outperformance, but we can say that the white metal already outperforms gold.
Gold ended yesterday’s session 2.67% up, while silver was up by 5.43%.
I previously wrote that the perfect confirmation for the top would be if silver soared and miners lagged. Did the miners underperform? They definitely didn’t.
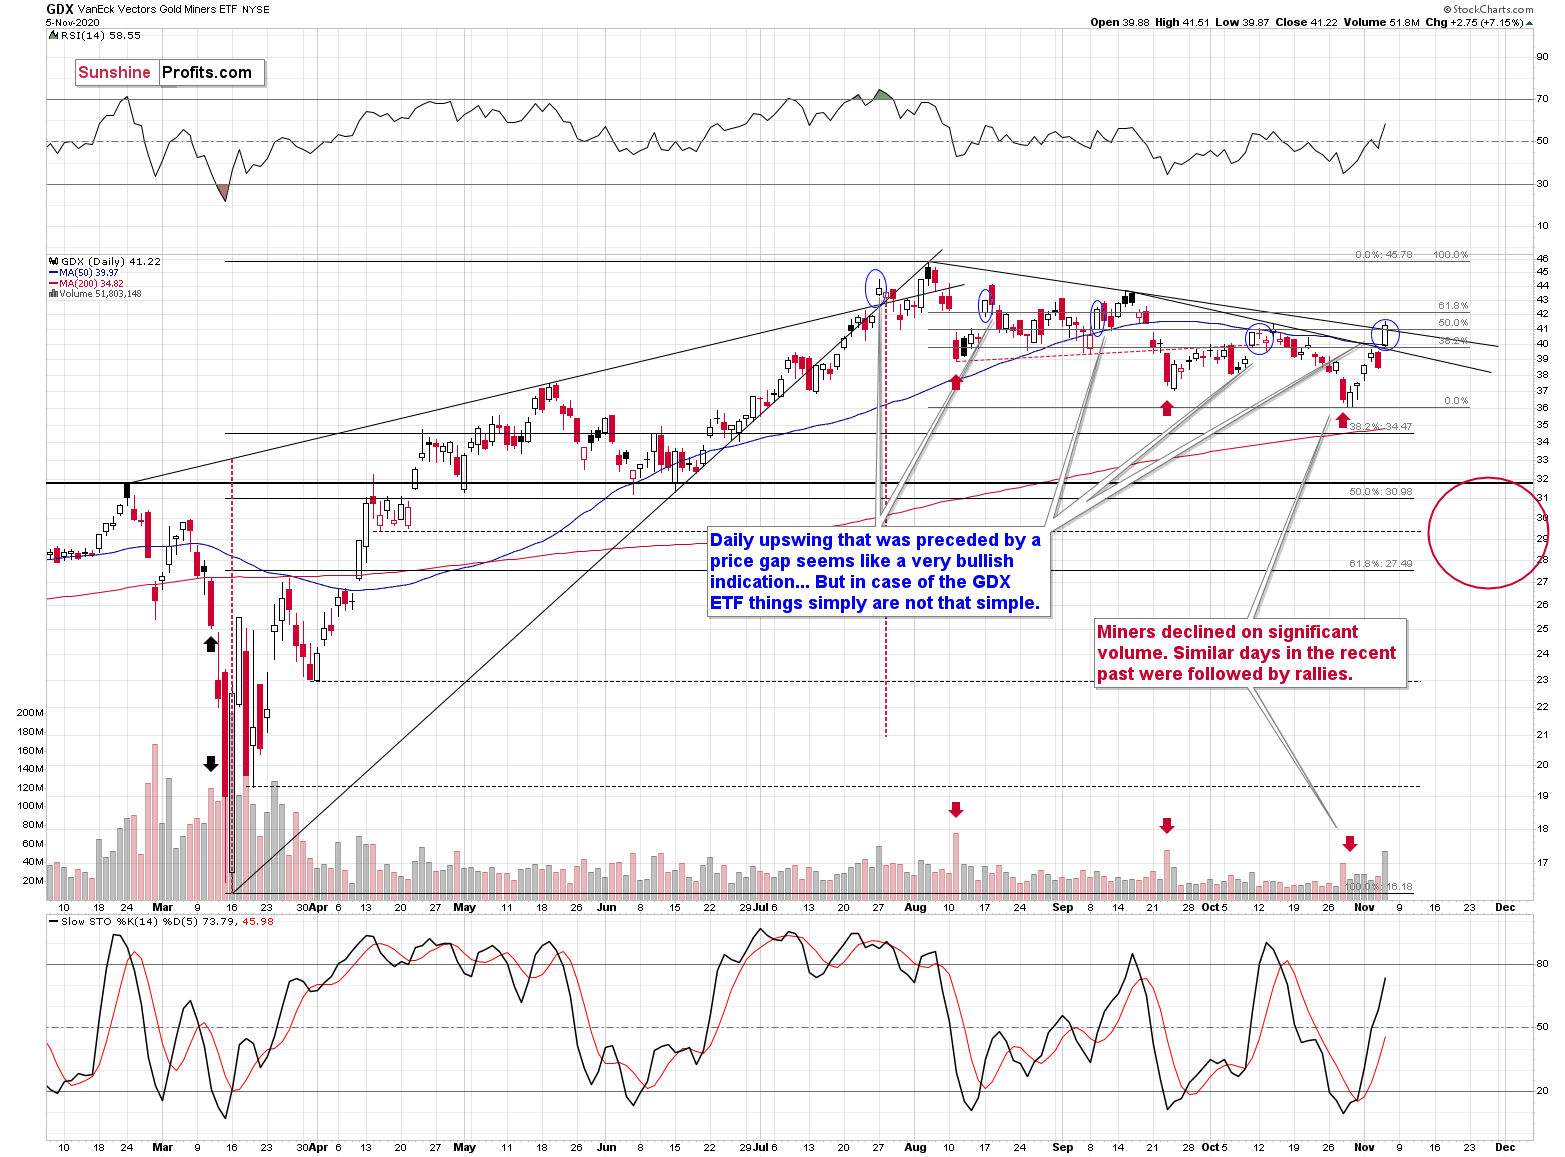
Miners moved and closed slightly above their 50% retracement of the preceding decline, the declining resistance line based on the August and September highs, and the October highs. The breakout was tiny, so it would require a confirmation. I expect to see its invalidation instead, especially given today’s (so far just small, but still relevant) decline in gold and the very bullish medium-term outlook in the USDX.
Even if miners didn’t form a top yesterday, they are likely very close to it, as they once again rallied in the manner that is similar to other sessions that we marked with blue ellipses on the chart. The daily upswing on relatively strong volume that was preceded by a price gap is bullish in theory, but in practice this meant that a downturn was just around the corner 4 times out of 4, when we saw such a combination in the last few months. Consequently, the implications are not really bullish here.
Also, let’s keep in mind that the general stock market performed very strongly this week, but it reversed after reaching a resistance line based on the previous highs.
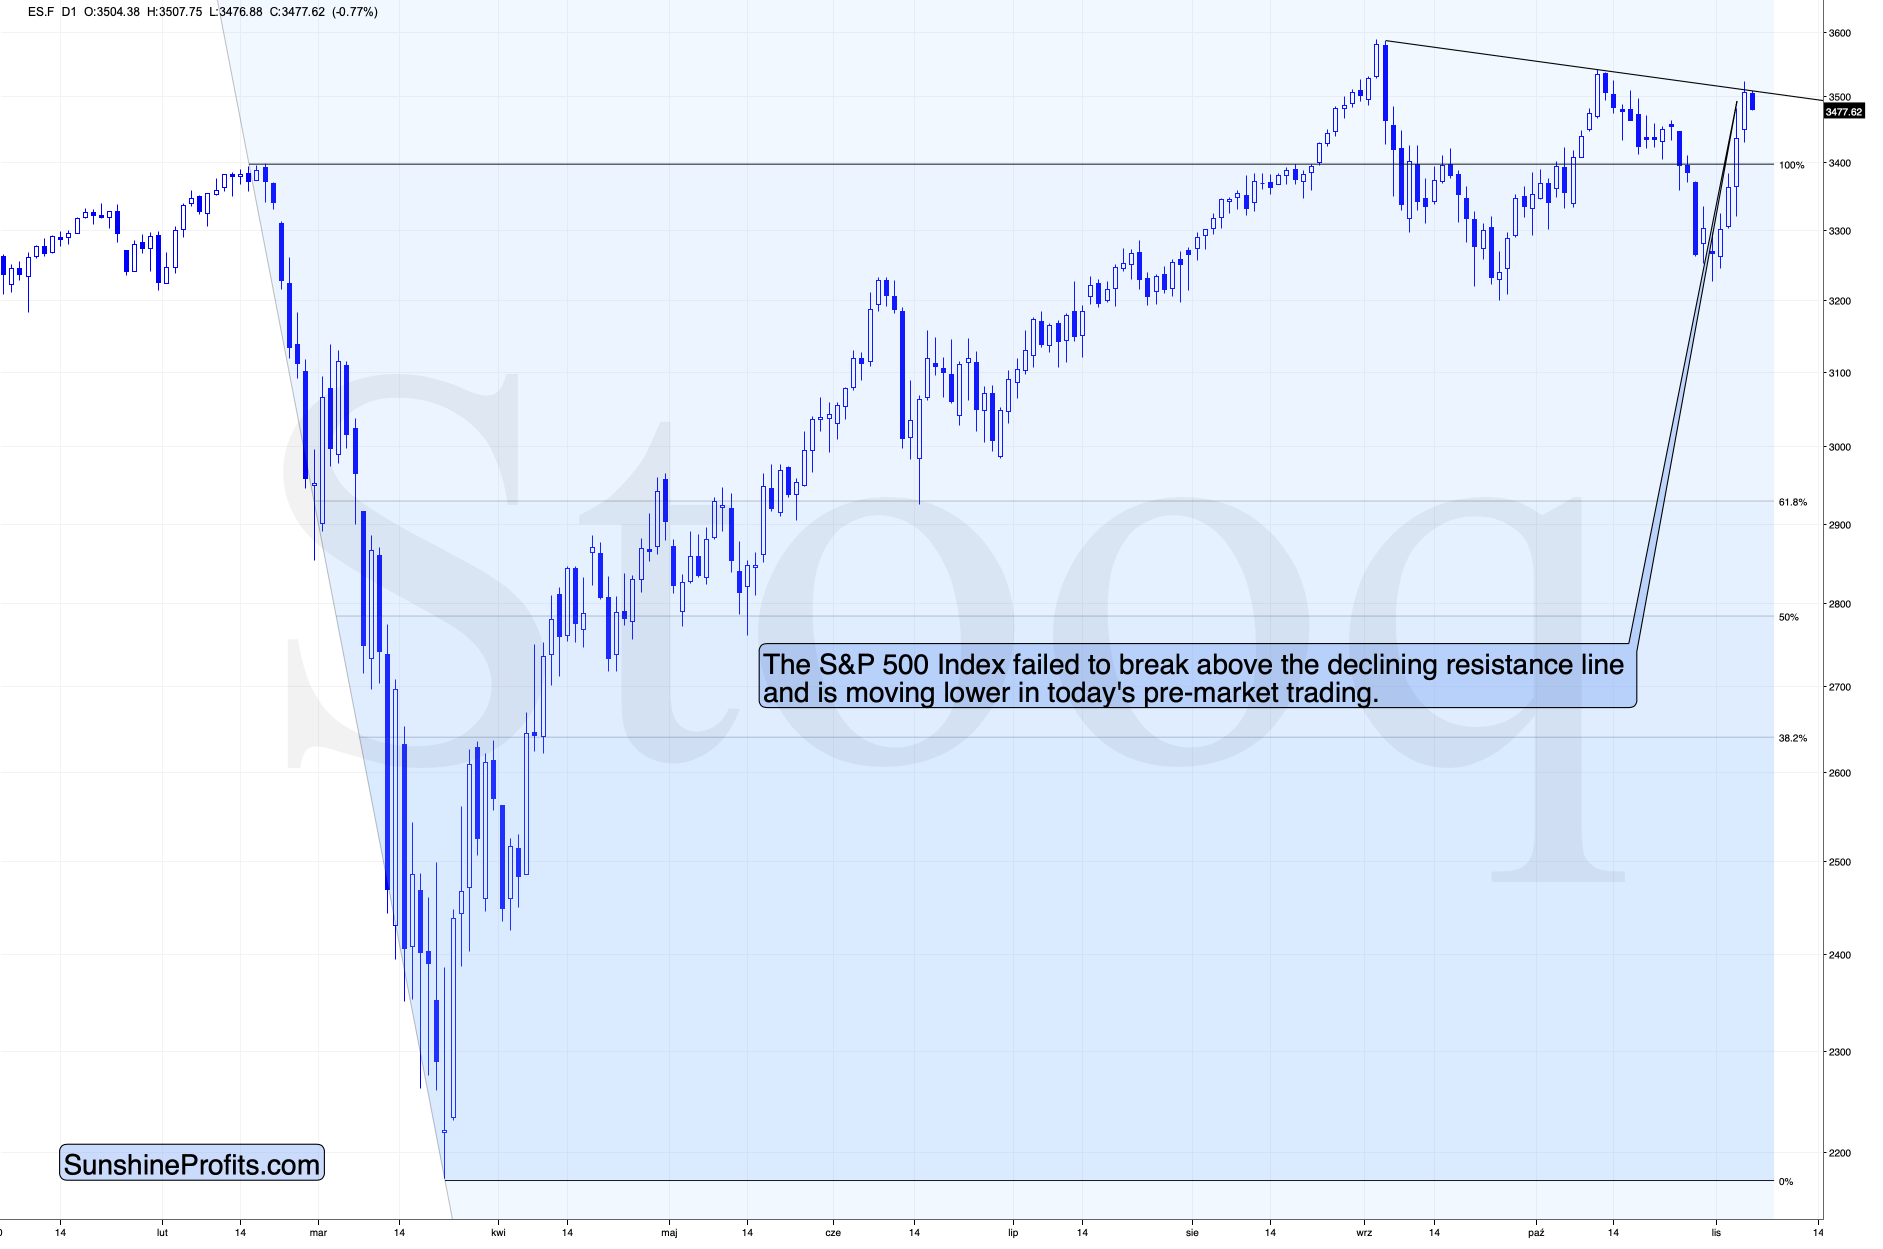
This could mean that the rally is over and the bullish push that miners got from the general stock market is about to turn into a bearish pull.
However, even without the above, the outlook for miners would be bleak, especially given all the similarities in the USD Index to previous major bottoms.
Overview of the Upcoming Decline
As far as the current overview of the upcoming decline is concerned, I think it has already begun.
During the final part of the slide (which could end later than in 6 weeks, perhaps near the end of the year – just like it happened in 2015), we expect silver to decline more than miners. That would align with how the markets initially reacted to the Covid-19 threat.
The impact of all the new rounds of money printing in the U.S. and Europe on the precious metals prices is incredibly positive in the long run, which does not make the short-term decline improbable. Markets can and will get ahead of themselves and decline afterward – sometimes very profoundly – before continuing with their upward climb.
The plan is to exit the current short positions in miners after they decline far and fast, but at the same time, silver drops just “significantly” (we expect this to happen in 0 – 5 weeks). In other words, the decline in silver should be severe, but the decline in the miners should look “ridiculous”. That’s what we did in March when we bought practically right at the bottom. It is a soft, but at the same time, broad instruction, so additional confirmations are necessary.
I expect this confirmation to come from gold, reaching about $1,800. If – at the same time – gold moves to about $1,800 and miners are already after a ridiculously big drop (say, to $31 - $32 in the GDX ETF – or lower), we will probably exit the short positions in the miners and at the same time enter short positions in silver. It will be tempting to wait with opening the short position in silver until the entire sector rebounds, but such a rebound could last only a couple of hours, so it would be challenging to successfully execute such a strategy.
The precious metals market's final bottom is likely to take shape when gold shows significant strength relative to the USD Index. It could take the form of a gold’s rally or a bullish reversal, despite the ongoing USD Index rally.
Summary
Summing up, the next big move in the precious metals market is likely to be towards the downside, but how metals, miners and the USD Index are behaving right now as well as the analogy to 2016 (previous presidential elections in the U.S.) suggest that we might see one final pop up higher in the next few days (more likely - hours) before the slide gains momentum.
Considering gold's breakout invalidation above the 2011 highs, it's evident that the big rally (that ended $4 above our upside target) is entirely over. Given this invalidation and the confirmed USD Index breakout, gold will probably slide much lower over the next few weeks. There are indications that the corrective upswing in the precious metals market and the pullback in the USDX are close to being over. Thus, the decline could resume any day – or hour – now.
Naturally, everyone's trading is their responsibility. But in our opinion, if there ever was a time to either enter a short position in the miners or increase its size if it was not already sizable, it's now. We made money on the March decline and on the March rebound, with another massive slide already underway.
After the sell-off (that takes gold to about $1,700 or lower), we expect the precious metals to rally significantly. The final decline might take as little as 1-6 weeks, so it's important to stay alert to any changes.
Most importantly, please stay healthy and safe. We made a lot of money on the March decline and the subsequent rebound (its initial part) price moves (and we'll likely earn much more in the following weeks and months), but you have to be healthy to enjoy the results.
As always, we'll keep you - our subscribers - informed.
To summarize:
Trading capital (supplementary part of the portfolio; our opinion): Full speculative short positions (300% of the full position) in mining stocks is justified from the risk to reward point of view with the following binding exit profit-take price levels:
Senior mining stocks (price levels for the GDX ETF): binding profit-take exit price: $32.02; stop-loss: none (the volatility is too big to justify a SL order in case of this particular trade); binding profit-take level for the DUST ETF: $28.73; stop-loss for the DUST ETF: none (the volatility is too big to justify a SL order in case of this particular trade)
Junior mining stocks (price levels for the GDXJ ETF): binding profit-take exit price: $42.72; stop-loss: none (the volatility is too big to justify a SL order in case of this particular trade); binding profit-take level for the JDST ETF: $21.22; stop-loss for the JDST ETF: none (the volatility is too big to justify a SL order in case of this particular trade)
For-your-information targets (our opinion; we continue to think that mining stocks are the preferred way of taking advantage of the upcoming price move, but if for whatever reason one wants / has to use silver or gold for this trade, we are providing the details anyway. In our view, silver has greater potential than gold does):
Silver futures downside profit-take exit price: unclear at this time - initially, it might be a good idea to exit, when gold moves to $1,703.
Gold futures downside profit-take exit price: $1,703
Long-term capital (core part of the portfolio; our opinion): No positions (in other words: cash
Insurance capital (core part of the portfolio; our opinion): Full position
Whether you already subscribed or not, we encourage you to find out how to make the most of our alerts and read our replies to the most common alert-and-gold-trading-related-questions.
Please note that we describe the situation for the day that the alert is posted in the trading section. In other words, if we are writing about a speculative position, it means that it is up-to-date on the day it was posted. We are also featuring the initial target prices to decide whether keeping a position on a given day is in tune with your approach (some moves are too small for medium-term traders, and some might appear too big for day-traders).
Additionally, you might want to read why our stop-loss orders are usually relatively far from the current price.
Please note that a full position doesn't mean using all of the capital for a given trade. You will find details on our thoughts on gold portfolio structuring in the Key Insights section on our website.
As a reminder - "initial target price" means exactly that - an "initial" one. It's not a price level at which we suggest closing positions. If this becomes the case (like it did in the previous trade), we will refer to these levels as levels of exit orders (exactly as we've done previously). Stop-loss levels, however, are naturally not "initial", but something that, in our opinion, might be entered as an order.
Since it is impossible to synchronize target prices and stop-loss levels for all the ETFs and ETNs with the main markets that we provide these levels for (gold, silver and mining stocks - the GDX ETF), the stop-loss levels and target prices for other ETNs and ETF (among other: UGLD, DGLD, USLV, DSLV, NUGT, DUST, JNUG, JDST) are provided as supplementary, and not as "final". This means that if a stop-loss or a target level is reached for any of the "additional instruments" (DGLD for instance), but not for the "main instrument" (gold in this case), we will view positions in both gold and DGLD as still open and the stop-loss for DGLD would have to be moved lower. On the other hand, if gold moves to a stop-loss level but DGLD doesn't, then we will view both positions (in gold and DGLD) as closed. In other words, since it's not possible to be 100% certain that each related instrument moves to a given level when the underlying instrument does, we can't provide levels that would be binding. The levels that we do provide are our best estimate of the levels that will correspond to the levels in the underlying assets, but it will be the underlying assets that one will need to focus on regarding the signs pointing to closing a given position or keeping it open. We might adjust the levels in the "additional instruments" without adjusting the levels in the "main instruments", which will simply mean that we have improved our estimation of these levels, not that we changed our outlook on the markets. We are already working on a tool that would update these levels daily for the most popular ETFs, ETNs and individual mining stocks.
Our preferred ways to invest in and to trade gold along with the reasoning can be found in the how to buy gold section. Furthermore, our preferred ETFs and ETNs can be found in our Gold & Silver ETF Ranking.
As a reminder, Gold & Silver Trading Alerts are posted before or on each trading day (we usually post them before the opening bell, but we don't promise doing that each day). If there's anything urgent, we will send you an additional small alert before posting the main one.
Thank you.
Sincerely,
Przemyslaw Radomski, CFA
Editor-in-chief, Gold & Silver Fund Manager

