

Briefly: in our opinion, full (300% of the regular position size) speculative short positions in mining stocks are justified from the risk/reward point of view at the moment of publishing this Alert.
Gold plunged, silver declined, and mining stocks closed at new yearly lows. In other words, the bearish trend continues in tune with my warnings.
Let’s start today’s analysis with what I wrote about the USD Index yesterday:
The USD Index moved higher yesterday, and the precious metals sector didn’t decline, which might be viewed as a sign of strength of the latter, but I don’t see it in this way. Why? Because yesterday’s session was an exception from the rule due to the importance of the news that accompanied it – the Fed’s decisions and comments. These days tend to be rich in sudden price swings in all directions, as investors and traders try to guess what the news is going to be, and then they are unsure how to react to the news when it finally hits the market. Consequently, yesterday’s lack of declines in the PMs is not a sign of their strength – it was likely a more-or-less random kind of reaction. If we see more of that, the implications might change, but that’s not the case right now.
However, instead of a bullish confirmation, we saw a gargantuan bearish confirmation.
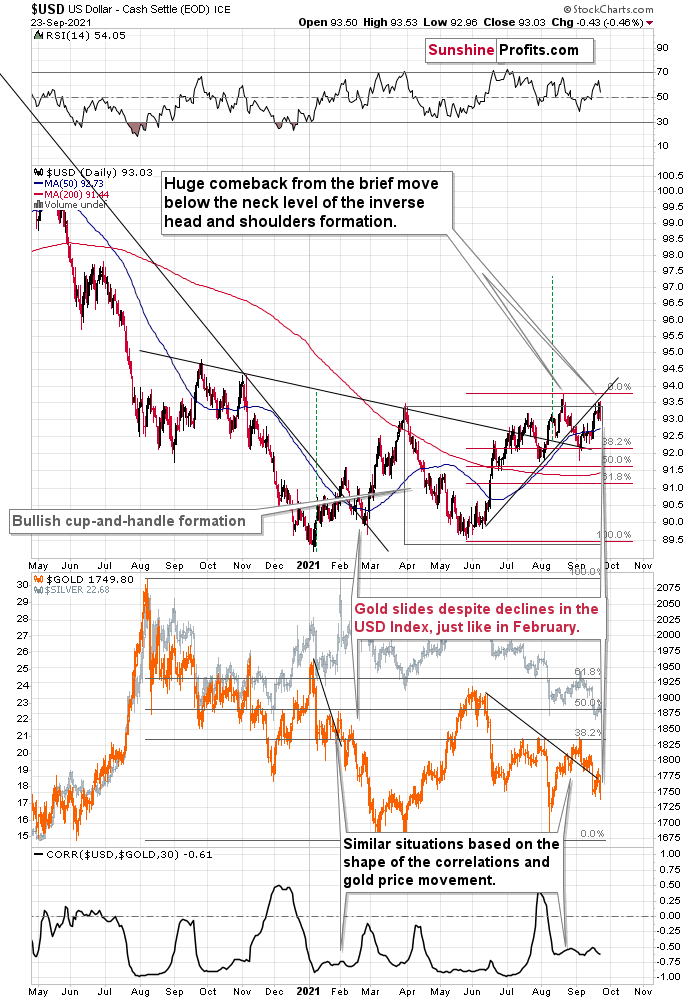
The USD Index declined by 0.43 and gold – instead of rallying, which would have been normal – declined by almost $30. Moreover, by declining that much, it once again moved below the declining support/resistance line, telling us that the previous breakdown was not accidental.
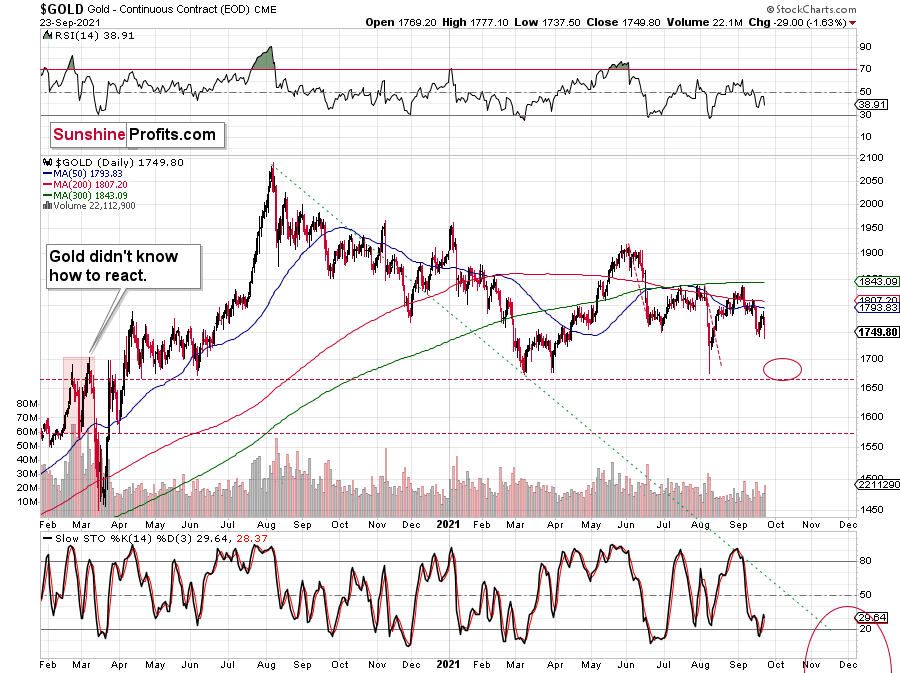
Gold closed the day at new monthly lows, but still relatively far from its previous 2021 lows. Don’t worry – it’s very likely to get there, and the back-and-forth type of decline is nothing bullish. In fact, it makes the current situation even more similar to what we saw in 2013.
What Did We See?
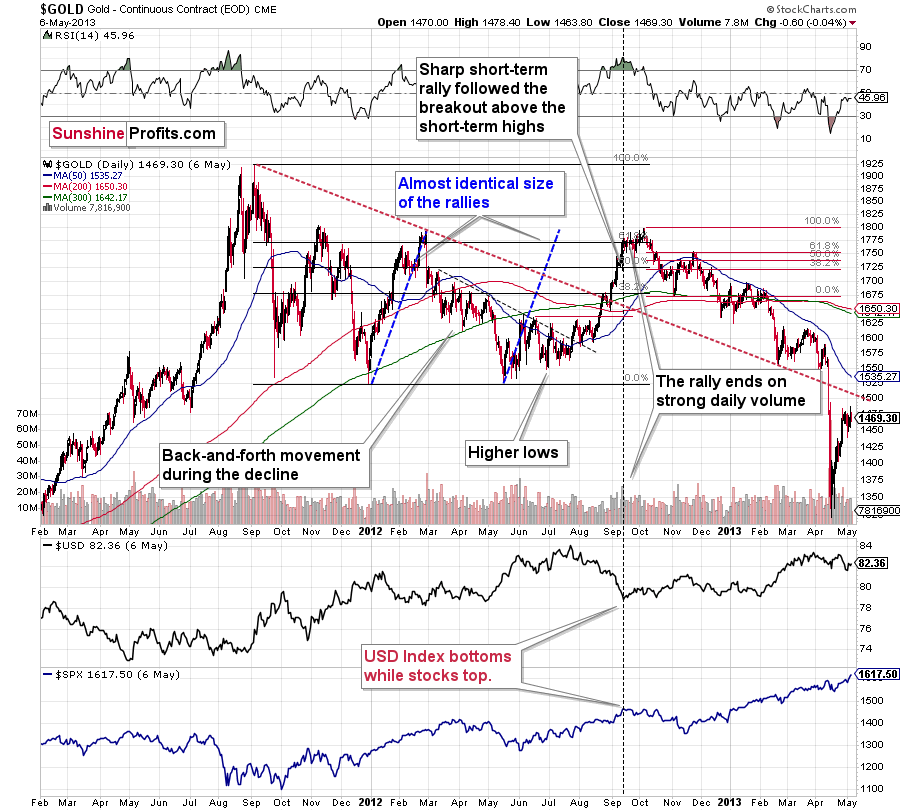
Between September 2012 and February 2013, gold declined in a back-and-forth manner as well, and the current situation seems to be analogous to what we saw in February 2013. At the time, the final short-term upswing took gold to its 50-day moving average (marked with blue), and we saw something very similar recently. The recent high ($1788.40) was very close to gold’s 50-day moving average too – less than $10 from it.
You can see the comparison even more clearly in the video that I posted on Wednesday (Sep. 22) – on a side note, I was recording this when gold was moving higher, right to its Sep. 22 top. So, it turns out that I said that gold might top close to its 50-day moving average instead of rallying higher, right before exactly that happened.
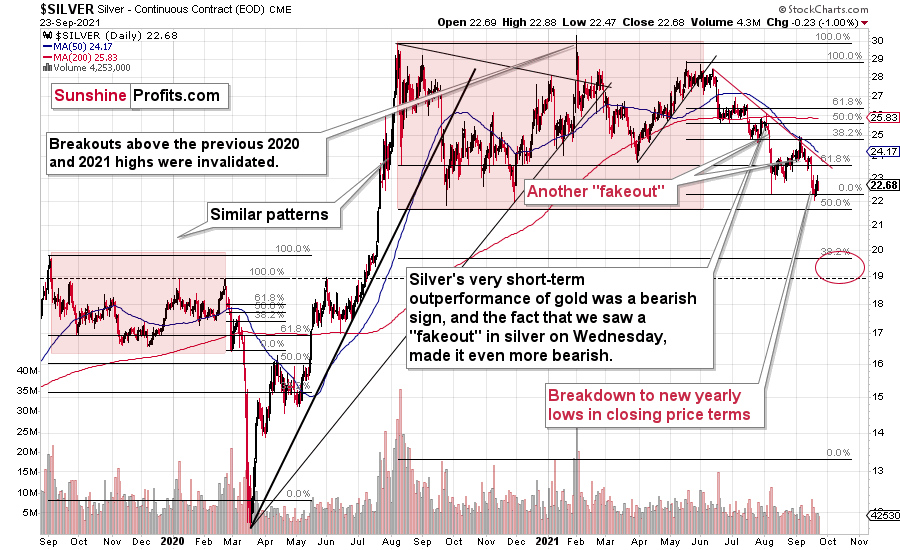
Silver didn’t decline to new yearly lows, but that’s not as important as the fact that it was unable to get back above the previous yearly lows. Consequently, the outlook for silver remains bearish even without considering all the other (non-silver-price-based) factors.
Gold Stocks
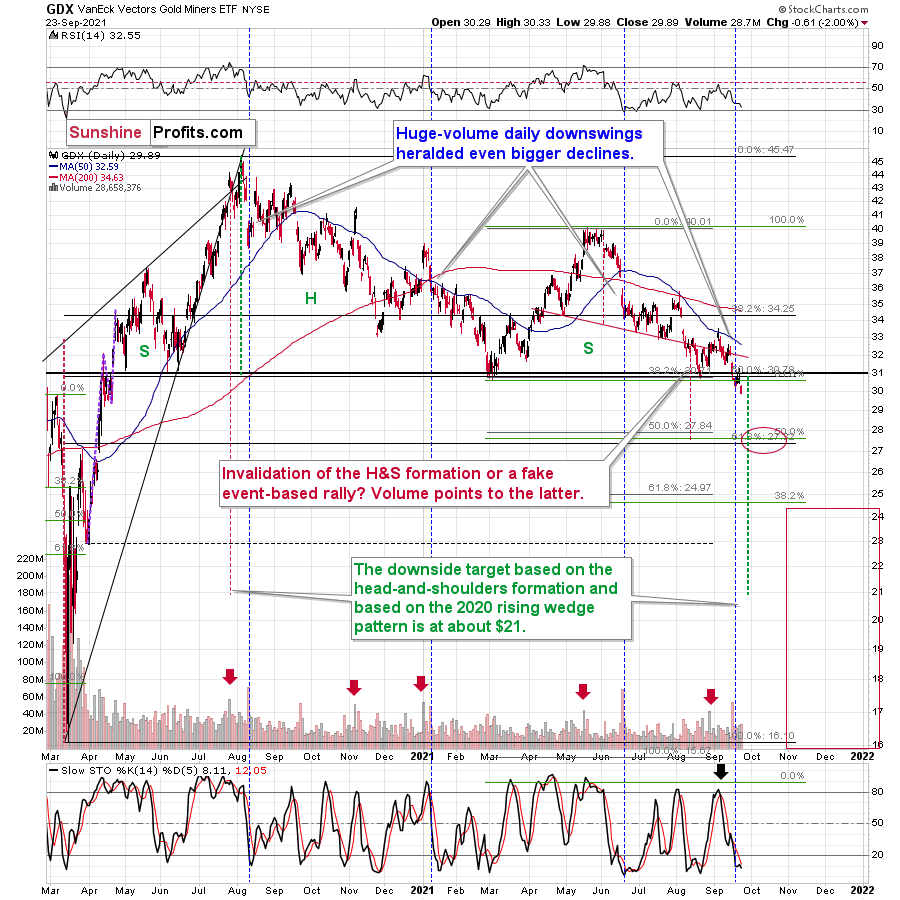
Gold stocks – the GDX ETF – closed at new 2021 lows, and it happened shortly after the ETF confirmed the breakdown below its March and August 2021 lows. That’s exactly what was likely to happen, and that’s exactly what one would expect as the first step of a bigger decline.
My previous downside target of ~$28 for the GDX ETF remains up-to-date (in fact, GDX might bottom a bit below that). Naturally, that’s just a temporary downside target after which we might see a breather and then another, even bigger slide.
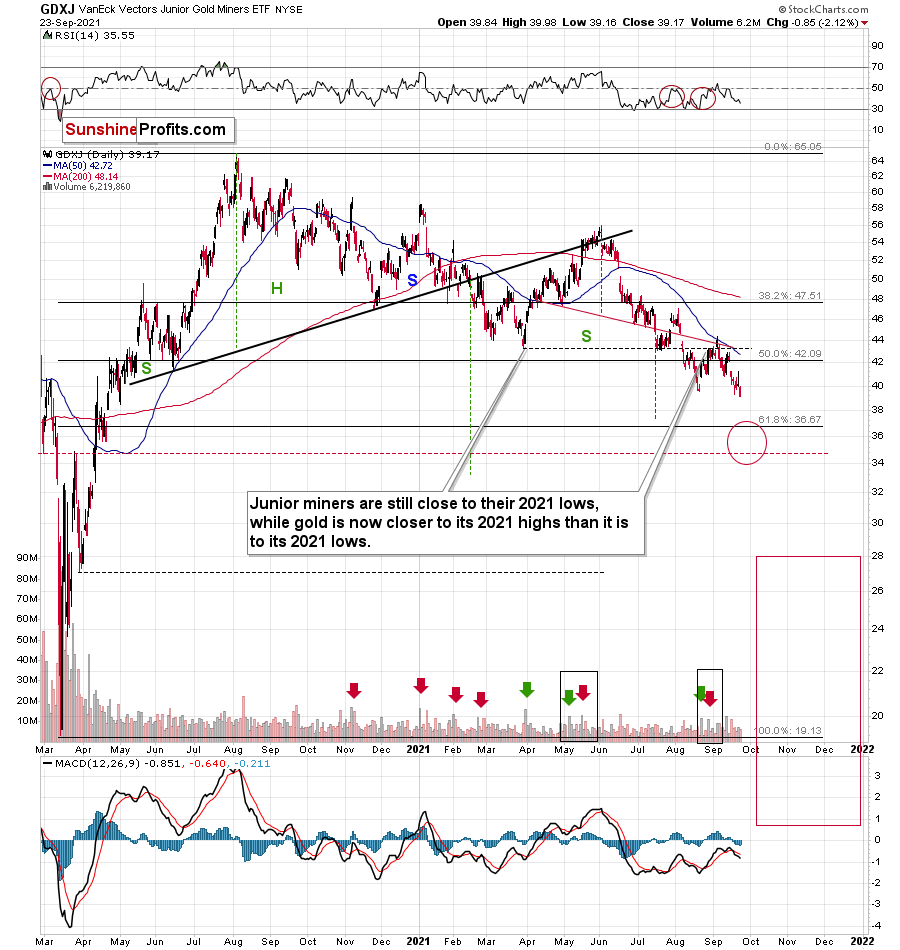
Junior mining stocks broke and closed at new 2021 lows too. The outlook for both (senior and junior miners) is clearly bearish.
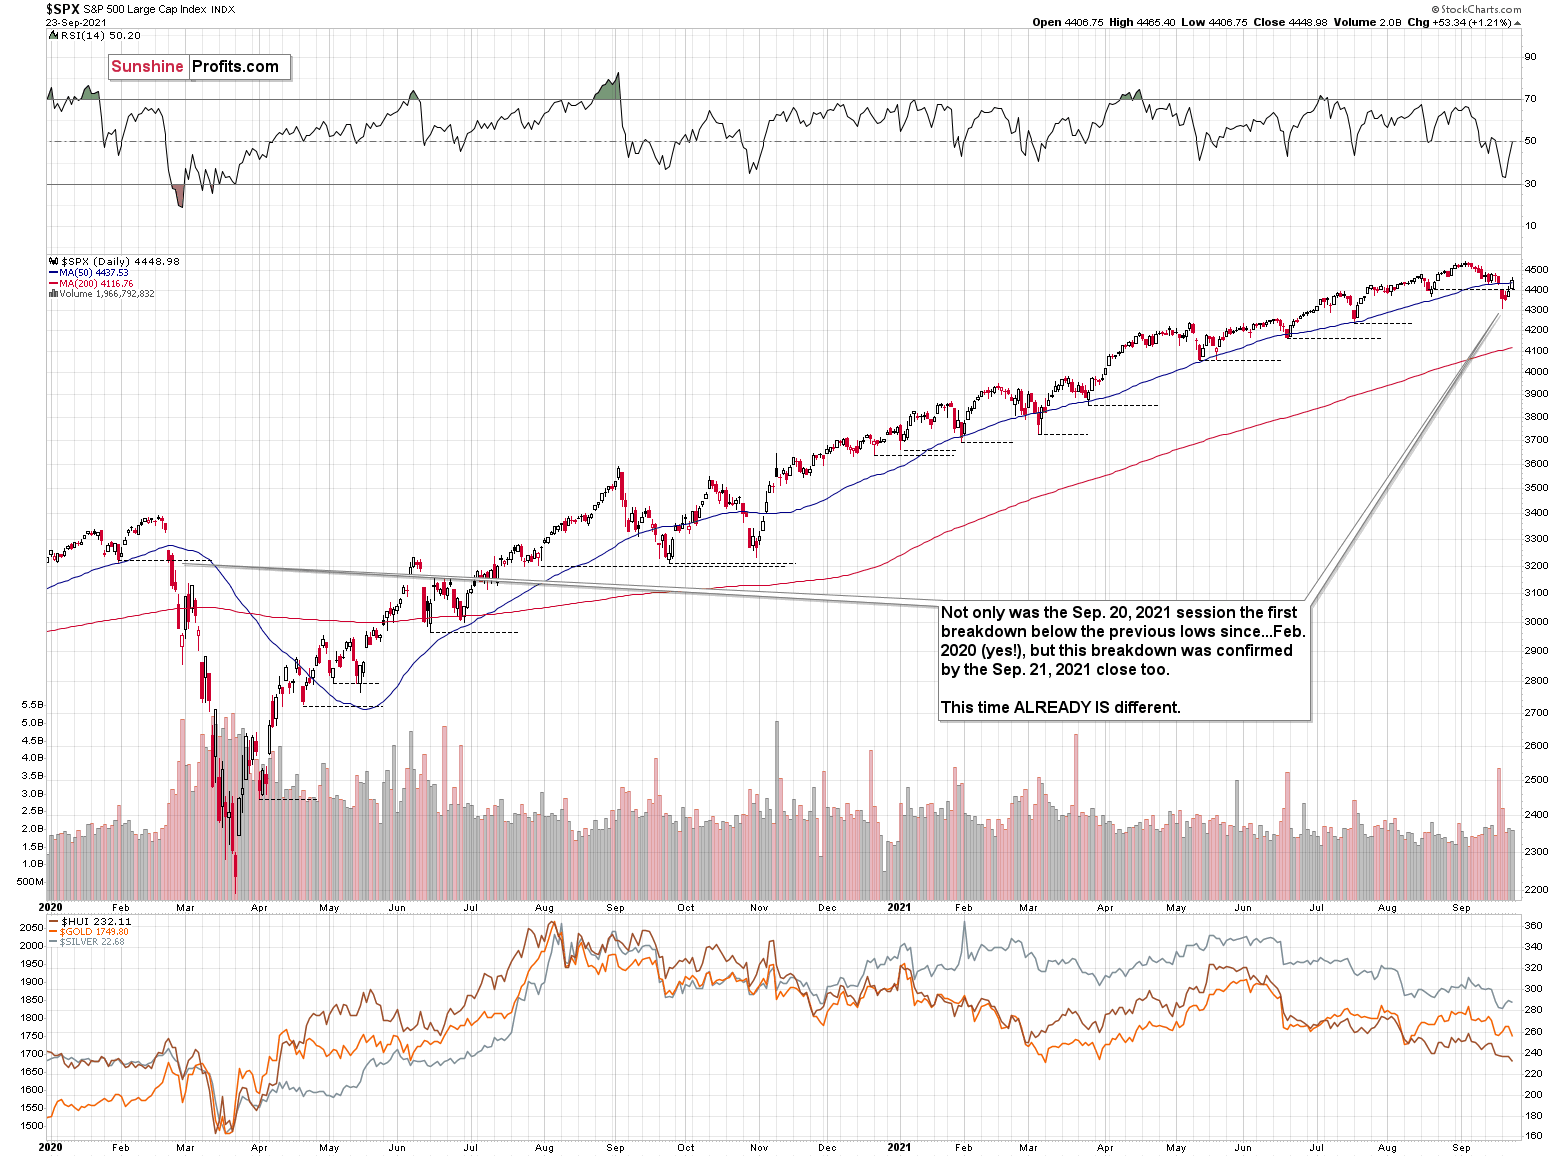
The stock market invalidated the breakdown below the previous lows, so the technical situation here improved. Nonetheless, due to two closes below the previous lows, the situation is already different than it was before. Perhaps stocks are forming a head and shoulders pattern here, but it’s too early to say so with certainty.
What is certain, however, is that a decline in stocks is not necessary for the precious metals sector (including miners) to decline – they did exactly that yesterday.
Summing up, the outlook for the next few months for the precious metals sector remains very bearish, and it seems that the profits on our short position in the junior mining stocks (already substantial) will become even bigger in the future.
Having said that, let’s move to the fundamental part of today’s analysis.
The Double-Edged Sword
While the USD Index gave back all of its Fed-induced gains on Sep. 23, the U.S. 10-Year Treasury yield recouped all of its losses and then some. And with the U.S. yield curve pouring on the pain on Sep. 23, the bloodbath helped drown gold, silver and mining stocks.
Please see below:
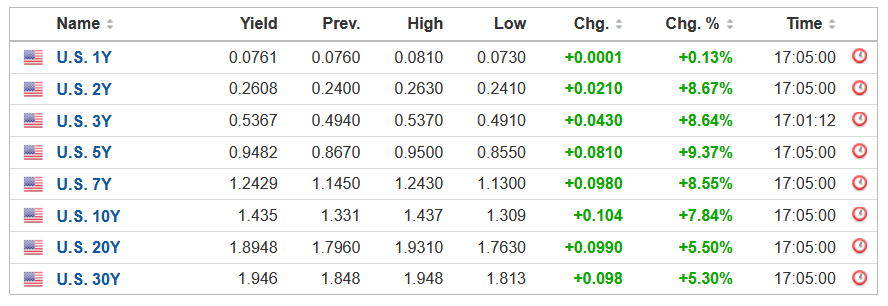 Source: Investing.com
To that point, while the two-headed monster takes turns wreaking fundamental havoc on the PMs, the daily grind has the metals increasingly exhausted. For example, the USD Index soared on Sep. 22, while gold and the U.S. 10-Year Treasury yield declined. Conversely, the U.S. 10-Year Treasury yield soared on Sep. 23, while gold and the USD Index declined. The common denominator? The yellow metal only has a small fundamental window in which consistent rallies can occur.
Please see below:
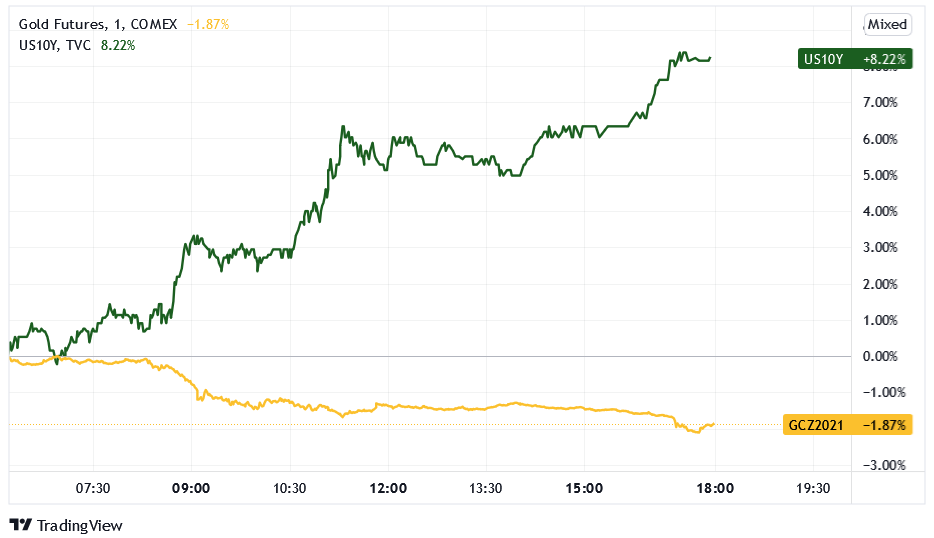
To explain, the gold line above tracks the gold futures price, while the green line above tracks the U.S. 10-Year Treasury yield. If you analyze the left side of the chart, you can see that the latter began its ascent at roughly 7 a.m. ET. And with anxious gold investors throwing in the towel soon after, it was the U.S. yield curve’s turn to play the fundamental villain on Sep. 23.
What’s more, with the U.S. 10-Year Treasury yield closing at its highest level since Jul. 5, the long-end sell-off signals renewed faith in the U.S. economic recovery. And with a ‘rally, consolidate, rally’ scenario also present following the global financial crisis (GFC), we may be in the midst of this version’s second leg higher.
Please see below:
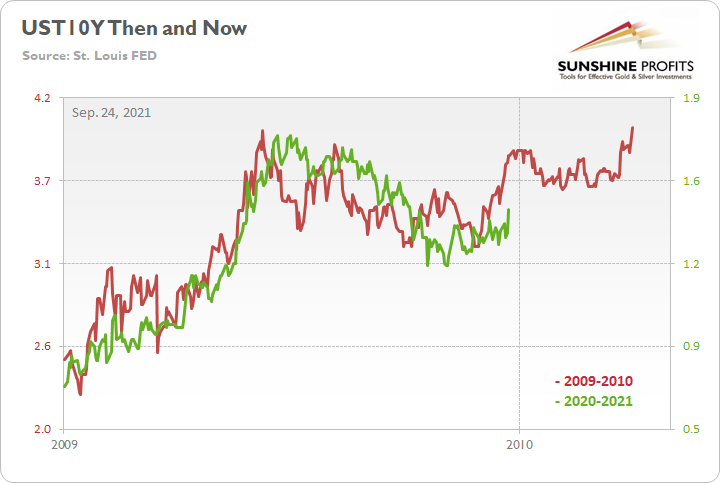
To explain, the red line above tracks the U.S. 10-Year Treasury yield’s rally off of the bottom in 2009-2010, while the green line above tracks the U.S. 10-Year Treasury yield’s current move. If you analyze the fits and starts, you can see that excessive optimism often gives way to excessive pessimism. However, after the dust settled in 2009, the U.S. 10-Year Treasury yield continued its uptrend and ultimately made a new high. For context, the yield fell off a cliff in April 2010 before another sharp rally ensued in October 2010 (which recouped most of the losses). However, the important point is that the second cliff arrived roughly four months after the U.S. 10-Year Treasury yield recorded its second bottom. As a result, with the pace of the current economic recovery tracking well ahead of 2009, it will likely take a Black Swan event to keep the U.S. 10-Year Treasury yield from following a similar script.
Also supporting the thesis, October often coincides with the strongest monthly performance for U.S. Treasury yields.
Please see below:
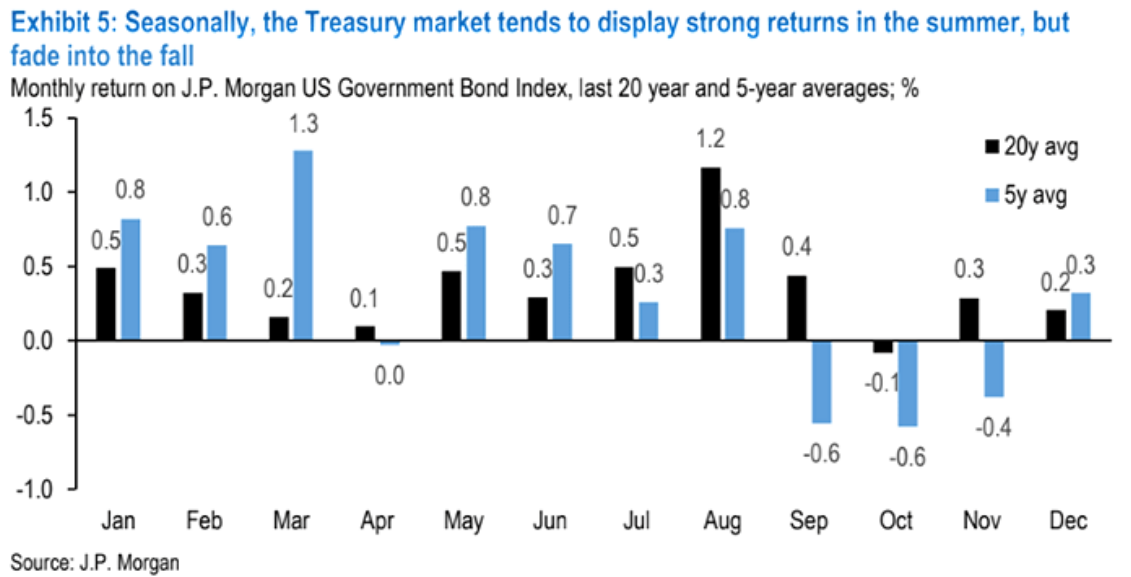
To explain, the blue and black bars above depict the average monthly return for J.P. Morgan’s US Government Bond Index during the last five (blue) and 20 (black) years. If you analyze the column labeled “Oct,” you can see that the index has recorded negative average returns during both time horizons. For context, bond prices move inversely of yields, so negative returns for the index are a function of higher U.S. Treasury yields. Furthermore, over the last five years, the index has recorded negative average returns in September, October and November. As a result, if the Delta variant fades, and the U.S. economy regains its momentum, the uptick in GDP growth and seasonal strength could combine to underwrite the U.S. 10-Year Treasury yield’s ascent.
Loss of Faith
On top of that, with inflation surging and the Fed all but admitting its lack of foresight (signaled by the FOMC increasing its PCE Index inflation forecast for the second time on Sep. 22), bond investors could lose faith in the “transitory narrative.” And with the S&P Goldman Sachs Commodity Index (S&P GSCI) closing at a new 2021 high on Sep. 23, commodity inflation may elicit further upward FOMC revisions in the coming months.
For context, I’ve warned on several occasions that the only way for the Fed to control inflation is to increase the value of the U.S. dollar and decrease the value of commodities. However, with commodities’ fervor accelerating on Sep. 23 – a day when the USD Index declined – the price action should concern Chairman Jerome Powell. As a result, FOMC participants’ 2022 inflation forecast is likely wishful thinking, and they may find that a faster liquidity drain (which is bullish for the U.S. dollar) is their only option to control the pricing pressures.
Please see below:
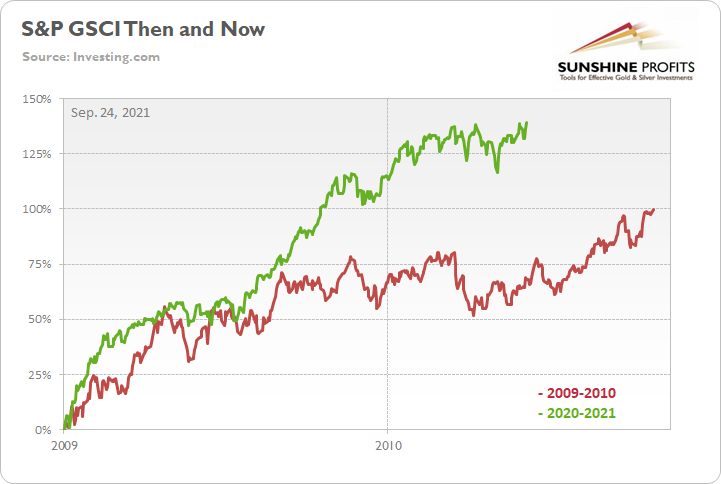
To explain, the green line above tracks the S&P GSCI’s current rally off the bottom, while the red line above tracks the S&P GSCI’s rally off the bottom in 2009-2010 (following the global financial crisis). If you analyze the middle of the chart, you can see that the S&P GSCI has completely run away from the 2009-2010 analogue. For context, at this point in 2009-2010, the S&P GSCI had rallied by 68% off of the bottom. However, as of the Sep. 23 close, the S&P GSCI has now rallied by 140% off of the April 2020 bottom. Moreover, with energy accounting for roughly 54% of the index’s movement (the red box below), what do you think will happen if investors get their wish and we hit $100 oil?
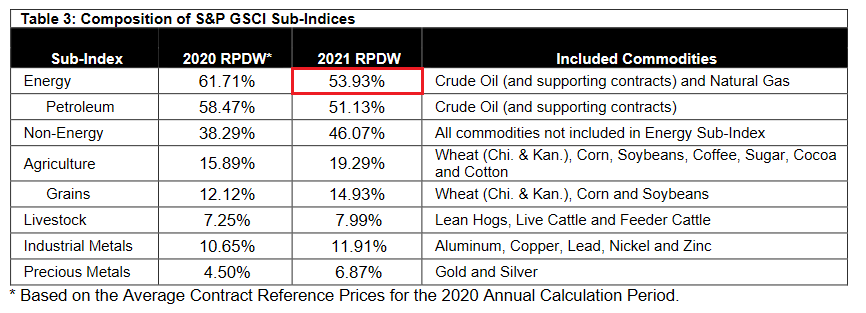 Source: S&P Global
As further evidence, IHS Markit released its U.S. Composite PMI on Sep. 23. And while the headline index declined from 55.4 in August to 54.5 in September, can you guess what didn’t decline?
 Source: IHS Markit
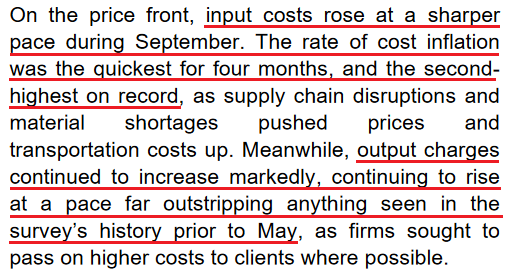
Isolating manufacturing:
“Goods producers registered another significant rise in input costs, albeit slightly slower than August’s recent high. Soaring material prices led to one of the fastest increases on record. As a result, the rate of selling price inflation accelerated to the sharpest since data collection began in May 2007 as firms passed higher costs on to their clients.”
Isolating services:
“Cost pressures remained historically elevated, as greater supplier prices and increased wage bills following incentives to entice workers pushed costs up. Firms sought to pass on higher prices to their clients through a marked rise in output charges.” For context, the service sector has been the hardest hit by the Delta variant and hasn’t even had its day in the sun.
Moreover, with U.S. economic strength the missing link to sustainably higher U.S. Treasury yields, the report revealed that U.S. businesses remain optimistic about the path of the recovery:
“Optimism at private sector firms was robust in September. Business confidence was often linked to hopes of improved client demand and the removal of supply chain blockages.”
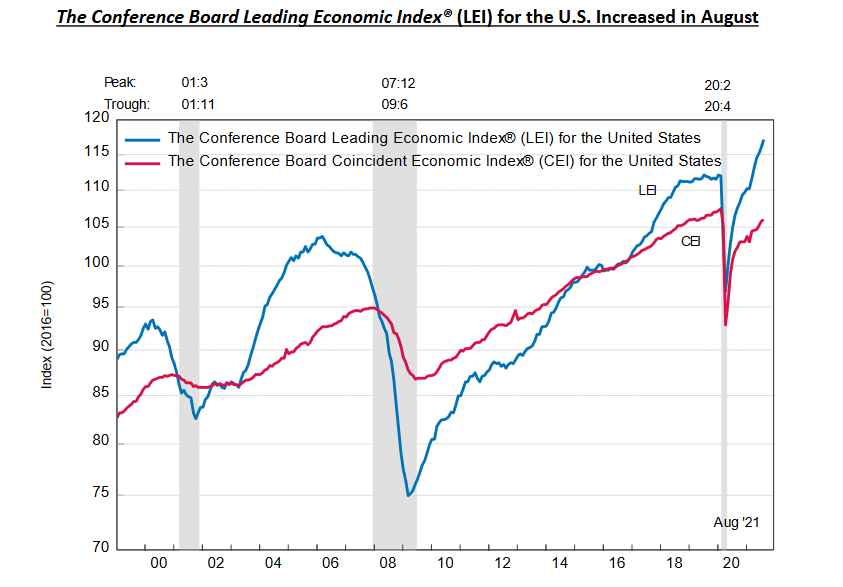
Finally, The Conference Board also released its Leading Economic Index (LEI) on Sep. 23. And with the metric increasing by 0.9% month-over-month (MoM) – versus 0.8% expected – Ataman Ozyildirim, Senior Director of Economic Research at The Conference Board, said the following:
“The U.S. LEI rose sharply in August and remains on a rapidly rising trajectory. While the Delta variant – alongside rising inflation fears – could create headwinds for labor markets and the consumer spending outlook in the near term, the trend in the LEI is consistent with robust economic growth in the reminder of the year. Real GDP growth for 2021 is expected to reach nearly 6.0 percent year-over-year, before easing to a still-robust 4.0 percent for 2022.”
In addition, with the report revealing that the LEI “continued to increase in August, and at a faster pace than in the past several months” a continuation of the trend should result in higher long-term U.S. Treasury yields over the medium term.
In conclusion, while a bullish party broke out on Sep. 23, the PMs weren’t invited. And with gold, silver and mining stocks looking on while their mining peers celebrate, the underperformance is profoundly bearish. Moreover, with U.S. Treasury yields finding their stride and the USD Index’s pullback more semblance than substance, both variables have the fundamental wind at their backs. As a result, the PMs will likely endure further weakness before they find a lasting bottom.
Overview of the Upcoming Part of the Decline
- It seems to me that the corrective upswing in gold is over, and the big decline seems to be already underway.
- It seems that the first stop for gold will be close to its previous 2021 lows, slightly below $1,700. Then it will likely correct a bit, but it’s unclear if I want to exit or reverse the current short position based on that – it depends on the number and the nature of the bullish indications that we get at that time.
- After the above-mentioned correction, we’re likely to see a powerful slide, perhaps close to the 2020 low ($1,450 - $1,500).
- If we see a situation where miners slide in a meaningful and volatile way while silver doesn’t (it just declines moderately), I plan to switch from short positions in miners to short positions in silver. At this time, it’s too early to say at what price levels this could take place, and if we get this kind of opportunity at all – perhaps with gold close to $1,600.
- I plan to exit all remaining short positions when gold shows substantial strength relative to the USD Index while the latter is still rallying. This might take place with gold close to $1,350 - $1,400. I expect silver to fall the hardest in the final part of the move. This moment (when gold performs very strongly against the rallying USD and miners are strong relative to gold after its substantial decline) is likely to be the best entry point for long-term investments, in my view. This might also happen with gold close to $1,375, but it’s too early to say with certainty at this time. I expect the final bottom to take place near the end of the year, perhaps in mid-December.
- As a confirmation for the above, I will use the (upcoming or perhaps we have already seen it?) top in the general stock market as the starting point for the three-month countdown. The reason is that after the 1929 top, gold miners declined for about three months after the general stock market started to slide. We also saw some confirmations of this theory based on the analogy to 2008. All in all, the precious metals sector is likely to bottom about three months after the general stock market tops.
- The above is based on the information available today, and it might change in the following days/weeks.
You will find my general overview of the outlook for gold on the chart below:
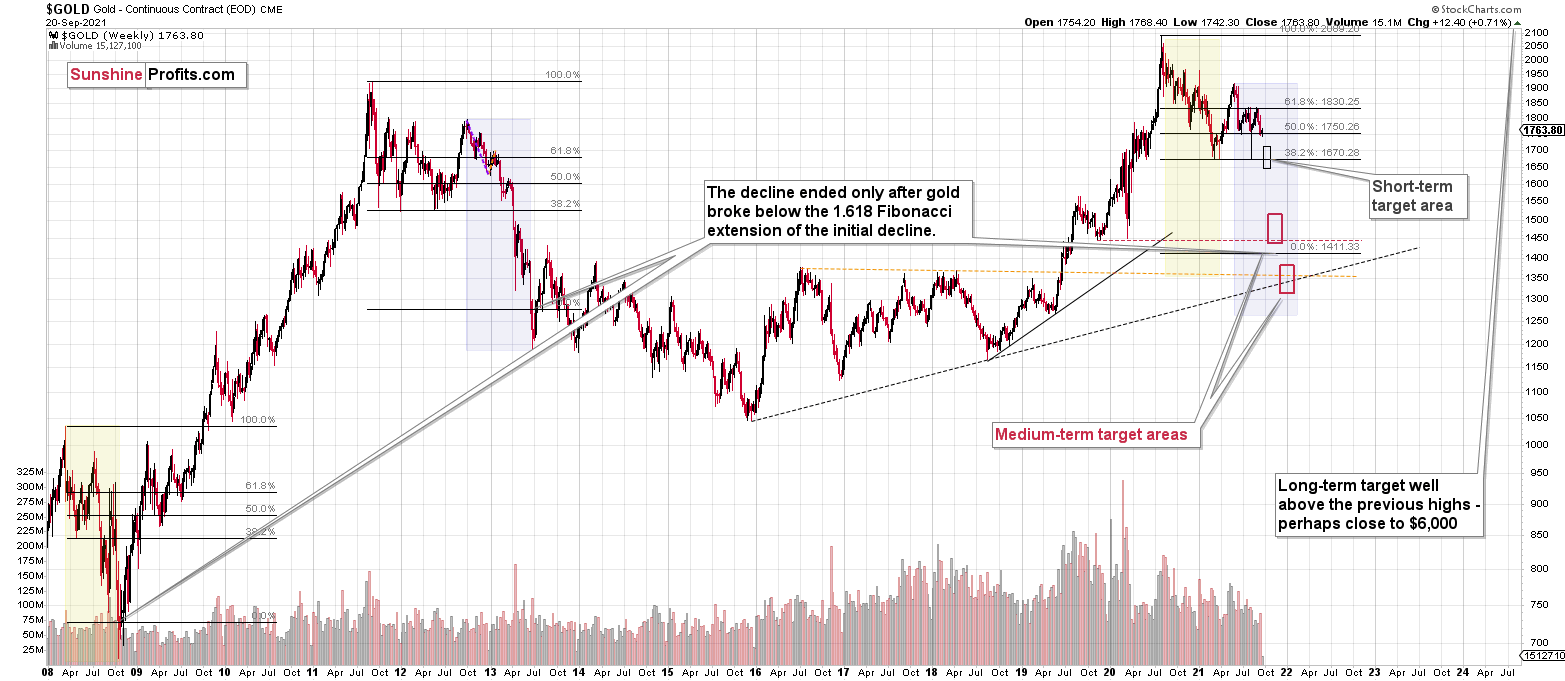
Please note that the above timing details are relatively broad and “for general overview only” – so that you know more or less what I think and how volatile I think the moves are likely to be – on an approximate basis. These time targets are not binding or clear enough for me to think that they should be used for purchasing options, warrants or similar instruments.
Summary
To summarize, the outlook for the precious metals sector remains extremely bearish for the next few months.
The decline to new lows in the GDX and silver, as well as the strength that we saw in the USD Index, were important short-term confirmations for the bearish case. However, the key two long-term factors remain the analogy to 2013 in gold and the broad head and shoulders pattern in the HUI Index. They both suggest much lower prices ahead.
It seems that our profits from the short positions are going to become truly epic in the following weeks.
After the sell-off (that takes gold to about $1,350 - $1,500), I expect the precious metals to rally significantly. The final part of the decline might take as little as 1-5 weeks, so it's important to stay alert to any changes.
Most importantly, please stay healthy and safe. We made a lot of money last March and this March, and it seems that we’re about to make much more on the upcoming decline, but you have to be healthy to enjoy the results.
As always, we'll keep you - our subscribers - informed.
By the way, we’re currently providing you with the possibility to extend your subscription by a year, two years or even three years with a special 20% discount. This discount can be applied right away, without the need to wait for your next renewal – if you choose to secure your premium access and complete the payment upfront. The boring time in the PMs is definitely over, and the time to pay close attention to the market is here. Naturally, it’s your capital, and the choice is up to you, but it seems that it might be a good idea to secure more premium access now while saving 20% at the same time. Our support team will be happy to assist you in the above-described upgrade at preferential terms – if you’d like to proceed, please contact us.
To summarize:
Trading capital (supplementary part of the portfolio; our opinion): Full speculative short positions (300% of the full position) in mining stocks are justified from the risk to reward point of view with the following binding exit profit-take price levels:
Mining stocks (price levels for the GDXJ ETF): binding profit-take exit price: $35.73; stop-loss: none (the volatility is too big to justify a stop-loss order in case of this particular trade)
Alternatively, if one seeks leverage, we’re providing the binding profit-take levels for the JDST (2x leveraged) and GDXD (3x leveraged – which is not suggested for most traders/investors due to the significant leverage). The binding profit-take level for the JDST: $16.96; stop-loss for the JDST: none (the volatility is too big to justify a SL order in case of this particular trade); binding profit-take level for the GDXD: $35.46; stop-loss for the GDXD: none (the volatility is too big to justify a SL order in case of this particular trade).
For-your-information targets (our opinion; we continue to think that mining stocks are the preferred way of taking advantage of the upcoming price move, but if for whatever reason one wants / has to use silver or gold for this trade, we are providing the details anyway.):
Silver futures upside profit-take exit price: unclear at this time - initially, it might be a good idea to exit, when gold moves to $1,683
Gold futures upside profit-take exit price: $1,683
HGD.TO – alternative (Canadian) inverse 2x leveraged gold stocks ETF – the upside profit-take exit price: $11.38
Long-term capital (core part of the portfolio; our opinion): No positions (in other words: cash
Insurance capital (core part of the portfolio; our opinion): Full position
Whether you already subscribed or not, we encourage you to find out how to make the most of our alerts and read our replies to the most common alert-and-gold-trading-related-questions.
Please note that we describe the situation for the day that the alert is posted in the trading section. In other words, if we are writing about a speculative position, it means that it is up-to-date on the day it was posted. We are also featuring the initial target prices to decide whether keeping a position on a given day is in tune with your approach (some moves are too small for medium-term traders, and some might appear too big for day-traders).
Additionally, you might want to read why our stop-loss orders are usually relatively far from the current price.
Please note that a full position doesn't mean using all of the capital for a given trade. You will find details on our thoughts on gold portfolio structuring in the Key Insights section on our website.
As a reminder - "initial target price" means exactly that - an "initial" one. It's not a price level at which we suggest closing positions. If this becomes the case (like it did in the previous trade), we will refer to these levels as levels of exit orders (exactly as we've done previously). Stop-loss levels, however, are naturally not "initial", but something that, in our opinion, might be entered as an order.
Since it is impossible to synchronize target prices and stop-loss levels for all the ETFs and ETNs with the main markets that we provide these levels for (gold, silver and mining stocks - the GDX ETF), the stop-loss levels and target prices for other ETNs and ETF (among other: UGL, GLL, AGQ, ZSL, NUGT, DUST, JNUG, JDST) are provided as supplementary, and not as "final". This means that if a stop-loss or a target level is reached for any of the "additional instruments" (GLL for instance), but not for the "main instrument" (gold in this case), we will view positions in both gold and GLL as still open and the stop-loss for GLL would have to be moved lower. On the other hand, if gold moves to a stop-loss level but GLL doesn't, then we will view both positions (in gold and GLL) as closed. In other words, since it's not possible to be 100% certain that each related instrument moves to a given level when the underlying instrument does, we can't provide levels that would be binding. The levels that we do provide are our best estimate of the levels that will correspond to the levels in the underlying assets, but it will be the underlying assets that one will need to focus on regarding the signs pointing to closing a given position or keeping it open. We might adjust the levels in the "additional instruments" without adjusting the levels in the "main instruments", which will simply mean that we have improved our estimation of these levels, not that we changed our outlook on the markets. We are already working on a tool that would update these levels daily for the most popular ETFs, ETNs and individual mining stocks.
Our preferred ways to invest in and to trade gold along with the reasoning can be found in the how to buy gold section. Furthermore, our preferred ETFs and ETNs can be found in our Gold & Silver ETF Ranking.
As a reminder, Gold & Silver Trading Alerts are posted before or on each trading day (we usually post them before the opening bell, but we don't promise doing that each day). If there's anything urgent, we will send you an additional small alert before posting the main one.
Thank you.
Przemyslaw Radomski, CFA
Founder, Editor-in-chief

