

Briefly: In our opinion, full (150% of the regular full position) speculative short positions in gold, silver and mining stocks are justified from the risk/reward perspective at the moment of publishing this alert.
Gold and – especially – silver moved visibly higher yesterday and so did mining stocks. Is there anything not to like about this move?
The problem with this upswing – in addition to it being a rather weak reaction to nuclear news and “fire and fury” threats – is that it was a classic example of what one can expect to see right before a big decline. Silver outperformed on a very short-term basis, breaking above some resistance, gold moved to the resistance without a breakout, and mining stocks once again underperformed. Moreover, they even corrected in a way that was typical during the early days of a decline. Before we move to the charts, let’s recall the details behind yesterday’s price movement – almost all of it took place before the U.S. session and we already commented on it in yesterday’s alert:
(…) Gold and miners didn’t close higher, but silver did – not significantly, but still. This outperformance seems to be present also today as silver moved higher in today’s pre-market trading. Gold moved higher as well, but silver’s $0.35 upswing is more visible. What are the implications?
In short, silver’s performance is not bullish as it’s very short-term strength is something that we often see before sizable declines. There’s also a good reason for the precious metals market to rally and it’s the escalation of tensions regarding North Korea and indications that the regime’s nuclear potential is more advanced than previously considered along with Donald Trump’s reaction to North Korean threats. He said that additional threats from North Korea “will be met with fire and fury”.
This appears to be a very serious declaration. Regardless of whether it will be fulfilled or not, the precious metals market should react strongly to it (not to mention the reaction to the nuclear revelations). Instead, at the moment of writing these words, gold is a mere $13 higher. This weak reaction is – despite the fact that rallies are usually viewed as bullish – actually quite bearish. If escalating nuclear tensions are not enough to trigger a reasonable rally in gold, then what can? In this situation, we can expect that once the tensions subside gold will slide lower once again, giving up today’s pre-market rally and then declining a lot more based on the medium-term trend. In fact, there were multiple cases that proved that gold’s reactions to geopolitical risks are very often short-lived.
Having said that, let’s take a look at the charts (chart courtesy of http://stockcharts.com).
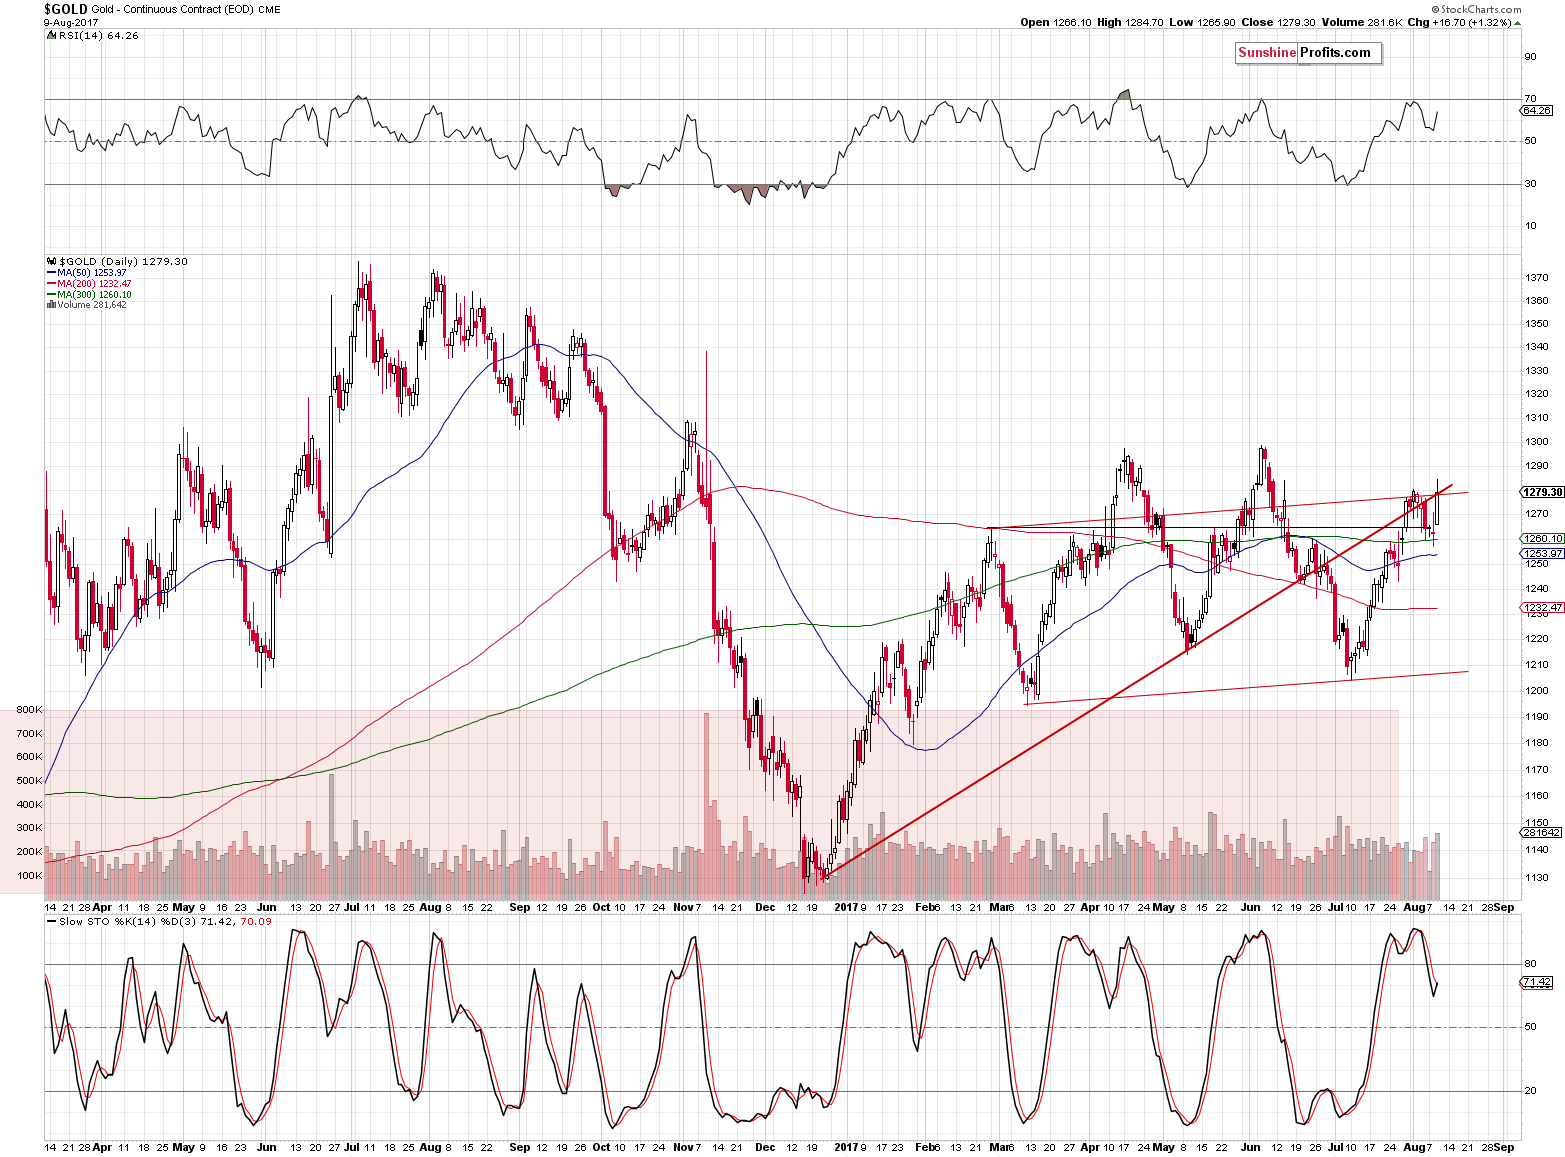
Gold closed at the previous high and the rising red resistance line – there was no breakout, so nothing really changed.
We added additional parallel red lines based on the March and July bottoms – the February and August tops are aligned as well. Based on the sizes of the price moves, we can see a symmetrical pattern with the May bottom being the center of the symmetry. In a way, it’s a head-and-shoulders pattern, with 2 heads. Patterns like that show up from time to time and their implications are just like those of regular head-and-shoulders formations. If gold breaks below the lower red line, it will be likely to decline more or less to the December 2016 low (at least). The symmetrical nature of the price movement supports such an outcome.
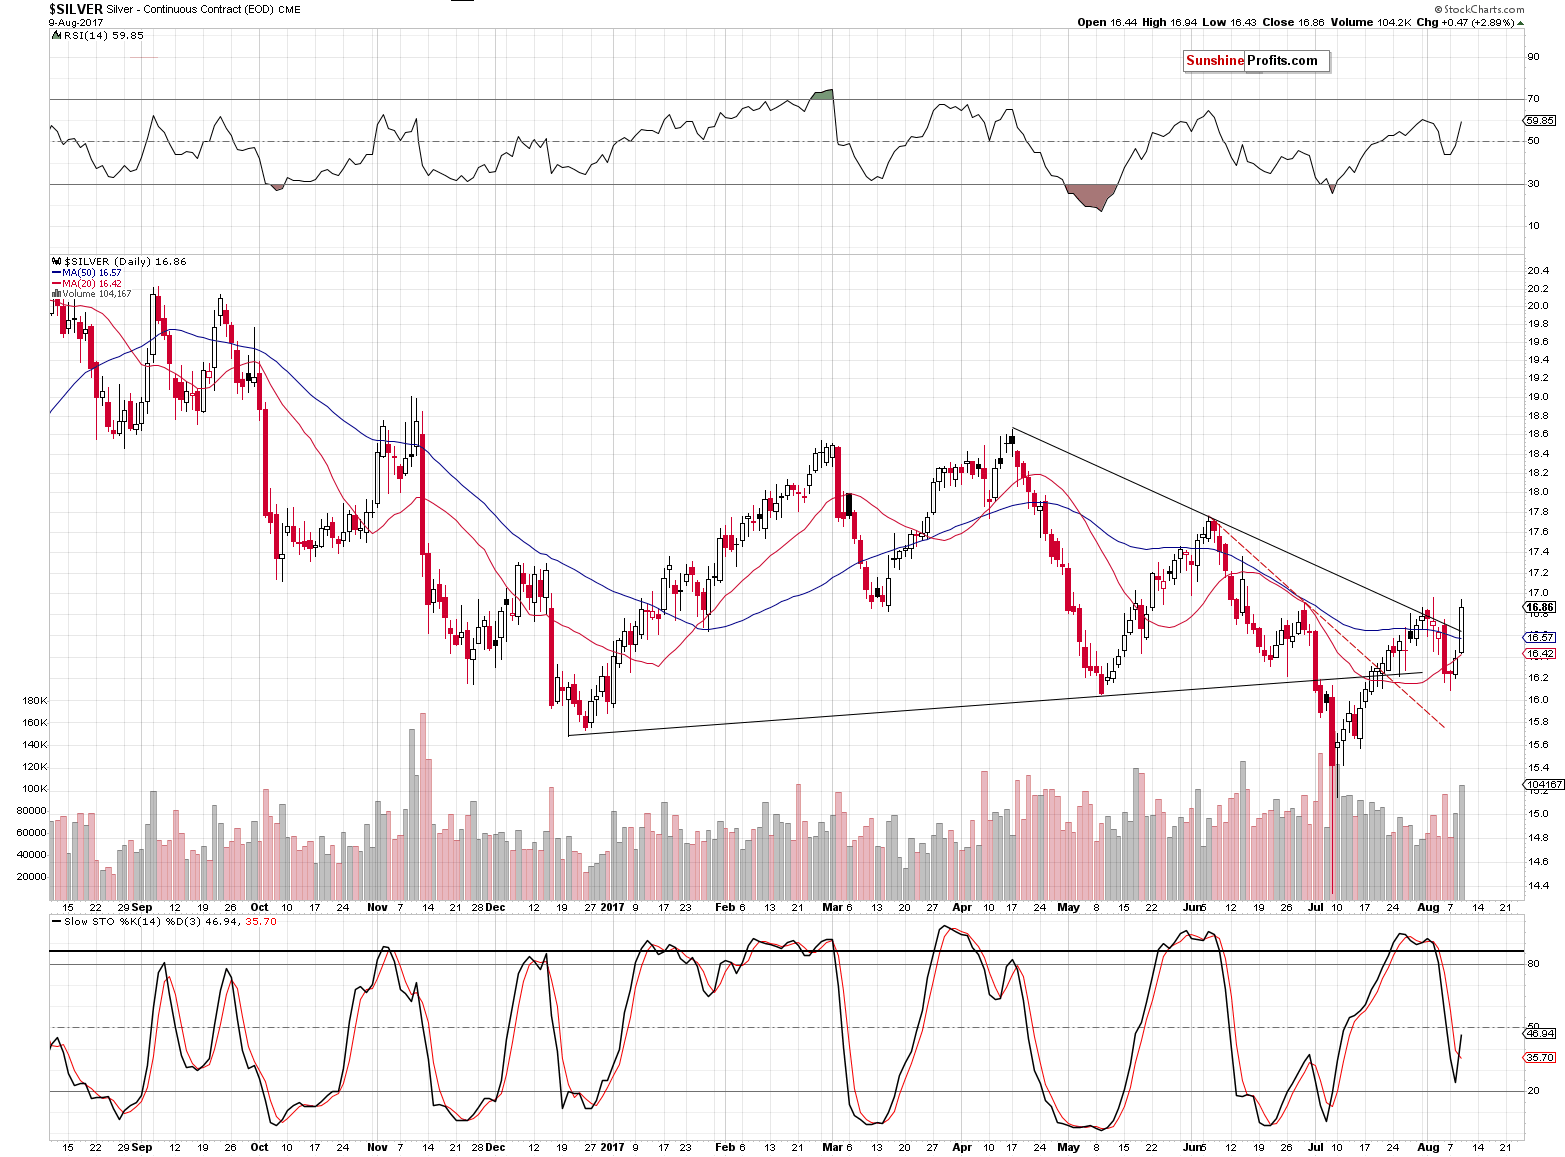
Silver outperformed gold by rallying sharply and it even moved above the declining resistance line. Still, silver’s breakouts tend to happen quite often before big slides and should not be taken seriously unless they are confirmed by other signals. Not only do we NOT have a confirmation from gold, we actually have a bearish confirmation (suggesting that silver’s breakout is fake) from the mining stocks.
Before moving to the miners’ chart, please note that silver insignificantly broke above the 50-day moving average and that this is indeed what usually took place before bigger downturns (September 2016, November 2016, June 2017).
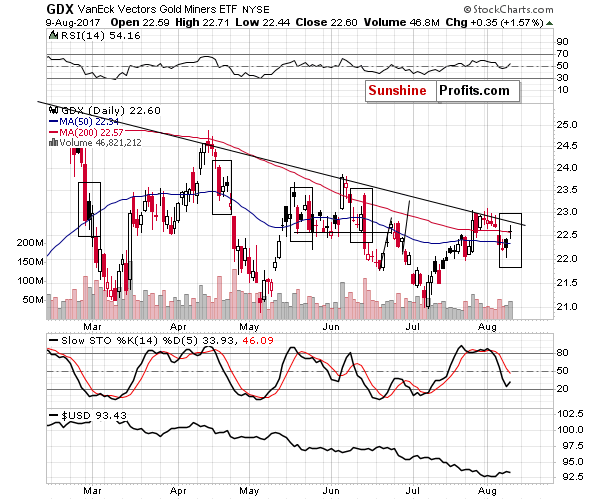
Earlier today, we wrote that the miners’ performance is quite typical and the above chart illustrates why this is the case. Please take a look at the moments marked with black rectangles. Practically each time after GDX declined to / below the 50-day moving average, it bounced – more or less by just as much as miners bounced yesterday (in some cases, the upswings were a bit bigger). It then continued to move lower. Therefore, there’s nothing really bullish about yesterday’s upswing.
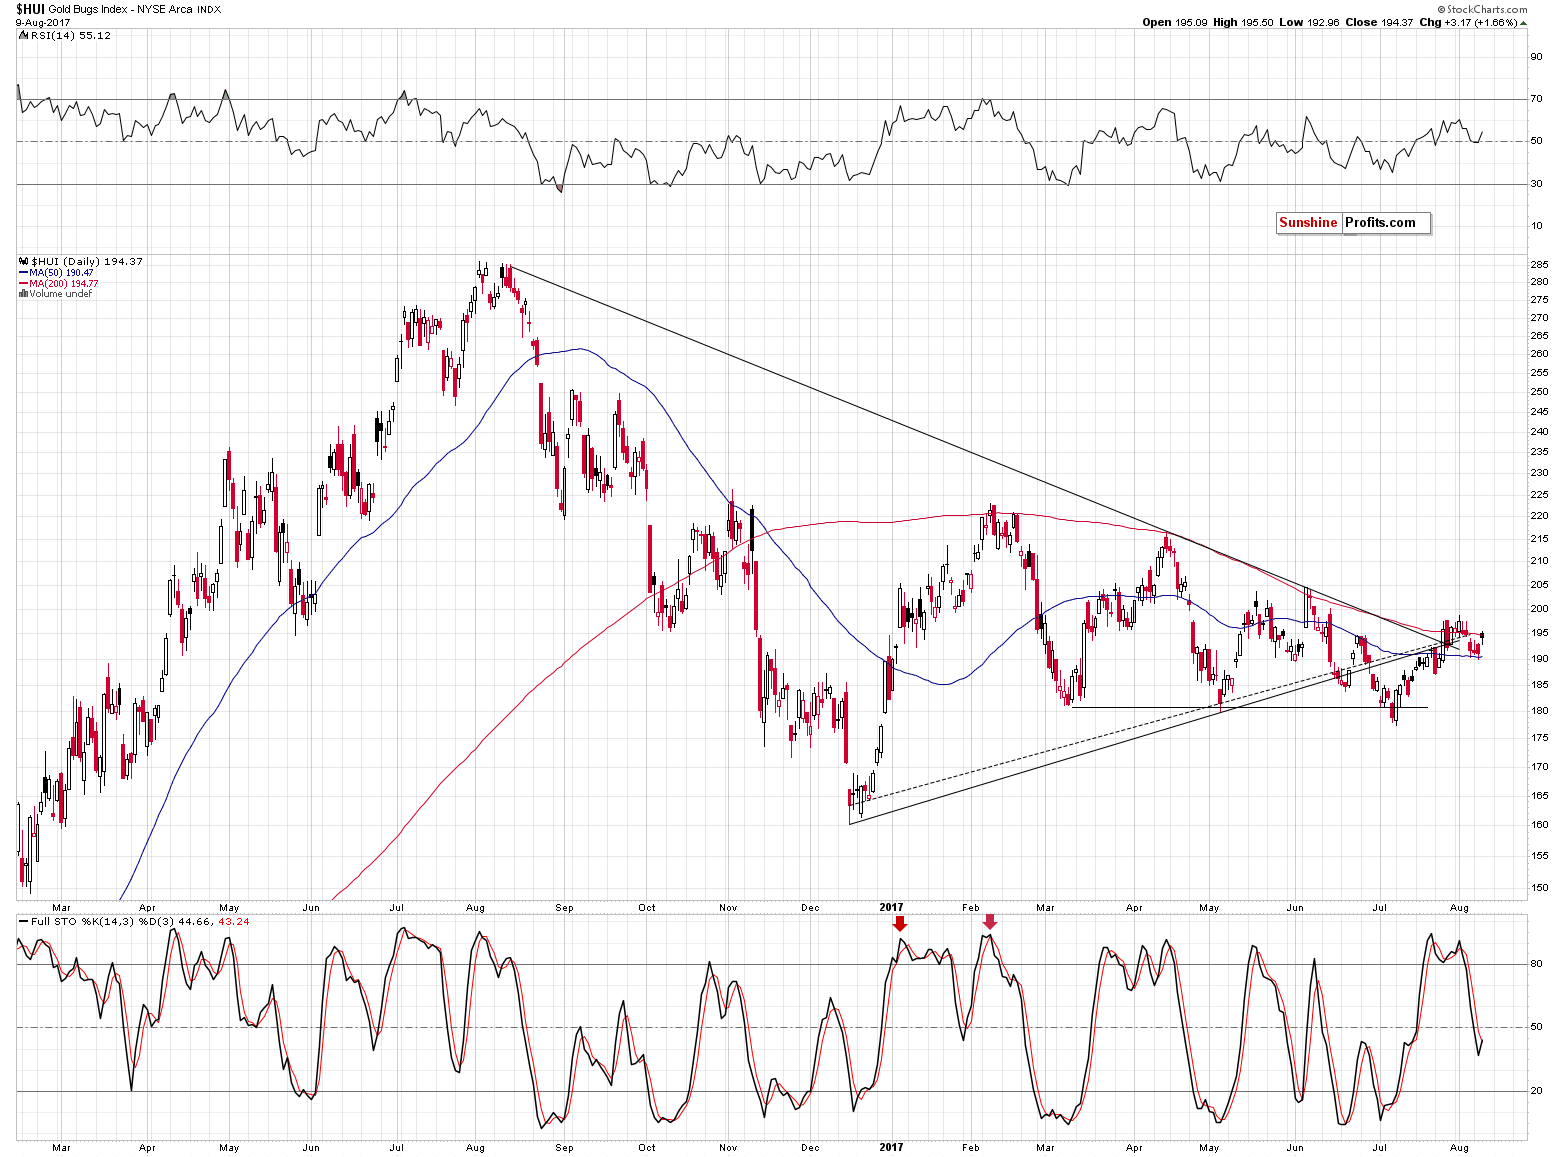
On the above HUI Index chart, we see that gold stocks also moved to the 200-day moving average, which is likely to once again prove to be strong resistance as there was no breakout. The current situation seems similar to what we saw in February – miners moved back and forth below the 200-day MA for several days only to slide in the following weeks.
Most importantly, however, mining stocks underperformed gold during yesterday’s session, which suggests that this upswing should not be trusted and that the trend remains down.
Summing up, it doesn’t seem that we should be concerned with yesterday’s upswing as the size of the rally is much smaller than what one would expect it to be based on increasing nuclear tensions. Moreover, silver’s short-term outperformance is something that we often see before big declines, so it serves as a bearish / neutral sign, not a bullish one. Finally, mining stocks underperformed gold once again, which further confirms that yesterday’s move was likely just a pause before the continuation of the decline.
As always, we will keep you – our subscribers – informed.
To summarize:
Trading capital (supplementary part of the portfolio; our opinion): Short positions (150% of the full position) in gold, silver and mining stocks are justified from the risk/reward perspective with the following stop-loss orders and initial target price levels / profit-take orders:
- Gold: initial target price level: $1,063; stop-loss: $1,317; initial target price for the DGLD ETN: $81.88; stop-loss for the DGLD ETN $44.57
- Silver: initial target price: $13.12; stop-loss: $19.22; initial target price for the DSLV ETN: $46.18; stop-loss for the DSLV ETN $17.93
- Mining stocks (price levels for the GDX ETF): initial target price: $9.34; stop-loss: $26.34; initial target price for the DUST ETF: $143.56; stop-loss for the DUST ETF $21.37
In case one wants to bet on junior mining stocks' prices (we do not suggest doing so – we think senior mining stocks are more predictable in the case of short-term trades – if one wants to do it anyway, we provide the details), here are the stop-loss details and initial target prices:
- GDXJ ETF: initial target price: $14.13; stop-loss: $45.31
- JDST ETF: initial target price: $417.04; stop-loss: $43.12
Long-term capital (core part of the portfolio; our opinion): No positions (in other words: cash)
Insurance capital (core part of the portfolio; our opinion): Full position
Important Details for New Subscribers
Whether you already subscribed or not, we encourage you to find out how to make the most of our alerts and read our replies to the most common alert-and-gold-trading-related-questions.
Please note that the in the trading section we describe the situation for the day that the alert is posted. In other words, it we are writing about a speculative position, it means that it is up-to-date on the day it was posted. We are also featuring the initial target prices, so that you can decide whether keeping a position on a given day is something that is in tune with your approach (some moves are too small for medium-term traders and some might appear too big for day-traders).
Plus, you might want to read why our stop-loss orders are usually relatively far from the current price.
Please note that a full position doesn’t mean using all of the capital for a given trade. You will find details on our thoughts on gold portfolio structuring in the Key Insights section on our website.
As a reminder – “initial target price” means exactly that – an “initial” one, it’s not a price level at which we suggest closing positions. If this becomes the case (like it did in the previous trade) we will refer to these levels as levels of exit orders (exactly as we’ve done previously). Stop-loss levels, however, are naturally not “initial”, but something that, in our opinion, might be entered as an order.
Since it is impossible to synchronize target prices and stop-loss levels for all the ETFs and ETNs with the main markets that we provide these levels for (gold, silver and mining stocks – the GDX ETF), the stop-loss levels and target prices for other ETNs and ETF (among other: UGLD, DGLD, USLV, DSLV, NUGT, DUST, JNUG, JDST) are provided as supplementary, and not as “final”. This means that if a stop-loss or a target level is reached for any of the “additional instruments” (DGLD for instance), but not for the “main instrument” (gold in this case), we will view positions in both gold and DGLD as still open and the stop-loss for DGLD would have to be moved lower. On the other hand, if gold moves to a stop-loss level but DGLD doesn’t, then we will view both positions (in gold and DGLD) as closed. In other words, since it’s not possible to be 100% certain that each related instrument moves to a given level when the underlying instrument does, we can’t provide levels that would be binding. The levels that we do provide are our best estimate of the levels that will correspond to the levels in the underlying assets, but it will be the underlying assets that one will need to focus on regarding the signs pointing to closing a given position or keeping it open. We might adjust the levels in the “additional instruments” without adjusting the levels in the “main instruments”, which will simply mean that we have improved our estimation of these levels, not that we changed our outlook on the markets. We are already working on a tool that would update these levels on a daily basis for the most popular ETFs, ETNs and individual mining stocks.
Our preferred ways to invest in and to trade gold along with the reasoning can be found in the how to buy gold section. Additionally, our preferred ETFs and ETNs can be found in our Gold & Silver ETF Ranking.
As a reminder, Gold & Silver Trading Alerts are posted before or on each trading day (we usually post them before the opening bell, but we don't promise doing that each day). If there's anything urgent, we will send you an additional small alert before posting the main one.
=====
Latest Free Trading Alerts:
The war of words between the U.S. and North Korea continues. What does it imply for the gold market?
S&P 500 index was unchanged (-0.04%) on Wednesday, as it bounced off support level following Tuesday's move down. Is this a short-term bottom or just pause before another leg down?
No Clear Direction As Stocks Trade Along Record Highs
In the previous month crude oil gained almost 9% as declines in crude oil, gasoline and distillates inventories continued to support the price of the commodity. In that environment light crude climbed above the psychologically important barrier of $50 and closed July above it. Despite this bullish development, the price of the black gold slipped below it at the beginning of August. Is this just a bigger pullback or the first sign of a longer correction? Is it possible that the oil-to-gold and oil-to-silver ratios give us more clues about crude oil future moves?
Crude Oil - Precious Metals Link in August
=====
Hand-picked precious-metals-related links:
North Korea nerves push stocks down for third day, lift gold
Asia Gold-Indian price discounts narrow, Chinese premiums steady
=====
In other news:
U.S. Inflation Is Finally Picking Up. Probably
In Debt We Trust for U.S. Consumers With $12.7 Trillion Burden
Buoyant bitcoin stirs crypto-bubble fears
=====
Thank you.
Sincerely,
Przemyslaw Radomski, CFA
Founder, Editor-in-chief, Gold & Silver Fund Manager
Gold & Silver Trading Alerts
Forex Trading Alerts
Oil Investment Updates
Oil Trading Alerts

