

Briefly: in our opinion, full (300% of the regular position size) speculative short positions in mining stocks are justified from the risk/reward point of view at the moment of publishing this Alert.
Not much changed in the markets yesterday - so in general, our yesterday's comments remain up-to-date:
The most important development that took place on the markets yesterday (from the precious metals investors' point of view) was gold failed attempt to break to new highs. Instead of breaking to new highs, gold just tested the water and turned south in a flash. This caused miners to decline and silver to move to the previous June lows.
Most importantly, it served as yet another indication that the situation from March is being repeated. That's exactly what happened at the March top - gold moved to new intraday highs, but invalidated this breakout before the day was over, while silver already visibly declined on that day. In both cases, mining stocks declined as well, and they have done so more profoundly than gold.
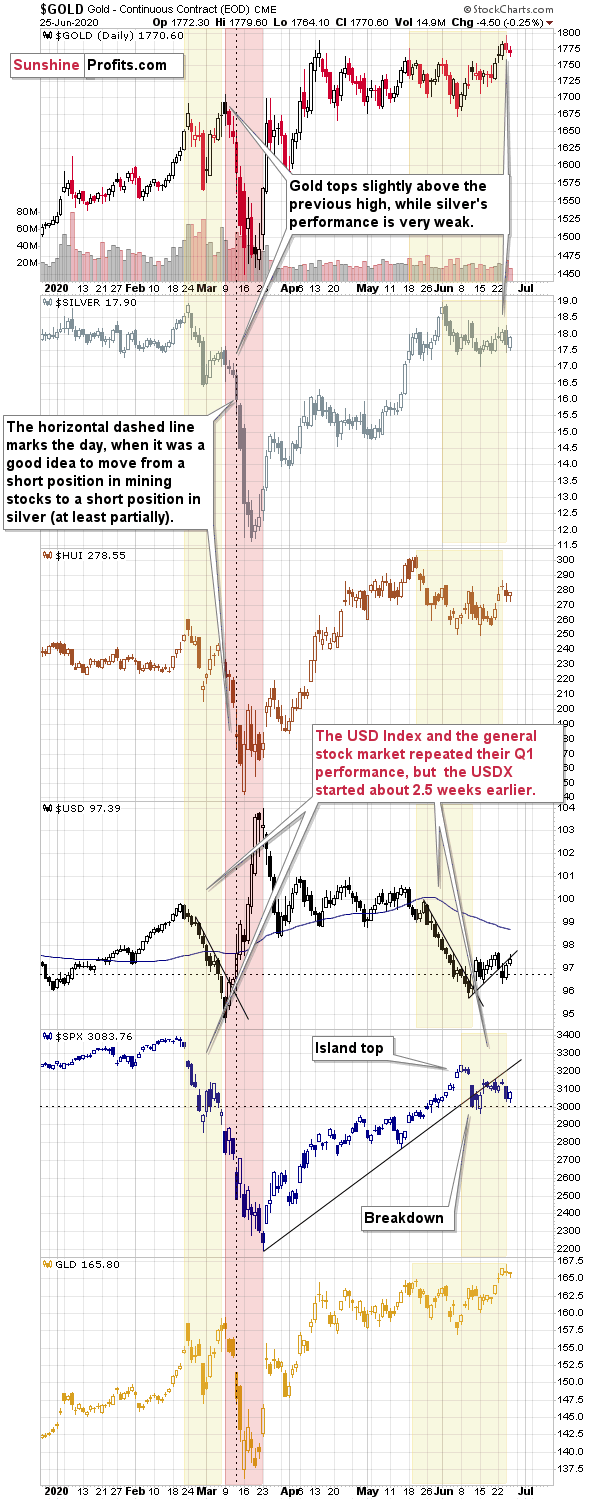
The situation in the key drivers for the PMs: the USD index and the general stock market just became more interesting. The reason is that it's now much clearer to what extent which part of the March performance is being repeated.
Yesterday's decline clarified the analogy in the general stock market (the chart that's second from the bottom), which in turn meant that the USD Index was simply early to repeat the February - March pattern. The general stock market's early-June decline seems to be analogous to the late-February decline. They even ended at the similar levels. The corrective upswing also ended at relatively similar levels. Yesterday's move lower appeared similar to what we saw on March 6th. Gold topped and silver declined on March 7th - just one day later. The history does seem to be repeating itself.
The delay in analogies in USDX and in the S&P 500 explain why the mining stocks' pause is now taking so long. These markets impact PMs in different ways and this explains why the price performance now is not identical as it was in March, even though the situation on the fundamental front is getting more similar each day.
The follow-up action, however, is likely to be similar as it seems that the markets are finally in tune with each other.
Especially that crude oil just topped, and it did so just $0.20 higher than the price on the chart that we included in our Tuesday's analysis. Back then, we wrote that the reversal in black gold and a decisive decline could be the thing that tips the scale for all markets. And indeed, crude oil is over $2 lower lower than it was on Tuesday, when we wrote about oil's bearish indications. It didn't manage to close above the upper border of the March price gap, which means that this resistance remains intact. This (at first sight - small) event might have marked the turnaround in many markets. That's something that perfectly fits the invalidation of gold's small breakout as well as its long-term turning point.
And especially if markets get a "scary" trigger in the form of a new daily high in the U.S. Covid-19 cases.
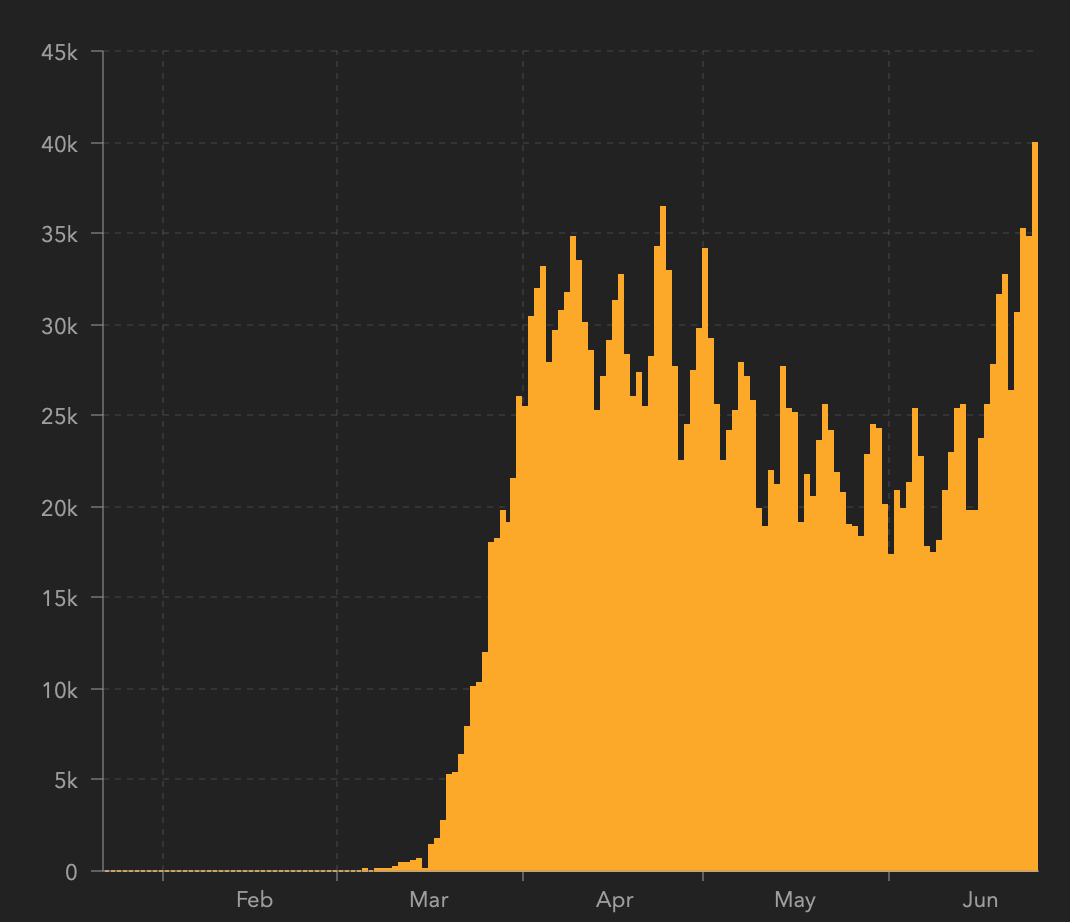
The new daily high is now clearly visible on the chart prepared by the Johns Hopkins University. Based on the Covid Tracking Project, the latest daily increase is about 39k, which means that yesterday's spike was not accidental. That's a clear new - and strong - uptrend which will be harder to ignore with each passing day.
Back in March, the markets (especially, the precious metals market) really moved once people were considering the economic implications and lockdowns were imposed. It's not yet the topic that's gaining popularity in the media, but given the strong uptrend in cases, it will soon be.
Even though nothing really happened yesterday on the markets, we'd like to show you a chart that shows you that this "nothing" right now is not making the situation less similar than what happened in March after gold's top.
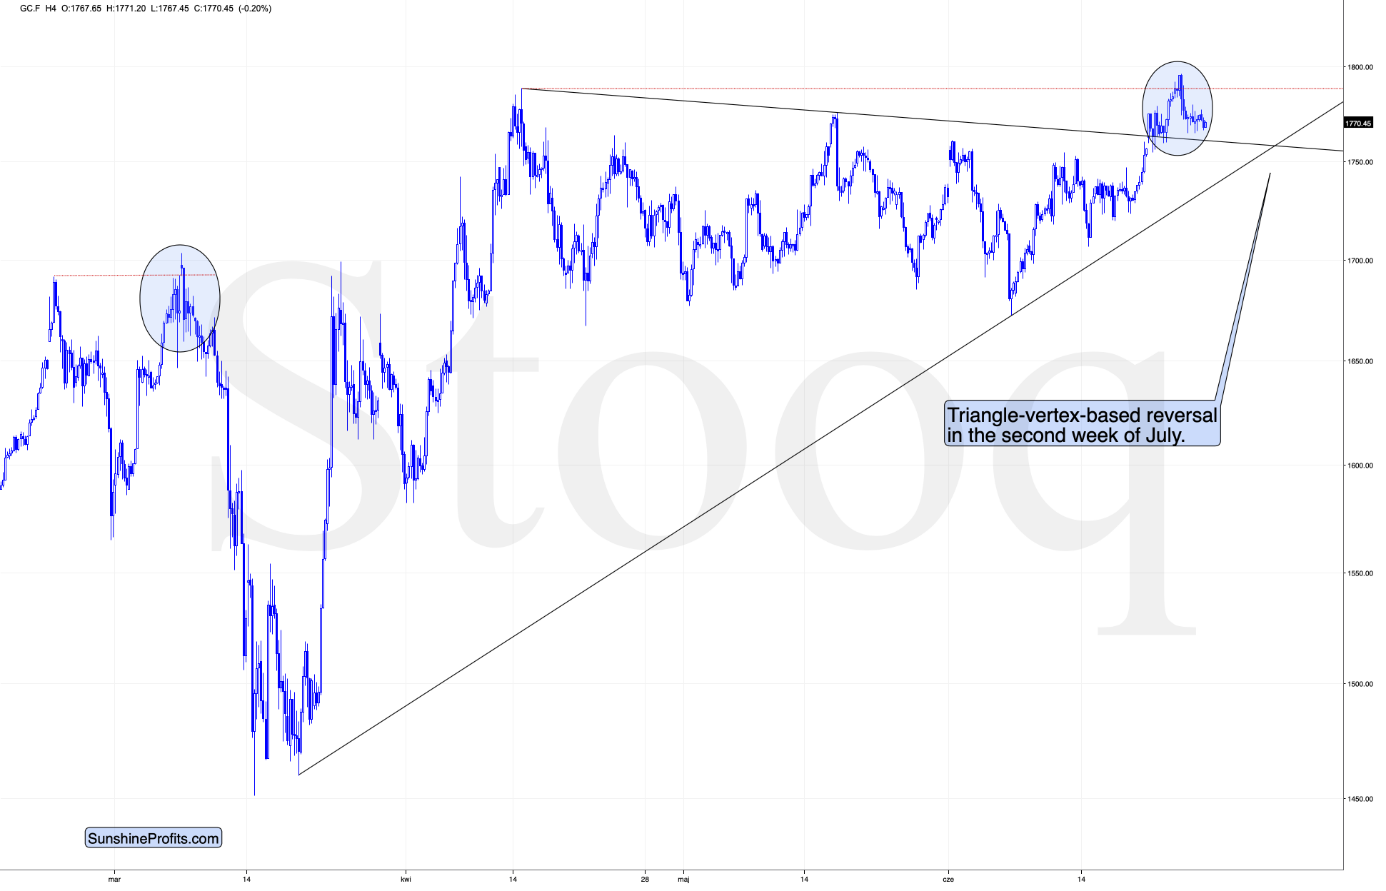
As you can see, the areas marked with blue ellipses are quite similar in terms of shape. Gold paused shortly after the initial post-top decline, but the move resumed shortly thereafter. Consequently, not having seen the volatile decline yet, doesn't change anything.
We previously wrote about the next major triangle-vertex based reversal being in early July. The chart which we used to create this reversal, was based on daily candlesticks and the above chart shows something slightly different. The 4-hour gold chart tells us that - based on the same technique - gold might actually reverse its course in the second week of July, not at its very beginning. Which is more likely? The latter, as gold is still above $1,700 while there are just three trading days left before the end of the month.
The situation is similar to what happened after March's top in both: technical and Covid-19 terms, and since the latter is the most important fundamental piece of news, the situations are indeed very alike.
Summary
Summing up, the outlook for the precious metals market is extremely bearish for the next 1-3 weeks due to the huge number of bearish signs (and their strength) that we have right now, and how likely PMs are to repeat their March slide to a significant extent). The sharply rising new Covid-19 case numbers as well as gold's long-term cyclical turning point both suggest that gold's one final slide is just around the corner.
Crude oil reaching its resistance could be the tipping point not just for that market, but for many other markets - after all, the oil price decline heralded the same move for other markets also in March - and pandemic-wise, the situation is now very similar.
After the sell-off (that takes gold below $1,400), we expect the precious metals to rally significantly. The final decline might take as little as 1-3 weeks, so it's important to stay alert to any changes. In particular, please note that there might be a time to move from mining stocks to silver as the latter tends to catch up in the final part of a given move - also during declines.
Most importantly - stay healthy and safe. We made a lot of money on the March decline and the subsequent rebound (its initial part) price moves (and we'll likely make much more in the following weeks and months), but you have to be healthy to really enjoy the results.
As always, we'll keep you - our subscribers - informed.
To summarize:
Trading capital (supplementary part of the portfolio; our opinion): Full speculative short positions (300% of the full position) in mining stocks is justified from the risk to reward point of view with the following binding exit profit-take price levels:
Senior mining stocks (price levels for the GDX ETF): binding profit-take exit price: $10.32; stop-loss: none (the volatility is too big to justify a SL order in case of this particular trade); binding profit-take level for the DUST ETF: $231.75; stop-loss for the DUST ETF: none (the volatility is too big to justify a SL order in case of this particular trade)
Junior mining stocks (price levels for the GDXJ ETF): binding profit-take exit price: $9.57; stop-loss: none (the volatility is too big to justify a SL order in case of this particular trade); binding profit-take level for the JDST ETF: $284.25; stop-loss for the JDST ETF: none (the volatility is too big to justify a SL order in case of this particular trade)
For-your-information targets (our opinion; we continue to think that mining stocks are the preferred way of taking advantage of the upcoming price move, but if for whatever reason one wants / has to use silver or gold for this trade, we are providing the details anyway. In our view, silver has greater potential than gold does):
Silver futures downside profit-take exit price: $8.58 (the downside potential for silver is significant, but likely not as big as the one in the mining stocks)
Gold futures downside profit-take exit price: $1,382 (the target for gold is least clear; it might drop to even $1,170 or so; the downside potential for gold is significant, but likely not as big as the one in the mining stocks or silver)
Long-term capital (core part of the portfolio; our opinion): No positions (in other words: cash
Insurance capital (core part of the portfolio; our opinion): Full position
Whether you already subscribed or not, we encourage you to find out how to make the most of our alerts and read our replies to the most common alert-and-gold-trading-related-questions.
Please note that the in the trading section we describe the situation for the day that the alert is posted. In other words, it we are writing about a speculative position, it means that it is up-to-date on the day it was posted. We are also featuring the initial target prices, so that you can decide whether keeping a position on a given day is something that is in tune with your approach (some moves are too small for medium-term traders and some might appear too big for day-traders).
Plus, you might want to read why our stop-loss orders are usually relatively far from the current price.
Please note that a full position doesn't mean using all of the capital for a given trade. You will find details on our thoughts on gold portfolio structuring in the Key Insights section on our website.
As a reminder - "initial target price" means exactly that - an "initial" one, it's not a price level at which we suggest closing positions. If this becomes the case (like it did in the previous trade) we will refer to these levels as levels of exit orders (exactly as we've done previously). Stop-loss levels, however, are naturally not "initial", but something that, in our opinion, might be entered as an order.
Since it is impossible to synchronize target prices and stop-loss levels for all the ETFs and ETNs with the main markets that we provide these levels for (gold, silver and mining stocks - the GDX ETF), the stop-loss levels and target prices for other ETNs and ETF (among other: UGLD, DGLD, USLV, DSLV, NUGT, DUST, JNUG, JDST) are provided as supplementary, and not as "final". This means that if a stop-loss or a target level is reached for any of the "additional instruments" (DGLD for instance), but not for the "main instrument" (gold in this case), we will view positions in both gold and DGLD as still open and the stop-loss for DGLD would have to be moved lower. On the other hand, if gold moves to a stop-loss level but DGLD doesn't, then we will view both positions (in gold and DGLD) as closed. In other words, since it's not possible to be 100% certain that each related instrument moves to a given level when the underlying instrument does, we can't provide levels that would be binding. The levels that we do provide are our best estimate of the levels that will correspond to the levels in the underlying assets, but it will be the underlying assets that one will need to focus on regarding the signs pointing to closing a given position or keeping it open. We might adjust the levels in the "additional instruments" without adjusting the levels in the "main instruments", which will simply mean that we have improved our estimation of these levels, not that we changed our outlook on the markets. We are already working on a tool that would update these levels on a daily basis for the most popular ETFs, ETNs and individual mining stocks.
Our preferred ways to invest in and to trade gold along with the reasoning can be found in the how to buy gold section. Additionally, our preferred ETFs and ETNs can be found in our Gold & Silver ETF Ranking.
As a reminder, Gold & Silver Trading Alerts are posted before or on each trading day (we usually post them before the opening bell, but we don't promise doing that each day). If there's anything urgent, we will send you an additional small alert before posting the main one.
Thank you.
Sincerely,
Przemyslaw Radomski, CFA
Editor-in-chief, Gold & Silver Fund Manager

