

Briefly: in our opinion, full (300% of the regular position size) speculative short positions in mining stocks are justified from the risk/reward point of view at the moment of publishing this Alert.
The million-dollar question for today is: did we just see the reversal in the case of the USD Index, gold, silver, and mining stocks? And the answer is that it’s quite likely, but not 100% certain. Well, since there are no certainties in any market regardless of one’s approach, techniques, and experience, the above is almost as good a confirmation as one can get.
“Almost”, because we haven’t seen a crystal-clear reversal on an intraday basis. The above would be the cherry on the perfectly bearish precious cake. What we did see was a rally that was in line with the previous bearish narrative. As things got hot, I sent you an intraday Alert yesterday (Dec. 17), and it covered the above in the following way:
Silver is way above its previous December high, and it’s even slightly above its November high.
Gold is above its December high, and slightly above the mid-November high, but not even close to the early-November high.
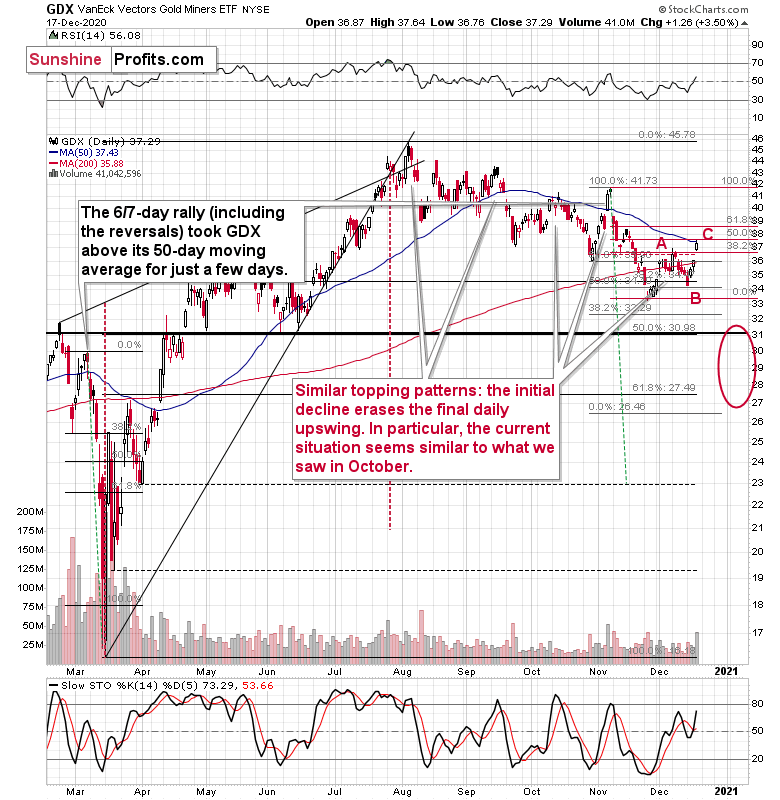
The GDX ETF – proxy for miners – did not manage to move to its mid-November high, even though it did manage to move above its previous December high.
So, what really changed? Not much. Silver is strong relative to gold, while miners are weak relative to both.
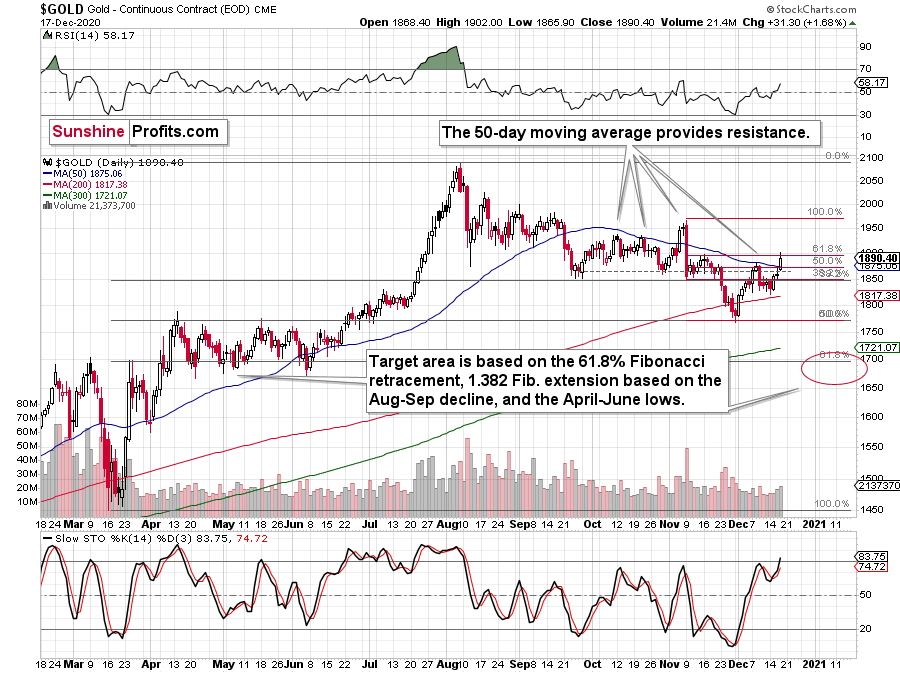
Speaking of relativity, please note that gold just moved above its 50-day moving average, just like it did in early November, right before its monthly high (on November 5), and right before a massive daily plunge. On November 5, the GDX ETF, moved above its 50-day moving average as well. But did it move above this MA today? It did so very briefly and then it declined back below it. The moving average is at $37.43, while the current price is $37.06.
Once again, miners are not performing as well as gold does, and the implications remain bearish.
The markets haven’t moved much after I sent the above alert, but they did decline a bit in today’s pre-market trading. Consequently, the above remains up-to-date.
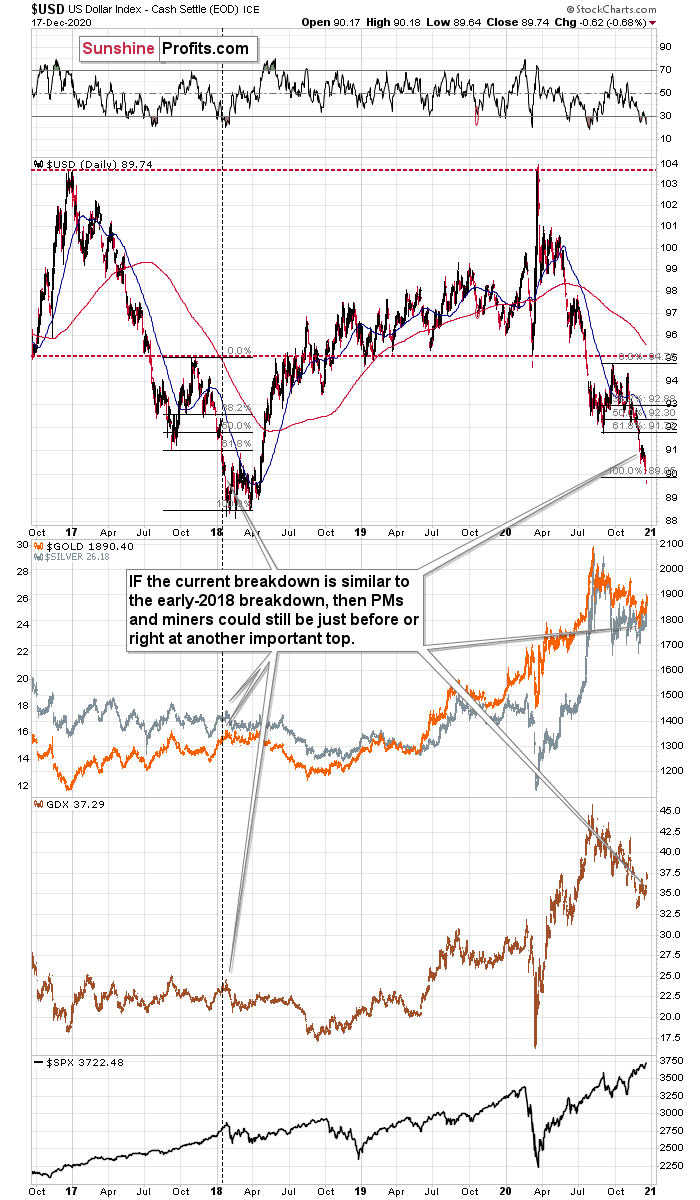
The USD Index moved below the target based on the previous correction-based Fibonacci extension, which might seem like a bearish breakdown, but…
The same happened in early 2018 right at the bottom. Back then, the decline ended not at the Fib-extension-based target, but slightly below it. That’s exactly where the USD Index moved yesterday.
At the moment of writing these words, it’s slightly higher, but not high enough to say that the bottom is definitely in. It could be – based on the above-mentioned target – but it doesn’t have to be.
Please note how much below its November low the USD Index has actually declined. The November decline has been more than doubled.
During the same time, gold didn’t just fail to rally back to its November high. It corrected only about 61.8% of the decline (red Fibonacci retracements illustrate that). Gold is very weak relative to the USD Index, which is very bearish for the next few weeks or even months.
Gold is also above its 50-day moving average. The last time it broke above this MA, in early November, it topped shortly thereafter.
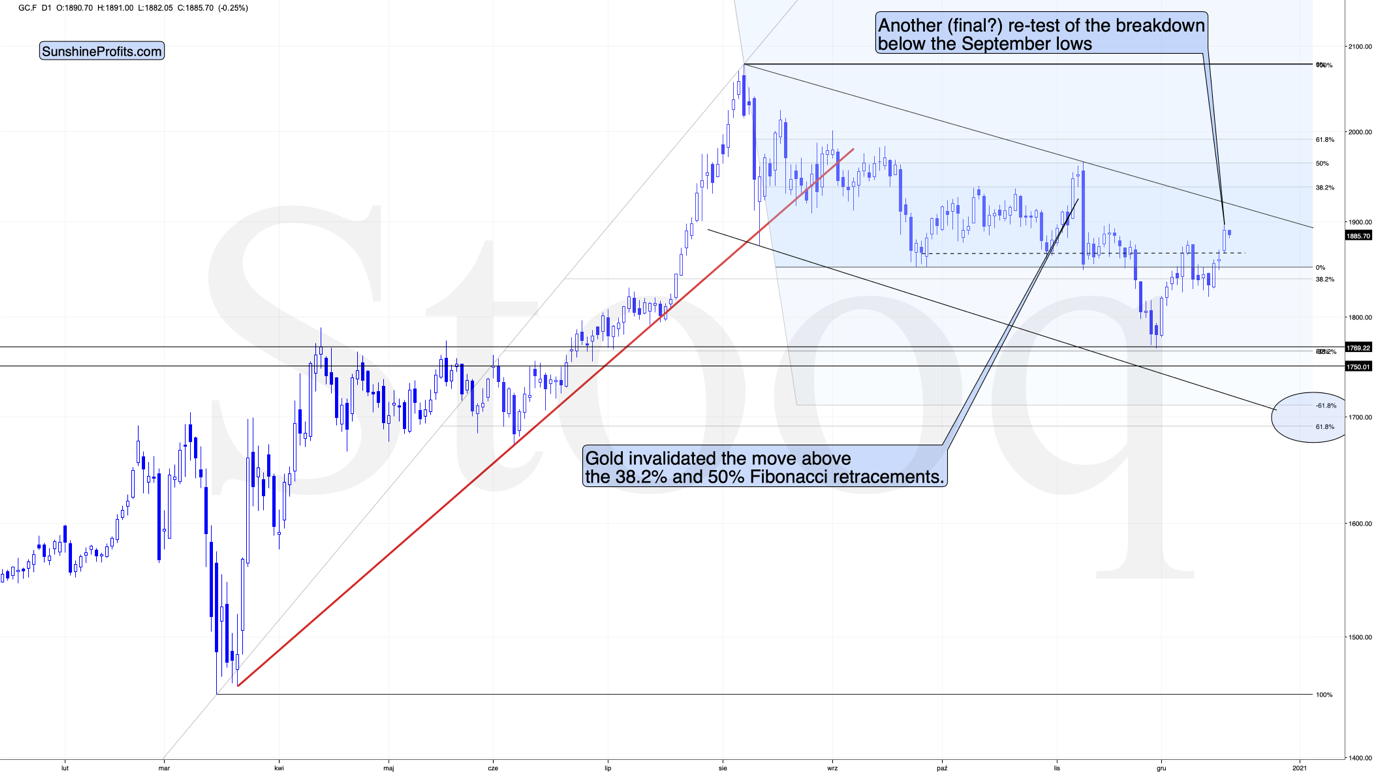
As the USDX is moving a bit higher today, gold is moving a bit lower. It already invalidated the move above its mid-November highs, but nothing more than that. So, we might have seen the short-term top yesterday, but it’s not crystal clear.
While gold corrected about 61.8% of its November decline, gold miners declined only half thereof. In other words, they underperformed gold, which is bearish.
The GDX ETF moved to its 50-day moving average – the level that kept its rallies in check since early October. Can miners move above it? Sure, they did that in early November, but is it likely that such a move would be confirmed or followed by more significant strength? Absolutely not. Let’s keep in mind two things:
- Back in early November, the GDX moved above the 50-day MA, when gold did the same thing, so if the GDX wanted to rally above this MA, it “should have” done so yesterday. It was too weak to do it.
- The early-November move above the 50-day MA was invalidated in just 2 days.
Moreover, please note that the performance of the GDX ETF from late-November to now looks like an ABC correction. This is not a bearish sign on its own, but it fits other indications described today and this week in general. It increases the chance that the top is already in or very, very close.
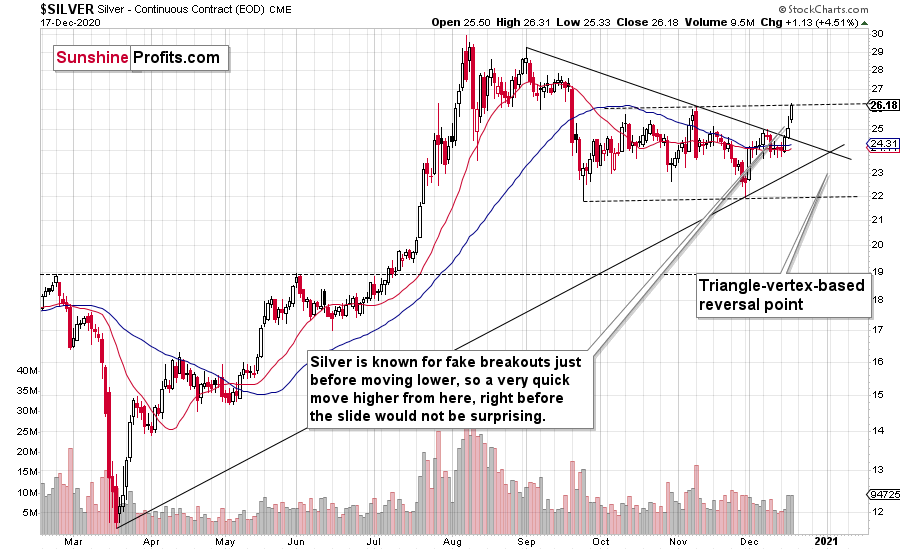
While gold corrected about 61.8% of the November decline, and GDX corrected about half thereof, silver corrected a bit more than the decline, meaning that it moved slightly above the November high. In today’s pre-market trading, silver moved below its November intraday high, so the breakout in terms of the intraday prices was already invalidated.
The above is bearish, but the most important bearish indications come from silver’s relative strength in the very short term – relative to gold and miners. This is exactly how silver is likely to perform at important tops.
As I wrote yesterday, it was definitely a good choice to use mining stocks as a proxy for our short position instead of using gold or – in particular – silver. There will be a time, when silver declines faster than miners, but – as I had indicated earlier – we are not there yet.
Real Bond Yields
Before summarizing, let’s take a look at one of the most important fundamental drivers of precious metals prices (and many other prices) – the real bond yields. I’ll also quickly go over some option-related details.
Let’s have a look at the chart below.
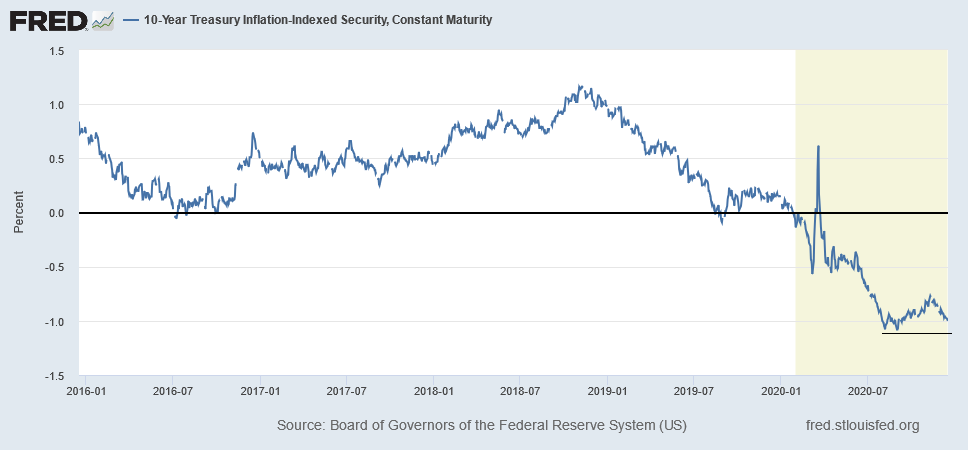
Despite real yields heading south over the past month (falling to – 1.00%), gold’s relative price action is delivering diminishing marginal returns. From late July to early August, the 10-year real yield fell from – 0.84% to – 1.08% (a 24-basis point decline). During that stretch, gold rallied by 12.90%. This time around, the 23-basis point real yield decline that’s occurred since November 9, has coincided with a 3.20% decline in the price of gold.
A warning?
Well, as I outlined, the USDX is trading well-below its mid-year low, but gold isn’t trading well-above its mid-year high. And even with the 10-year real yield taking another dive lower, all gold did was just correct a small part of its August – November decline.
The relative underperformance highlights the fragility of this week’s rally. As further evidence, the U.S. 10-Year real yield put in a double bottom at – 1.08% (August 6 and August 31) before bouncing, and in the latter case, rallying sharply higher. If a similar development occurs in the coming days/weeks, gold will come under significant pressure.
Optionality
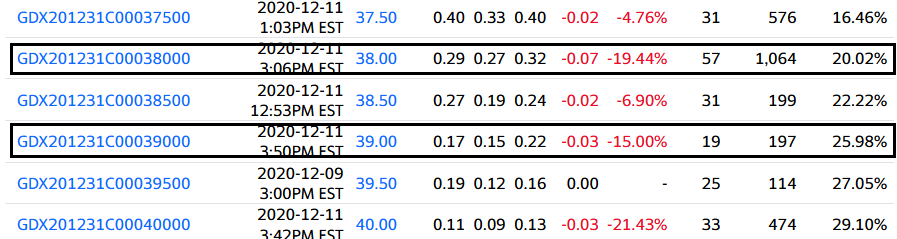
Below is GDX’s call option activity (December 31, 2020 expiry):
Source: Yahoo Finance
And GDX’s put option activity (December 31, 2020 expiry):
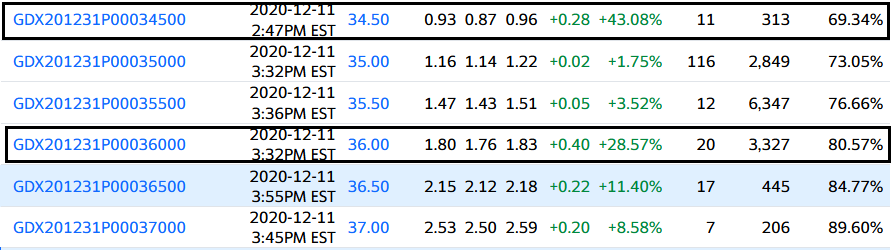
Source: Yahoo Finance
While green arrows lit up bullion and the GDX ETF on Thursday, the options market remained dormant. The GDX’s 38-strike call is still trading at a near 20.00% discount, while the 39 strike call is offered at a 15.00% discount. In contrast, the 36-strike put is trading at a near 29% premium, while the $34.50 put has been more than well bid – increasing in price by 43.08%.
Thursday’s options activity (or lack thereof) – combined with the GDX ETF failing to close above its 50-day MA – reinforces the message I’ve been stressing all week: Gold’s weakness relative to the USDX, GDX’s weakness relative to gold, and silvers outperformance relative to both are a perfectly bearish combination on the relative strength front.
Cross-Asset Considerations
With the bullish behavior across the PMs underpinned by unwavering strength across equities, a drawdown of the latter will put significant pressure on the former.
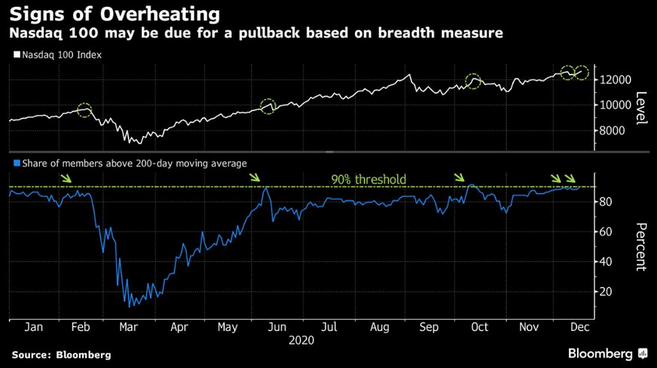
As of Wednesday’s close, more than 90% of NASDAQ 100 constituents are trading above their 200-day moving average (a technical development that preceded three meaningful pullbacks). Furthermore, the tech-heavy index has closed in the green 15 out of the last 17 trading days.
And how does this affect the metals?
Well, the last five times the NASDAQ 100 declined by more than 2% in a trading day, gold fell by an average of 1.69%, the GDX ETF fell by an average of 2.95%, and silver fell by an average of 3.34%.
It seems that the topping stock market could trigger a sizable slide in the PMs and miners.
For more details on stocks, please refer to Stock Trading Alerts by Matthew Levy, CFA, and Stock Pick Updates by Paul Rejczak.
Overview of the Upcoming Decline
As far as the current overview of the upcoming decline is concerned, I think it has already begun.
During the final part of the slide (which could end within the next 1-5 weeks or so), I expect silver to decline more than miners. That would align with how the markets initially reacted to the Covid-19 threat.
The impact of all the new rounds of money printing in the U.S. and Europe on the precious metals prices is incredibly positive in the long run, which does not make the short-term decline improbable. Markets can and will get ahead of themselves and decline afterward – sometimes very profoundly – before continuing with their upward climb.
The plan is to exit the current short positions in miners after they decline far and fast, but at the same time, silver drops just “significantly” (we expect this to happen in 0 – 3 weeks). In other words, the decline in silver should be severe, but the decline in the miners should look “ridiculous”. That’s what we did in March when we bought practically right at the bottom. It is a soft, but simultaneously broad instruction, so additional confirmations are necessary.
I expect this confirmation to come from gold, reaching about $1,700 - $1,750. If – at the same time – gold moves to about $1,700 - $1,750 and miners are already after a ridiculously big drop (say, to $31 - $32 in the GDX ETF – or lower), we will probably exit the short positions in the miners and at the same time enter short positions in silver. However, it could also be the case that we’ll wait for a rebound before re-entering short position in silver – it’s too early to say at this time. It’s also possible that we’ll enter very quick long positions between those short positions.
The precious metals market's final bottom is likely to take shape when gold shows significant strength relative to the USD Index. It could take the form of a gold’s rally or a bullish reversal, despite the ongoing USD Index rally.
Summary
It was more of the same for the precious metals on Wednesday (Dec. 16) and Thursday (Dec. 17) – as the technicals remain bearish, the Fed remains bullish, and movement beneath the surface implies fading the recent rally.
Despite an ‘all-clear’ signal by the FOMC on Wednesday, gold failed to respond in kind, and the action that we saw yesterday was much smaller than it should have been. The yellow metal continues to underperform – relative to the slide in the U.S. dollar and action in real bond yields – and the relative strength in silver signals a toppy market that’s prime for a reversal. Moreover, since the USD Index might have already bottomed (or is about to do so), it seems that the top in the precious metals market might be already in, or at hand.
All in all, a big move lower in the precious metals market is already underway.
Despite a recent decline, it seems that the USD Index is going to move higher in the following months and weeks, in turn causing gold to decline. At some point gold is likely to stop responding to dollar’s bearish indications, and this will serve as the most important and major buy signal for gold.
Naturally, everyone's trading is their responsibility. But in our opinion, if there ever was a time to either enter a short position in the miners or increase its size if it was not already sizable, it's now. We made money on the March decline, and on the March rebound, with another massive slide already underway.
After the sell-off (that takes gold to about $1,700 or lower), I expect the precious metals to rally significantly. The final decline might take as little as 1-5 weeks, so it's important to stay alert to any changes.
Most importantly, please stay healthy and safe. We made a lot of money on the March decline and the subsequent rebound (its initial part) price moves (and we'll likely earn much more in the following weeks and months), but you have to be healthy to enjoy the results.
As always, we'll keep you - our subscribers - informed.
To summarize:
Trading capital (supplementary part of the portfolio; our opinion): Full speculative short positions (300% of the full position) in mining stocks is justified from the risk to reward point of view with the following binding exit profit-take price levels:
Senior mining stocks (price levels for the GDX ETF): binding profit-take exit price: $32.02; stop-loss: none (the volatility is too big to justify a SL order in case of this particular trade); binding profit-take level for the DUST ETF: $28.73; stop-loss for the DUST ETF: none (the volatility is too big to justify a SL order in case of this particular trade)
Junior mining stocks (price levels for the GDXJ ETF): binding profit-take exit price: $42.72; stop-loss: none (the volatility is too big to justify a SL order in case of this particular trade); binding profit-take level for the JDST ETF: $21.22; stop-loss for the JDST ETF: none (the volatility is too big to justify a SL order in case of this particular trade)
For-your-information targets (our opinion; we continue to think that mining stocks are the preferred way of taking advantage of the upcoming price move, but if for whatever reason one wants / has to use silver or gold for this trade, we are providing the details anyway. In our view, silver has greater potential than gold does):
Silver futures downside profit-take exit price: unclear at this time - initially, it might be a good idea to exit, when gold moves to $1,703.
Gold futures downside profit-take exit price: $1,703
Long-term capital (core part of the portfolio; our opinion): No positions (in other words: cash
Insurance capital (core part of the portfolio; our opinion): Full position
Whether you already subscribed or not, we encourage you to find out how to make the most of our alerts and read our replies to the most common alert-and-gold-trading-related-questions.
Please note that we describe the situation for the day that the alert is posted in the trading section. In other words, if we are writing about a speculative position, it means that it is up-to-date on the day it was posted. We are also featuring the initial target prices to decide whether keeping a position on a given day is in tune with your approach (some moves are too small for medium-term traders, and some might appear too big for day-traders).
Additionally, you might want to read why our stop-loss orders are usually relatively far from the current price.
Please note that a full position doesn't mean using all of the capital for a given trade. You will find details on our thoughts on gold portfolio structuring in the Key Insights section on our website.
As a reminder - "initial target price" means exactly that - an "initial" one. It's not a price level at which we suggest closing positions. If this becomes the case (like it did in the previous trade), we will refer to these levels as levels of exit orders (exactly as we've done previously). Stop-loss levels, however, are naturally not "initial", but something that, in our opinion, might be entered as an order.
Since it is impossible to synchronize target prices and stop-loss levels for all the ETFs and ETNs with the main markets that we provide these levels for (gold, silver and mining stocks - the GDX ETF), the stop-loss levels and target prices for other ETNs and ETF (among other: UGL, GLL, AGQ, ZSL, NUGT, DUST, JNUG, JDST) are provided as supplementary, and not as "final". This means that if a stop-loss or a target level is reached for any of the "additional instruments" (GLL for instance), but not for the "main instrument" (gold in this case), we will view positions in both gold and GLL as still open and the stop-loss for GLL would have to be moved lower. On the other hand, if gold moves to a stop-loss level but GLL doesn't, then we will view both positions (in gold and GLL) as closed. In other words, since it's not possible to be 100% certain that each related instrument moves to a given level when the underlying instrument does, we can't provide levels that would be binding. The levels that we do provide are our best estimate of the levels that will correspond to the levels in the underlying assets, but it will be the underlying assets that one will need to focus on regarding the signs pointing to closing a given position or keeping it open. We might adjust the levels in the "additional instruments" without adjusting the levels in the "main instruments", which will simply mean that we have improved our estimation of these levels, not that we changed our outlook on the markets. We are already working on a tool that would update these levels daily for the most popular ETFs, ETNs and individual mining stocks.
Our preferred ways to invest in and to trade gold along with the reasoning can be found in the how to buy gold section. Furthermore, our preferred ETFs and ETNs can be found in our Gold & Silver ETF Ranking.
As a reminder, Gold & Silver Trading Alerts are posted before or on each trading day (we usually post them before the opening bell, but we don't promise doing that each day). If there's anything urgent, we will send you an additional small alert before posting the main one.
Thank you.
Przemyslaw Radomski, CFA
Founder, Editor-in-chief

