

Briefly: In our opinion, full (150% of the regular size of the position) speculative short positions in gold, silver and mining stocks are justified from the risk/reward perspective at the moment of publishing this alert.
In yesterday’s alert, we wrote that gold was vulnerable to the movement in the USD Index and a short-term move higher could be seen. The USD Index has declined and gold has indeed moved higher. Silver and miners didn’t really follow. What can we infer from the above combination of signs?
Let’s start the discussion of yesterday’s action in the gold-USD link with a quote about it from yesterday’s alert:
While it doesn’t change much regarding the outlook for the upcoming weeks, it does indicate that gold is still vulnerable to moves in the currency market. Well, gold can never be entirely independent from the above as it is priced in currencies and thus if the value of a given currency erodes, gold has to move up in value over time (all other things being equal). Still, that’s not what we mean here. In this case, we mean the very short-term link that can either make gold move significantly in light of an average move in the USD, or it can make gold not move at all.
Gold’s way of reacting changes over time and it usually takes gold between a week and a few months to change its attitude toward the USD Index’s movement. Consequently, even if the current period of gold’s way of reacting (it does react) to the USD’s price swings is coming to an end, we should still assume that it could be in place for a day or a few.
It means that gold is vulnerable to a quick upswing in case of a quick downswing in the USD. The latter is not very likely and it doesn’t have to take place at all, but it’s something worth keeping in mind. We saw multiple bearish factors and we saw mining stocks bounce off the rising support/resistance line despite gold’s temporary strength. Therefore, the outlook remains bearish, but a short-term upswing in the price of the yellow metal – even a bit above the previous highs – should not surprise us or make us think that something major happened.
What happened yesterday (chart courtesy of http://stockcharts.com).
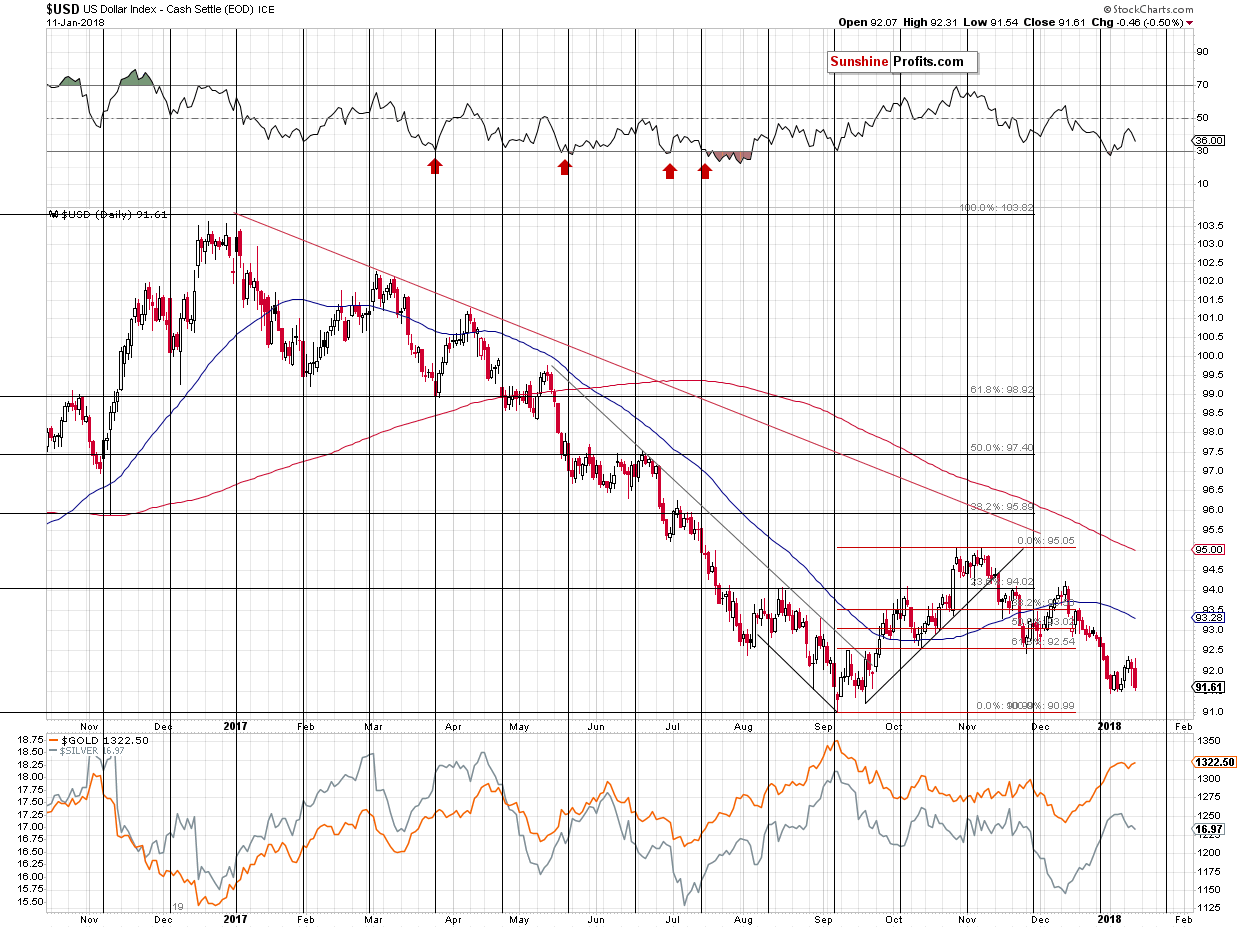
The USD Index declined and closed the session almost right at the 2018 low. How did gold react?
The yellow metal moved higher by only a few dollars. If we also consider today’s pre-market move (with gold at $1,331), the entire upswing is more or less a reflection of the USD’s move. The latter moved to (slightly below) its previous lows and gold moved to its previous highs.
In other words, the period in which gold is following in the USD’s footsteps is still here and the vulnerability in the yellow metal remains present.
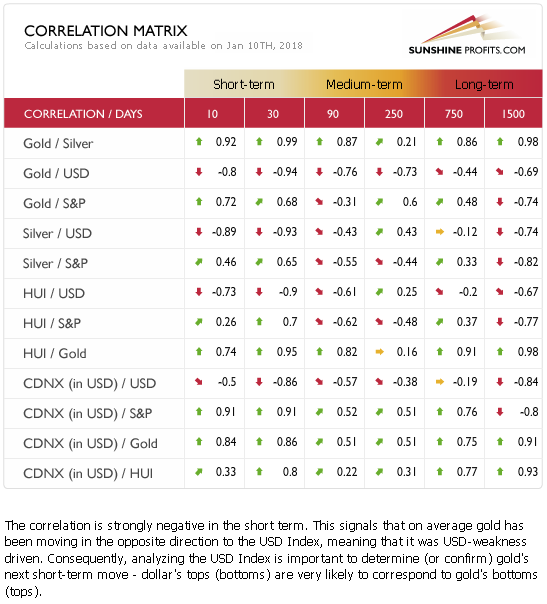
The 30-day column in our Correlation Matrix shows the correlation for gold and the USD at -0.94, which is very low. Still, the 10-day correlation coefficient is not as extremely low. At -0.8 it’s still significant, but it shows that the trend in the link may be changing.
Overall, gold’s vulnerability doesn’t change much regarding the action at our end as the upside seems very limited.
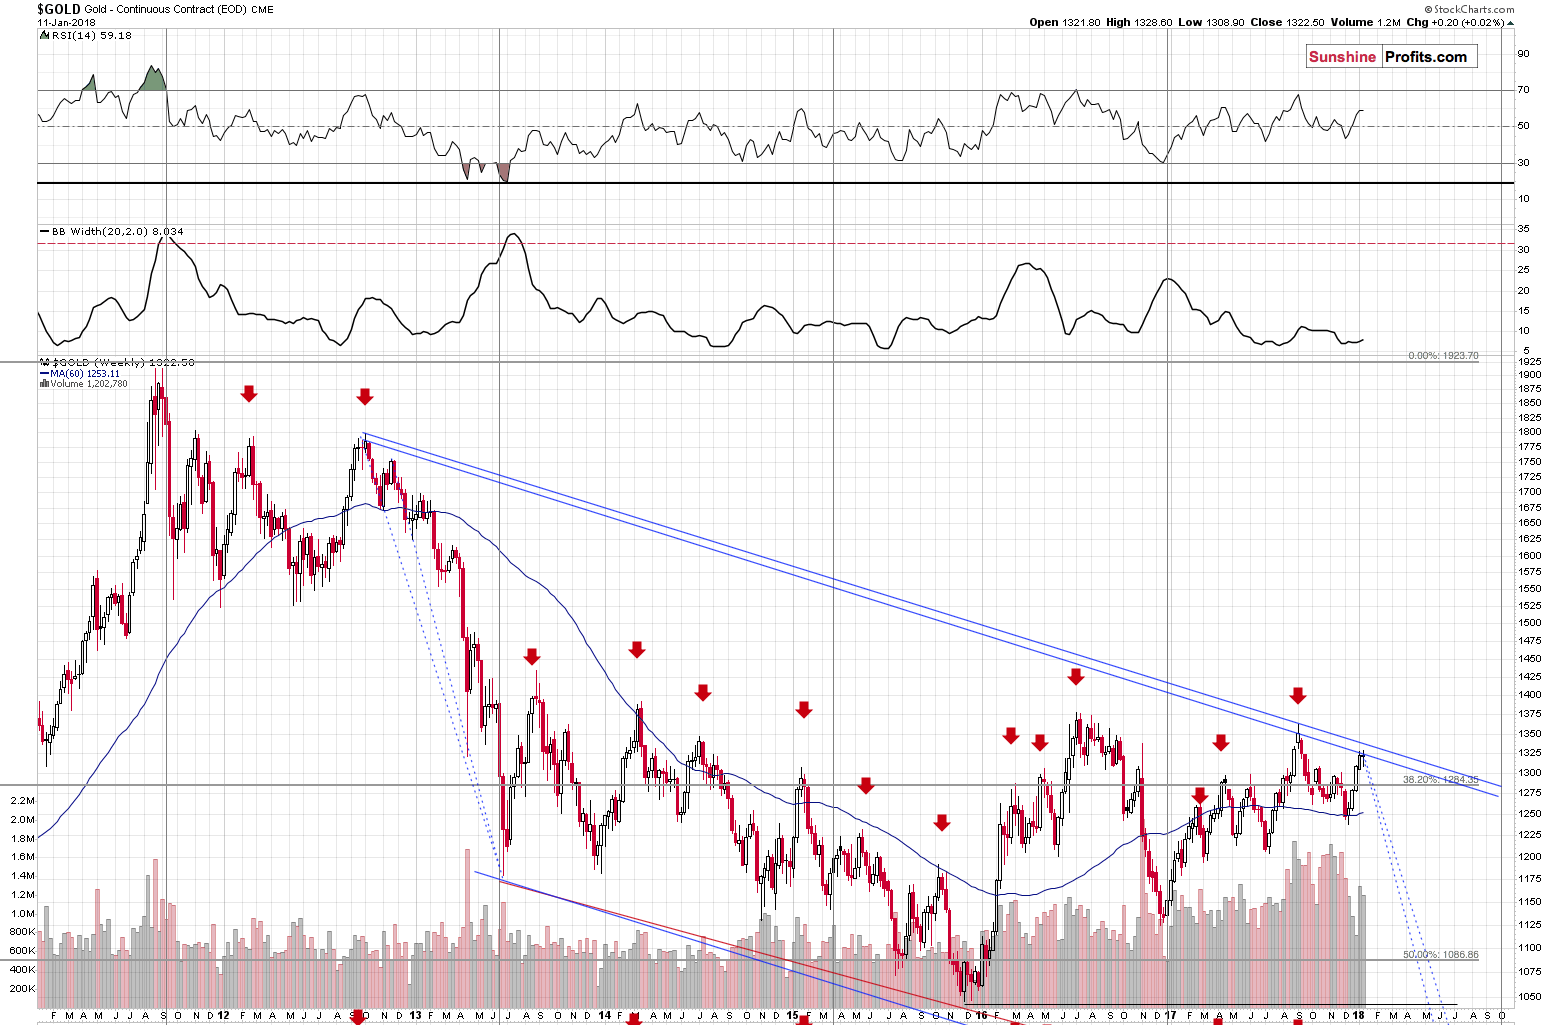
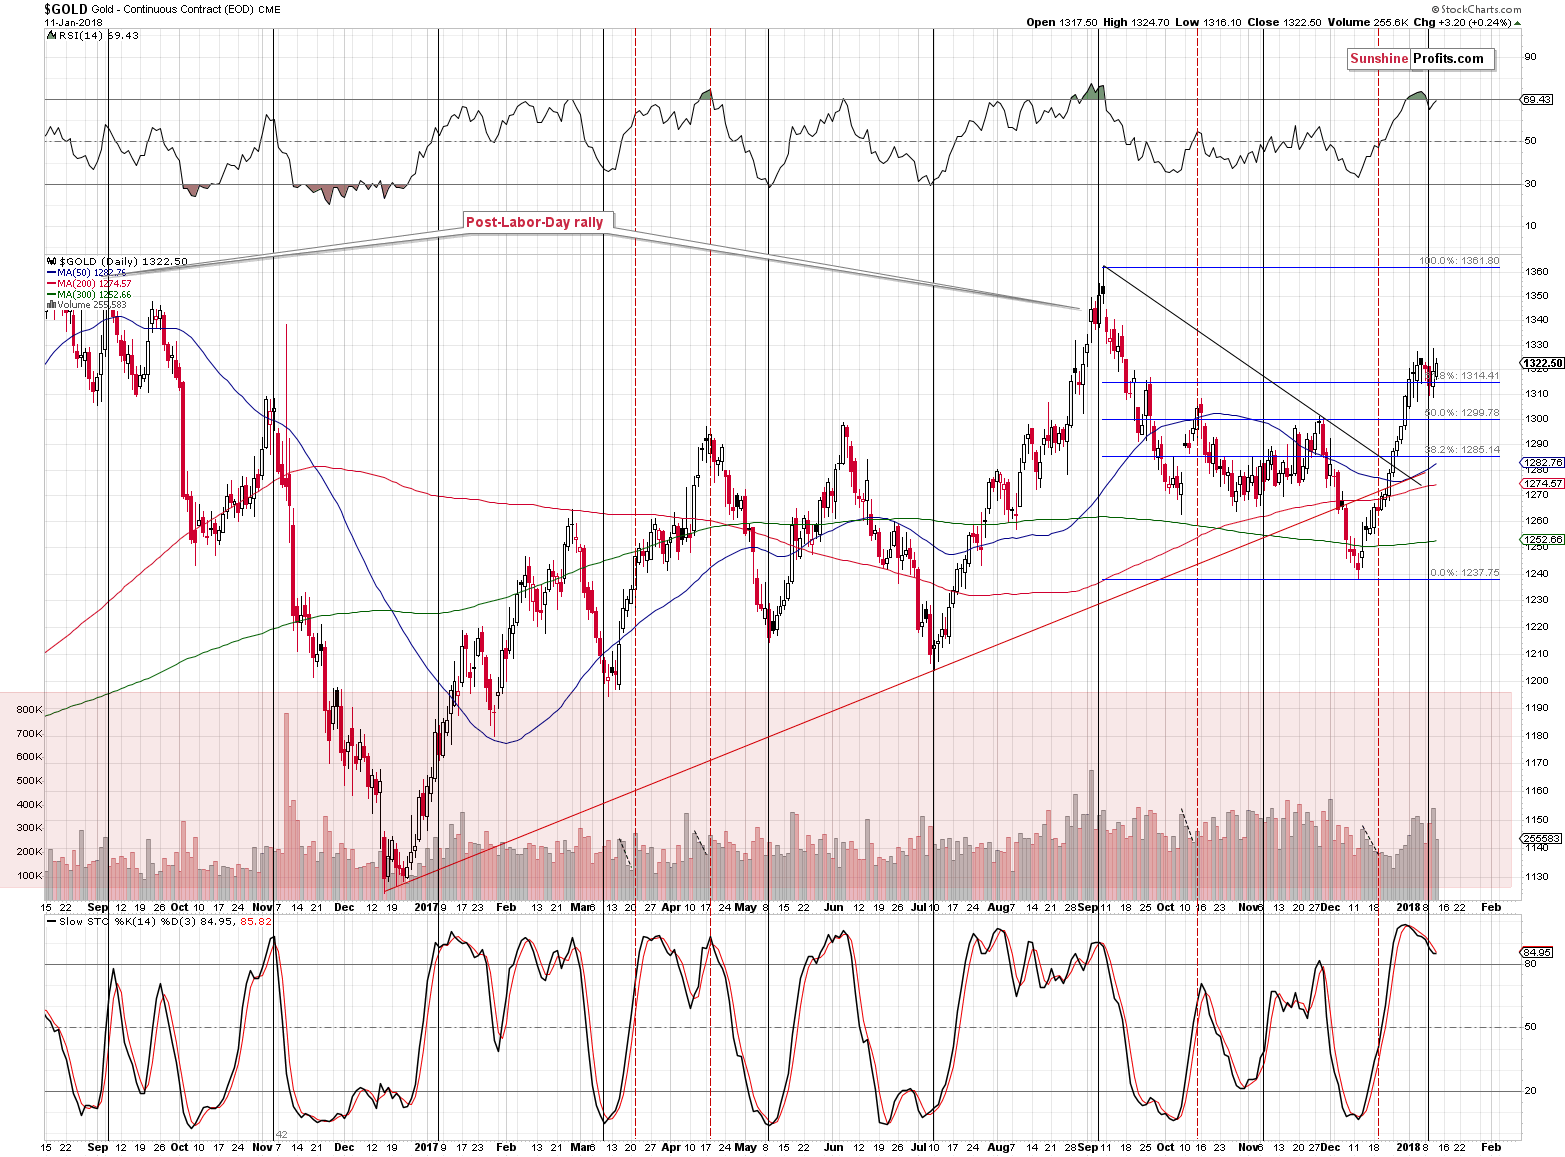
The declining, long-term resistance line is very close and a breakout above it is very unlikely. Based on the weekly closing prices, the line is at about $1,325, and based on the intraday highs, the line is at about $1,336. Today’s pre-market high (at least at the moment of writing these words) is $1,333.60 – only $2 below the upper of the resistance lines.
Consequently, it doesn’t seem to be justified to adjust the positions based on the situation in gold?
So, maybe it’s worth adjusting it based on what we see in silver or mining stocks?
Exactly the opposite is the case.
Silver and mining stocks had very good reasons to rally yesterday: the USD Index declined, gold moved higher and the general stock market soared once again.
What happened?
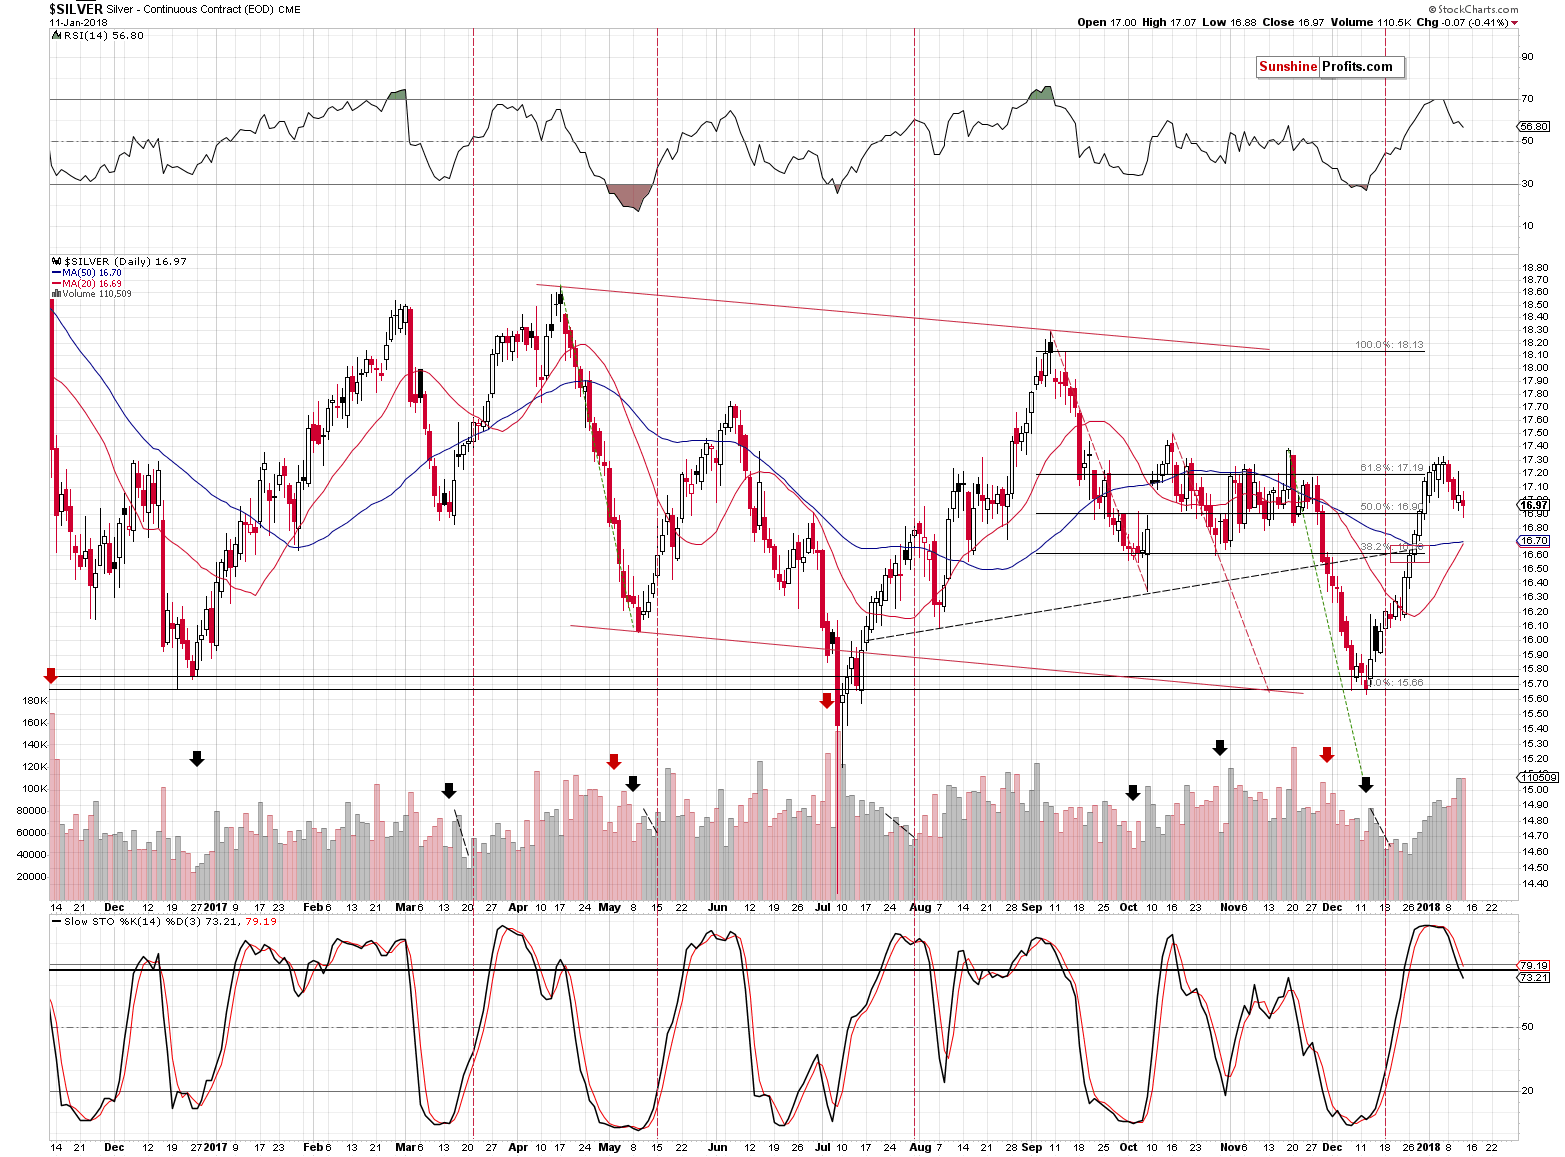
Silver refused to rally. Silver futures even ended yesterday’s session lower. At the moment of writing these words silver is trading at $17.10, so it’s still far from this year’s high.
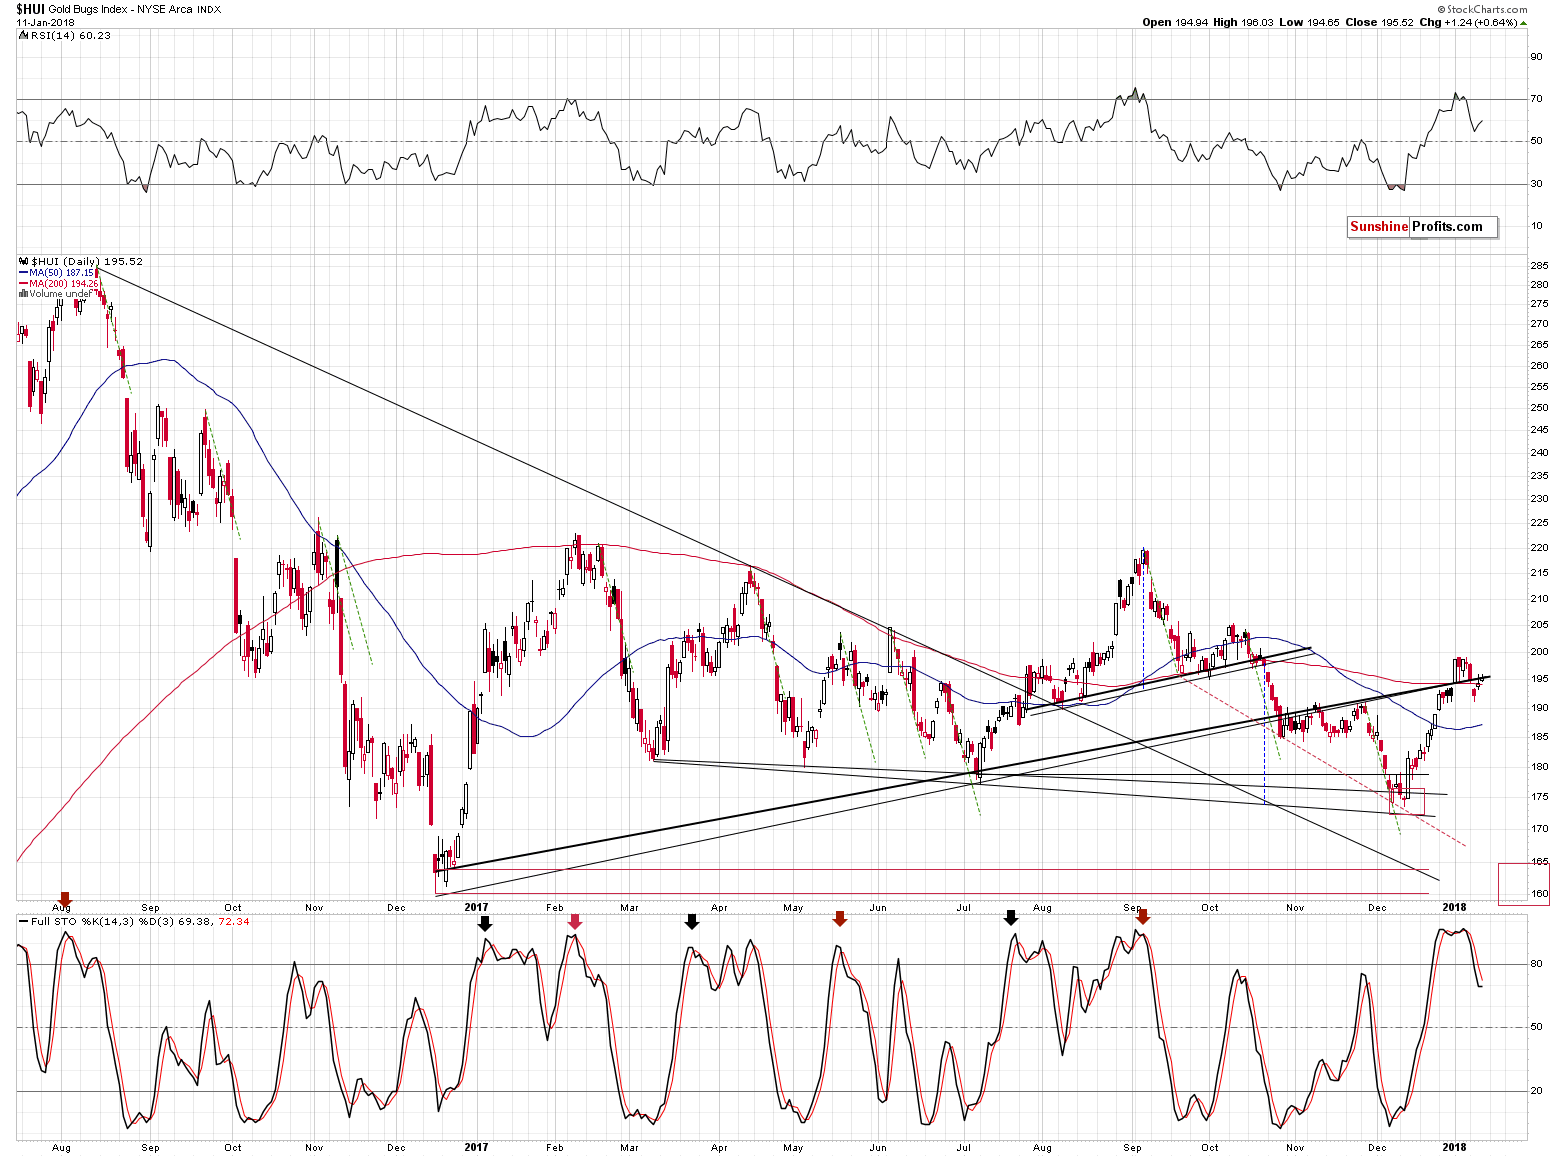
Gold stocks moved a little higher, but closed the session below the rising support / resistance lines. Consequently, the technical picture didn’t improve. In fact, one could say that it worsened based on yet another day of gold stocks’ clear underperformance of gold.
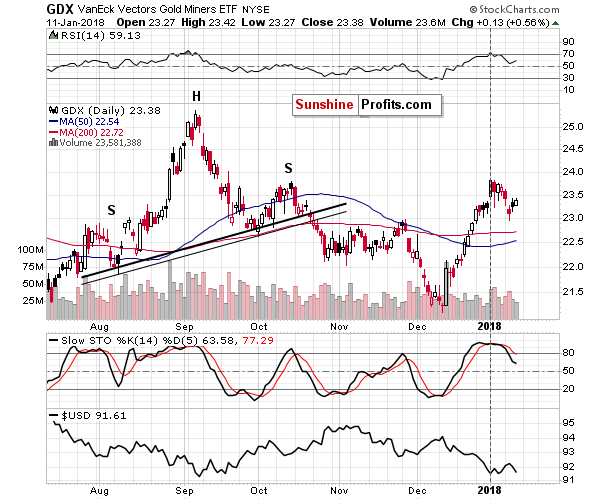
Moreover, GDX (another proxy for mining stocks) moved higher on declining volume. This serves as yet another confirmation that the rally is over and what we’re seeing now is the topping pattern of the sector. Miners have likely already topped and we’re probably seeing a top in gold right now.
All in all, silver and mining stocks are not indicating higher precious metals prices – they are pointing to lower ones. This, combined with limited upside in gold suggests that investors should be preparing themselves for lower prices, not higher ones.
Before summarizing, let’s take a step back from the day-to-day events and discuss something that is practically never discussed in the media – the relationship between gold and the Japanese stock market.
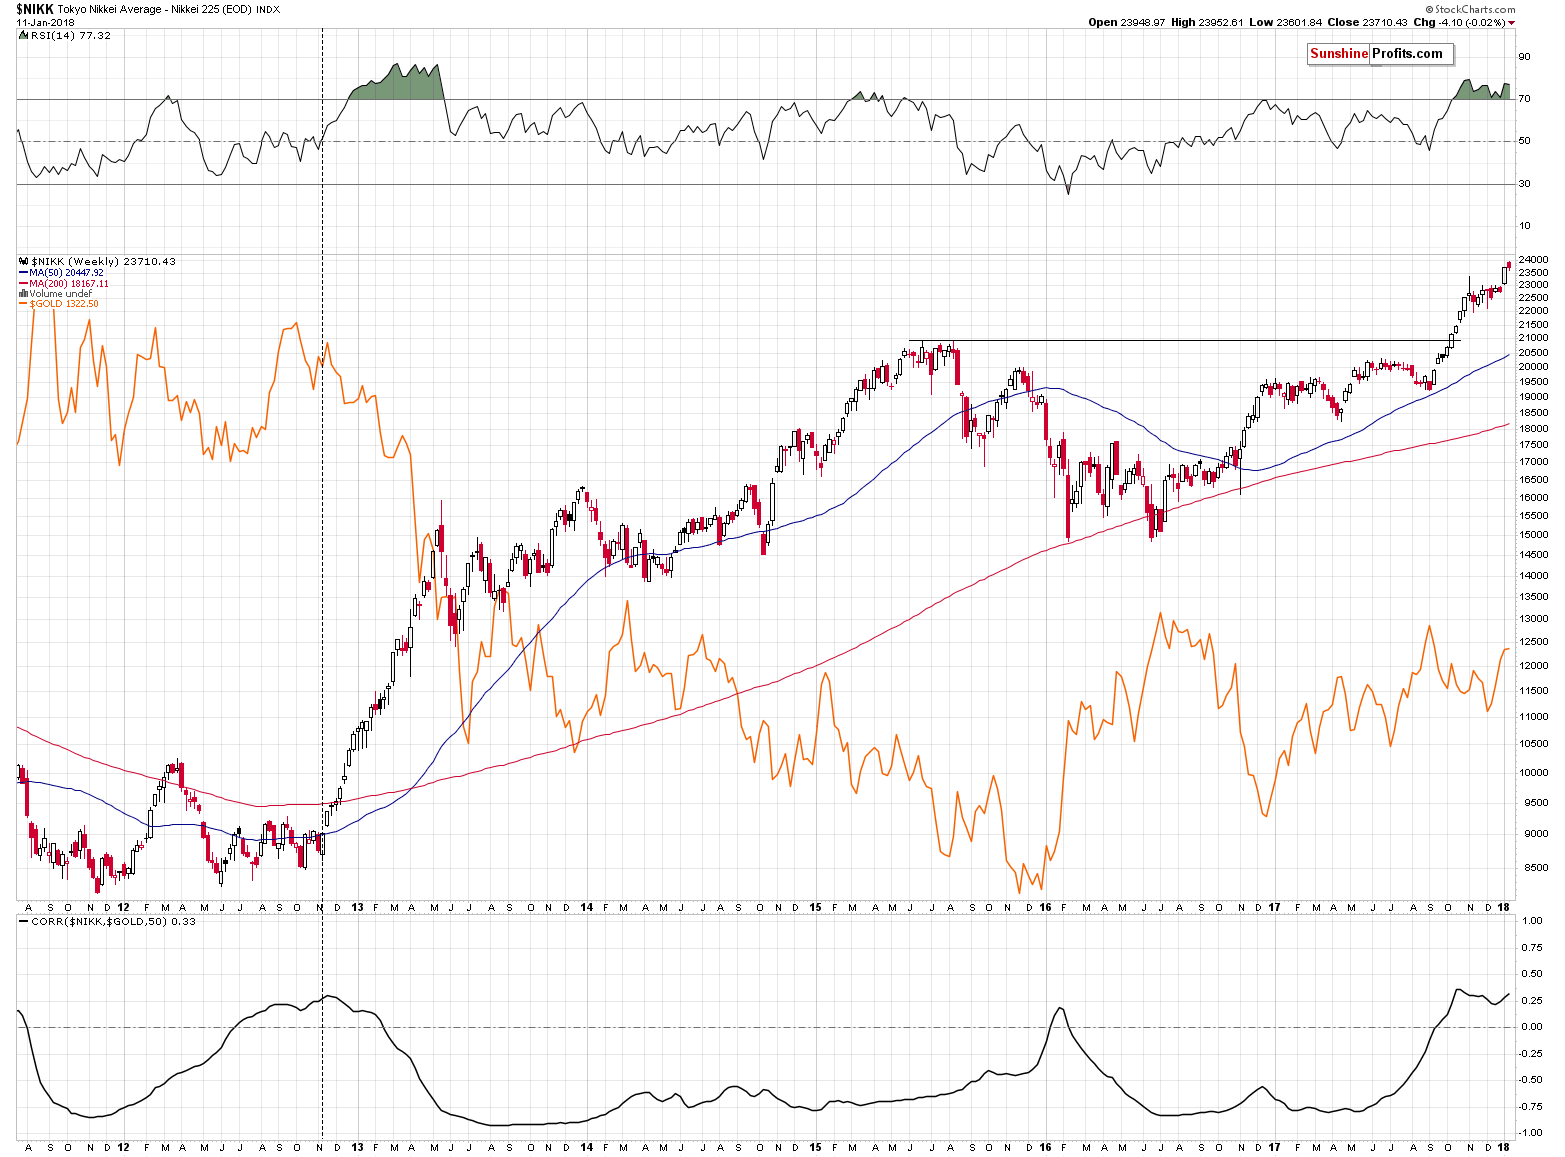
Just like gold tends to react to the USD’s movement to a varying degree, it changes its reaction toward the Japanese stocks. The relationship is generally adverse, but its strength varies. For most of the time, the correlation is negative, but it moves to 0 and even into positive territory, from time to time. It’s currently one of those times and it’s been the case for a few months now.
Since the correlation coefficient moved above 0, it managed to top, decline and move higher again. This may not seem significant, but only until you consider the only time in the recent past when something similar was taking place. It was in November 2012 and we marked this situation with a vertical dashed line. That was after a sizable upswing, a decline and another move higher, but not above the previous high. Gold is in the same situation right now.
History tends to repeat itself, so detecting a similarity in the price pattern is useful and can be very meaningful. However, when the similarity is confirmed by many other signs that we discussed in other alerts and even the correlation with the Japanese stocks, then it becomes a very important roadmap for the future. Whether we see a very short-term rally in gold or not, the outlook for the following weeks remains very bearish.
Summing up, the medium-term outlook for the precious metals market remains bearish as confirmed by multiple factors, and based on the most recent short-term factors, it seems that the corrective upswing in gold, silver and mining stocks is already over. The mining stocks’ underperformance of gold, along with the fact that the GDX topped during the first session of the year, suggest that the decline is already underway.
Still, if the USD Index declines in the short term, gold could respond by moving higher, just like it did yesterday. That’s something we should keep in mind. This would most likely not be anything important and, in a few weeks, it would seem like a blip on the radar screen. If the situation appears otherwise – we’ll let you know.
As always, we will keep you – our subscribers – informed.
To summarize:
Trading capital (supplementary part of the portfolio; our opinion): Full short positions (150% of the full position) in gold, silver and mining stocks are justified from the risk/reward perspective with the following stop-loss orders and initial target price levels:
- Gold: initial target price: $1,218; stop-loss: $1,353; initial target price for the DGLD ETN: $53.98; stop-loss for the DGLD ETN $39.28
- Silver: initial target price: $14.63; stop-loss: $17.62; initial target price for the DSLV ETN: $33.88; stop-loss for the DSLV ETN $21.78
- Mining stocks (price levels for the GDX ETF): initial target price: $19.22; stop-loss: $26.14; initial target price for the DUST ETF: $39.88; stop-loss for the DUST ETF $19.78
In case one wants to bet on junior mining stocks' prices (we do not suggest doing so – we think senior mining stocks are more predictable in the case of short-term trades – if one wants to do it anyway, we provide the details), here are the stop-loss details and initial target prices:
- GDXJ ETF: initial target price: $27.82; stop-loss: $38.22
- JDST ETF: initial target price: $94.88 stop-loss: $37.78
Long-term capital (core part of the portfolio; our opinion): No positions (in other words: cash)
Insurance capital (core part of the portfolio; our opinion): Full position
Important Details for New Subscribers
Whether you already subscribed or not, we encourage you to find out how to make the most of our alerts and read our replies to the most common alert-and-gold-trading-related-questions.
Please note that the in the trading section we describe the situation for the day that the alert is posted. In other words, it we are writing about a speculative position, it means that it is up-to-date on the day it was posted. We are also featuring the initial target prices, so that you can decide whether keeping a position on a given day is something that is in tune with your approach (some moves are too small for medium-term traders and some might appear too big for day-traders).
Plus, you might want to read why our stop-loss orders are usually relatively far from the current price.
Please note that a full position doesn’t mean using all of the capital for a given trade. You will find details on our thoughts on gold portfolio structuring in the Key Insights section on our website.
As a reminder – “initial target price” means exactly that – an “initial” one, it’s not a price level at which we suggest closing positions. If this becomes the case (like it did in the previous trade) we will refer to these levels as levels of exit orders (exactly as we’ve done previously). Stop-loss levels, however, are naturally not “initial”, but something that, in our opinion, might be entered as an order.
Since it is impossible to synchronize target prices and stop-loss levels for all the ETFs and ETNs with the main markets that we provide these levels for (gold, silver and mining stocks – the GDX ETF), the stop-loss levels and target prices for other ETNs and ETF (among other: UGLD, DGLD, USLV, DSLV, NUGT, DUST, JNUG, JDST) are provided as supplementary, and not as “final”. This means that if a stop-loss or a target level is reached for any of the “additional instruments” (DGLD for instance), but not for the “main instrument” (gold in this case), we will view positions in both gold and DGLD as still open and the stop-loss for DGLD would have to be moved lower. On the other hand, if gold moves to a stop-loss level but DGLD doesn’t, then we will view both positions (in gold and DGLD) as closed. In other words, since it’s not possible to be 100% certain that each related instrument moves to a given level when the underlying instrument does, we can’t provide levels that would be binding. The levels that we do provide are our best estimate of the levels that will correspond to the levels in the underlying assets, but it will be the underlying assets that one will need to focus on regarding the signs pointing to closing a given position or keeping it open. We might adjust the levels in the “additional instruments” without adjusting the levels in the “main instruments”, which will simply mean that we have improved our estimation of these levels, not that we changed our outlook on the markets. We are already working on a tool that would update these levels on a daily basis for the most popular ETFs, ETNs and individual mining stocks.
Our preferred ways to invest in and to trade gold along with the reasoning can be found in the how to buy gold section. Additionally, our preferred ETFs and ETNs can be found in our Gold & Silver ETF Ranking.
As a reminder, Gold & Silver Trading Alerts are posted before or on each trading day (we usually post them before the opening bell, but we don't promise doing that each day). If there's anything urgent, we will send you an additional small alert before posting the main one.
=====
Latest Free Trading Alerts:
Will 2018 be better than 2017 for the yellow metal? We invite you to read our today’s article, painting the macroeconomic outlook for 2018 and learn how gold is likely to perform in such environment.
Macroeconomic Outlook for 2018 and Gold
=====
Hand-picked precious-metals-related links:
PRECIOUS-Gold set for 5th week of gains, buoyed by slump in dollar
=====
In other news:
Death of Bond Bull Market Greatly Exaggerated, Options Show
Fed's Dudley Worries Tax Cuts Risk Overheating U.S. Economy
The Broader Ramifications of Wal-Mart's Wage Hike
GOP leaders feel squeeze as shutdown threat nears
Investors Raise Bets on Surging Commodities as Oil Tops $70
=====
Thank you.
Sincerely,
Przemyslaw Radomski, CFA
Founder, Editor-in-chief, Gold & Silver Fund Manager
Gold & Silver Trading Alerts
Forex Trading Alerts
Oil Investment Updates
Oil Trading Alerts

