

Briefly: in our opinion, full (250% of the regular size of the position) speculative short position in gold, silver, and mining stocks are justified from the risk/reward perspective at the moment of publishing this Alert. We are moving the stop-loss levels for silver and mining stocks.
Gold broke above the $1,400 level last week and the volume that corresponded the move was exceptional. The story doesn't end there. The volume for silver was big and the volume for silver stocks was truly epic. Something very, very, very important is happening right now. You knew a part of the story for weeks now... And the last week seems to have written its conclusive verse.
What is it that you knew about in advance? The reversals! It's the final part of June and that's when long-term triangle-vertex-based reversals were supposed to take place. Based on indications that we had available weeks ago, it seemed more likely that we will see a decline and an interim bottom at this time. However, based on the relatively chaotic political and monetary announcements of the recent past, the precious metals sector moved higher. Silver moved rather insignificantly so, but still, the move was visible, and we can say that they all (gold, silver, and mining stocks) moved higher recently. This means that all triangle-vertex-based reversals should be interpreted as strong indications of a top. Strong, because they confirm each other based on entirely different price patterns. Let's take a look below for details.
The Reversals
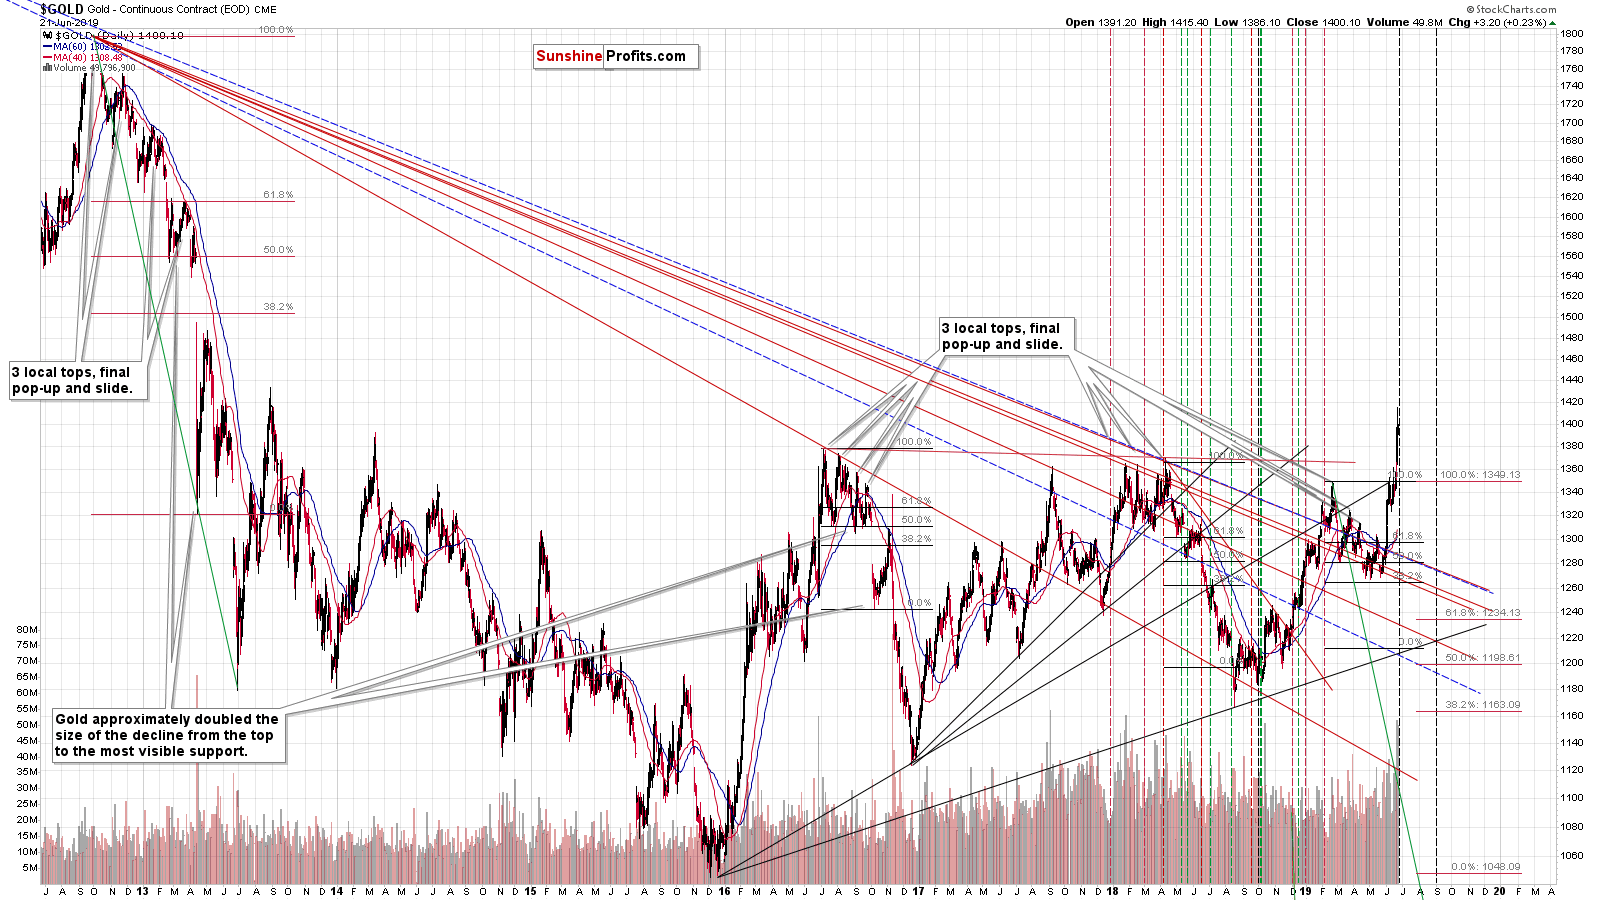
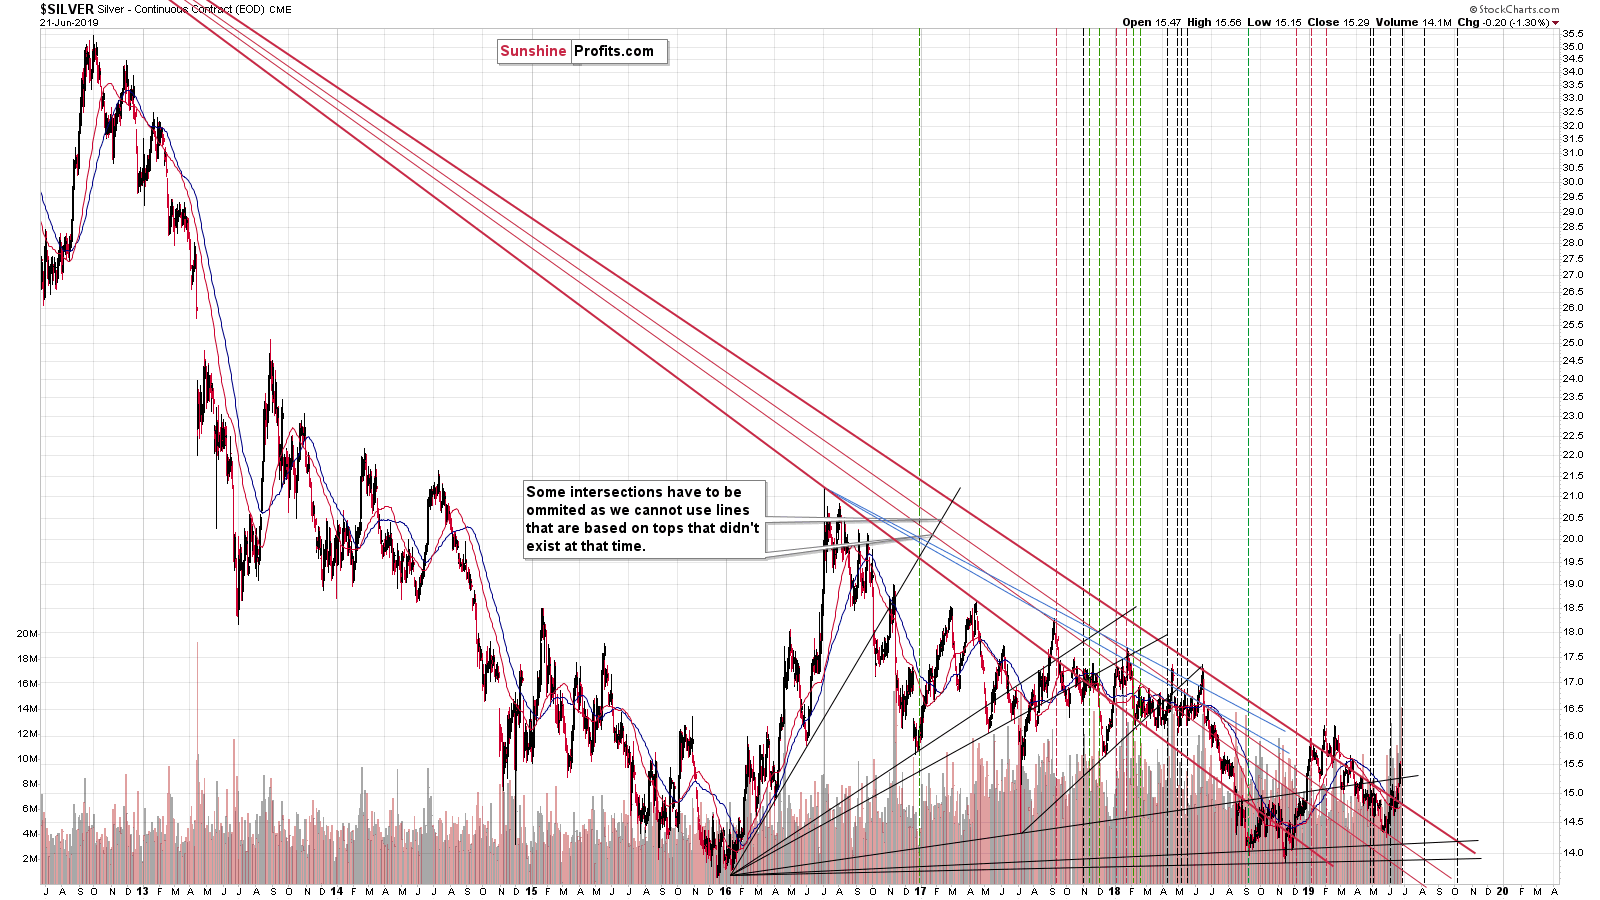
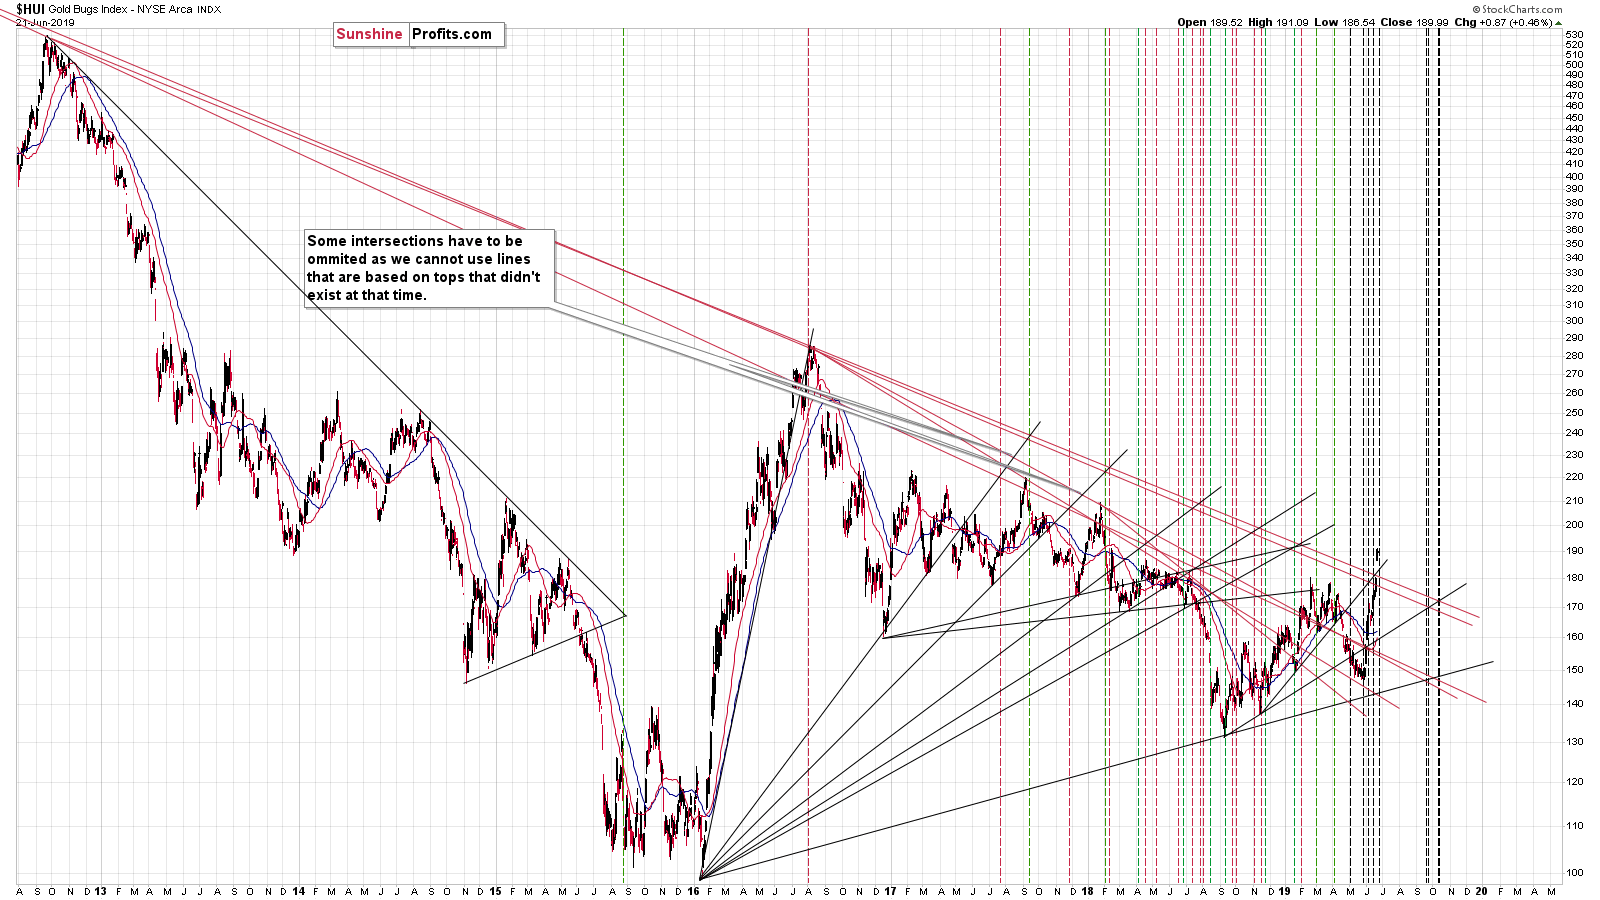
In all cases we see a reversal based on triangles that are created using very long-term support and resistance lines. This is the only reversal that we can see in the next several months that is confirmed by all 3 above-mentioned markets. This - on its own - is a very good reason not to take gold's and miners' recent rally on its face value.
There are quite many additional reasons not to do so, and their big share is based on volume. Extremely high volume usually means extremely high emotions. And what do extremely high emotions accompany? Extreme tops and extreme bottoms. The most recent short-term move has definitely been up, so it can't be a bottom. This leaves us with the top scenario. As is the case with the above-mentioned reversals, the more confirmations from different markets we get, the more reliable this indication becomes.
And where did we see it?
For instance, in gold. It was the second-biggest weekly volume reading ever in case of weekly rallies.
Gold, Resistance and Extreme Volume
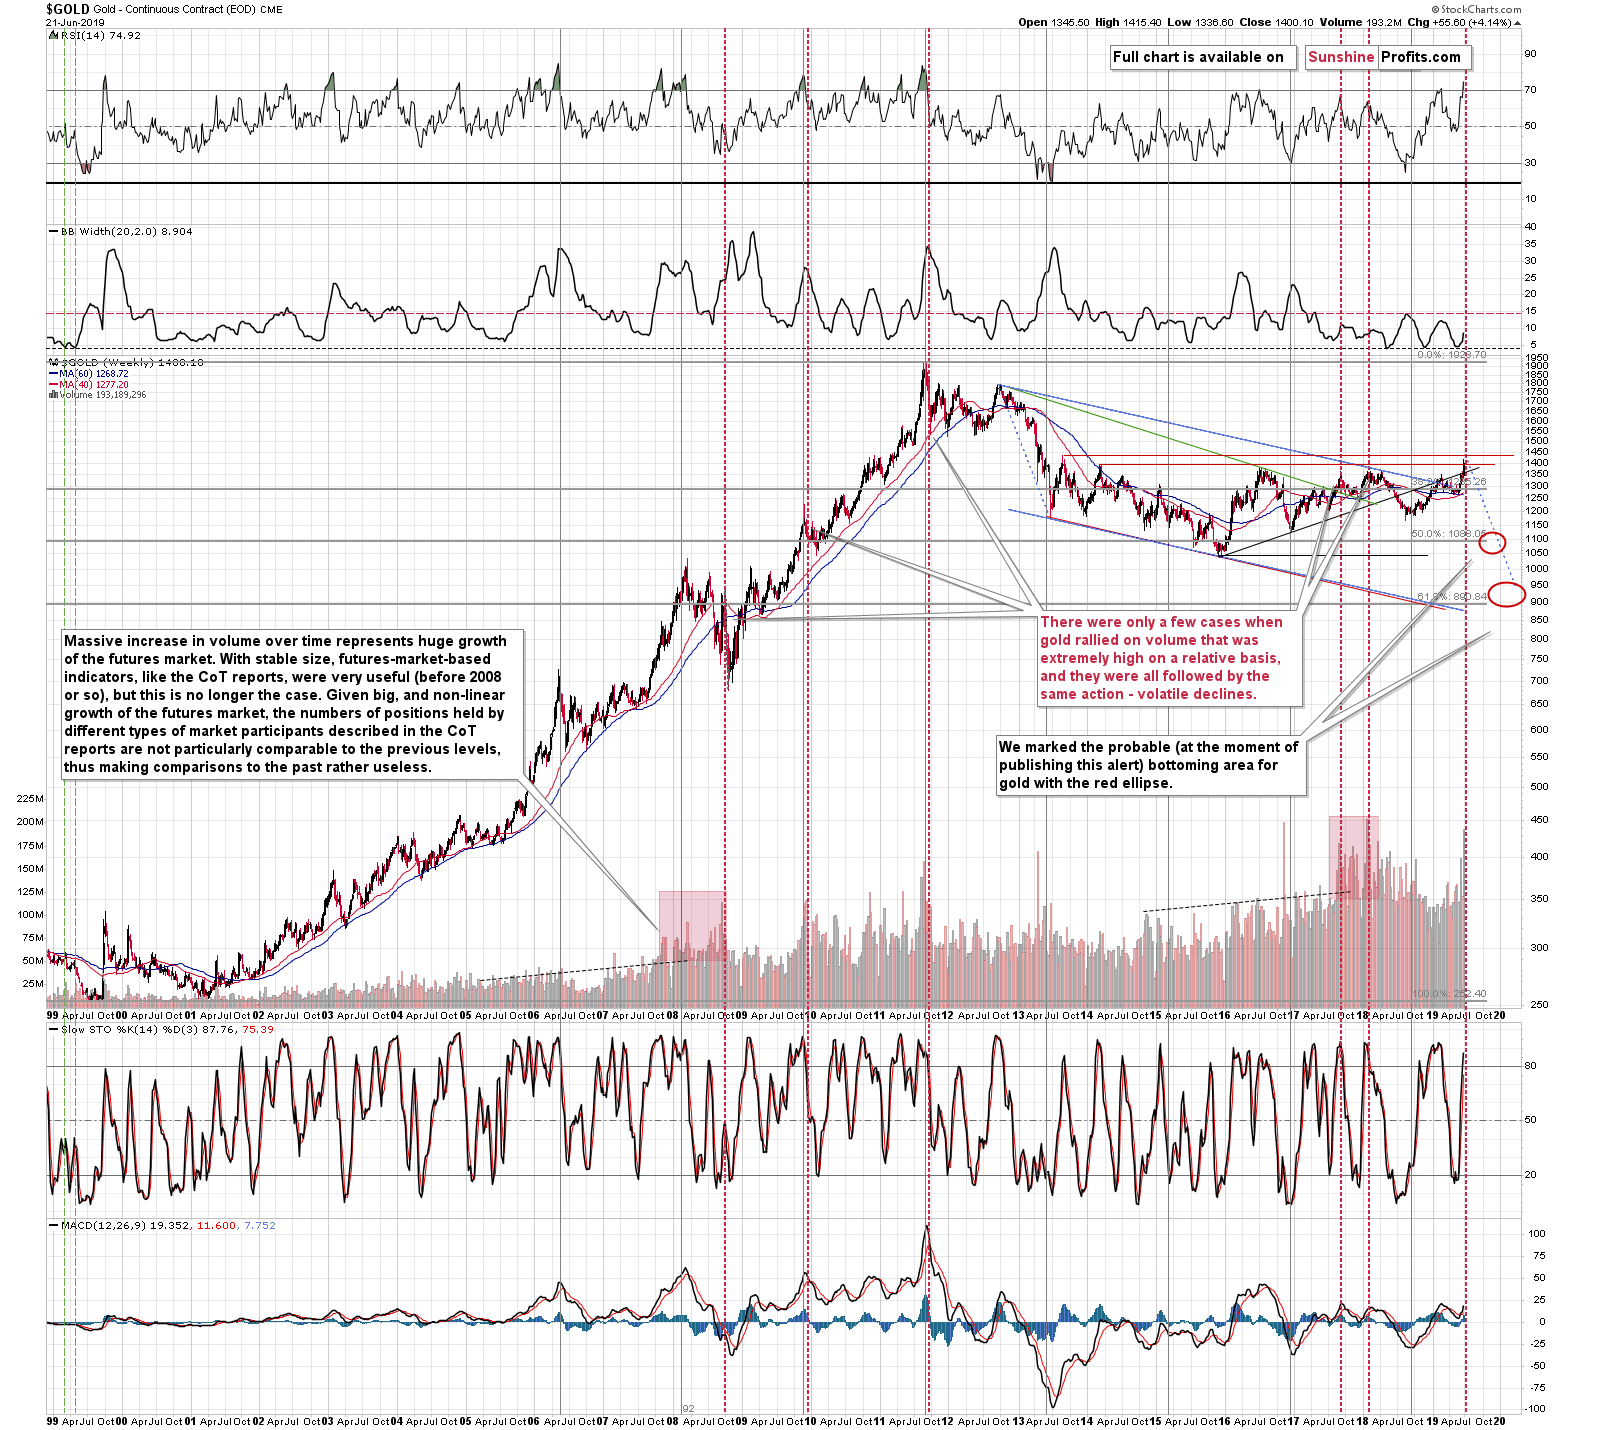
It is rare when gold rallies on extremely huge volume during the week and it is extremely rare when this happens after weeks during which the volume was relatively low.
The volume spikes represent different situations when we see them during gold's declines and when we see them during gold's rallies. It's rather obvious why it's best to compare apples to apples, so it's no surprise that in order to check what happened in cases that are similar to the current ones, it's best to focus on the huge-volume weekly rallies.
We marked these similar cases with red vertical lines. There were four cases that were very similar when looking at gold from the broad perspective. There was one more in the more recent past that is clearer once we zoom in. The four above-mentioned cases are:
- the late 2008 top that was almost immediately followed by a huge decline
- the late 2009 top that was followed by a notable decline that took a few months
- the 2011 top - no comment is necessary here
- the mid-2017 top - one of the most important tops of the recent years that was followed by several-month-long decline
- the early-2018 top - as above - one of the most important tops of the recent years that was followed by several-month-long decline
Since all similar cases point to the same outcome, the implications are obvious. History tends to rhyme, so gold is likely to slide in the following months and weeks.
Gold is only one of the markets that provided us with the huge volume reading.
The Multitude of Silver Signs
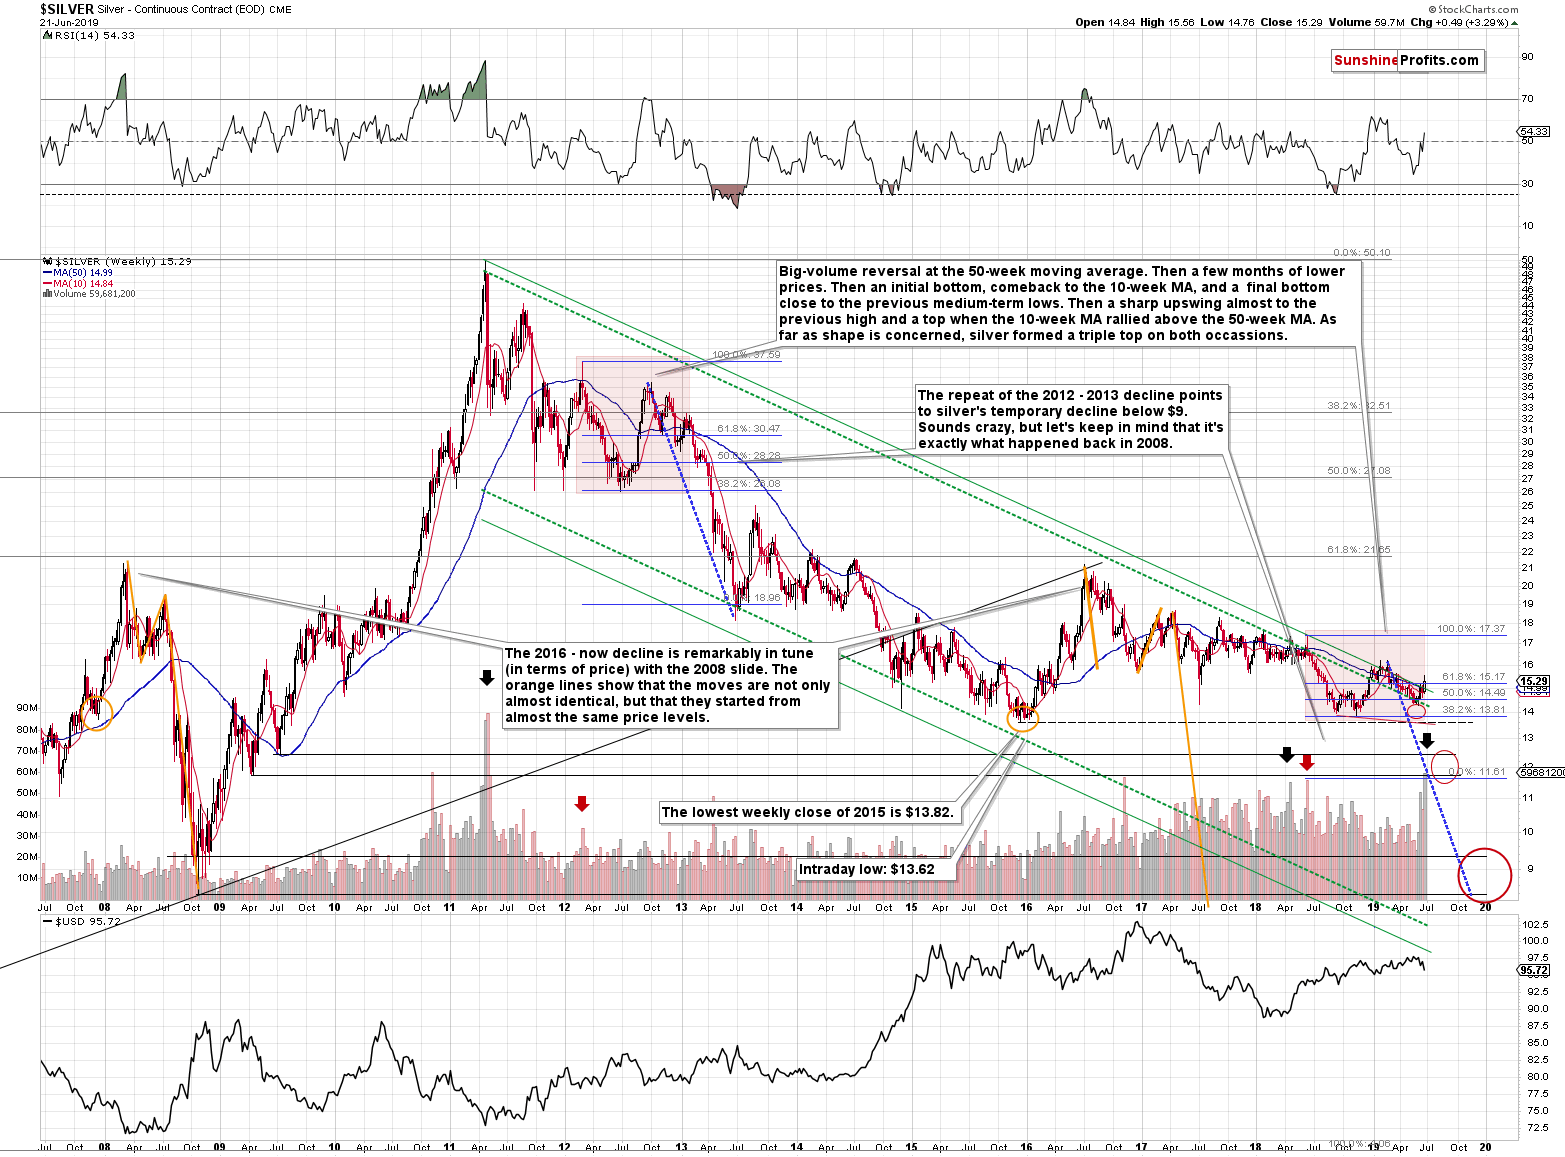
Last week's volume in silver was also the second biggest when taking the weekly rallies into account. Except for the biggest weekly volume reading (the 2011 top), there was one additional similar weekly volume reading. It was in April 2018, close to silver's 2018 high. Both times (we marked them with black arrows) were extremely favorable shorting opportunities and one of the worst moments to be or get long silver.
There are also red arrows on the above chart that mark the beginning of the silver self-similar pattern that is also marked using the red area on the price chart. The recent rally in gold made the analogy to the 2012-2013 decline rather unclear, but it remains perfectly intact in case of silver, which is not as easily influenced by Twitter politics. What we saw in silver recently, was a relatively small rally when compared to the 2019 decline. That's very similar to what we saw in early 2013. Both moving averages: the 10- and 50-week ones are declining, and this corrective upswing took silver a bit above them. The same thing happened in early 2013. Many people thought that the worst is over, and that silver will keep on rallying from that point. Instead, we have never seen higher silver prices since that time. In fact, the white metals' price was more than cut in half.
The biggest shocker as far as volume is concerned came from the silver stocks.
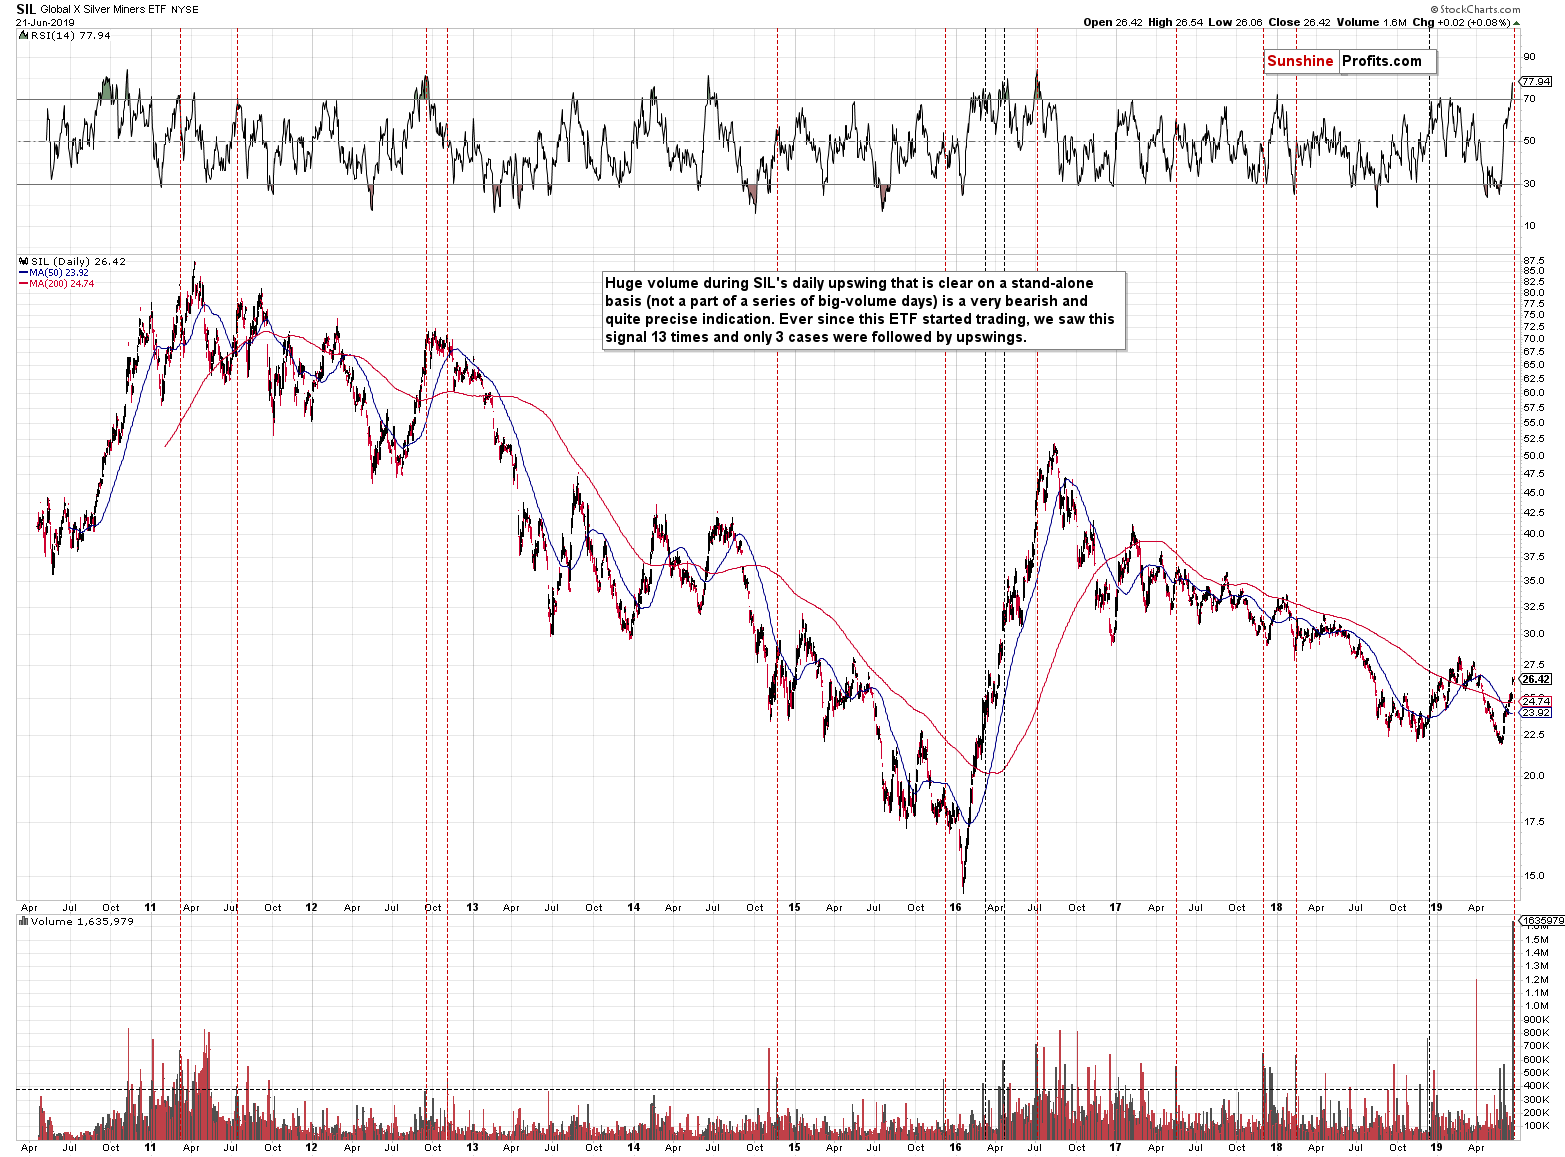
Friday's SIL volume was truly breathtaking. It was the biggest volume ever and if we take only the daily rallies into account it was more than twice as big as the second biggest value. And what did SIL do on Friday? It moved back and forth, while closing almost unchanged, thus creating a doji candlestick. Doji after a rally and accompanied on huge volume is a sign of reversal. This, accompanied by very overbought status as indicated by the RSI has profoundly bearish implications going forward.
Let's stay with silver for a while. Did you realize that despite gold's volatile movement, the white metal has been very... boring?
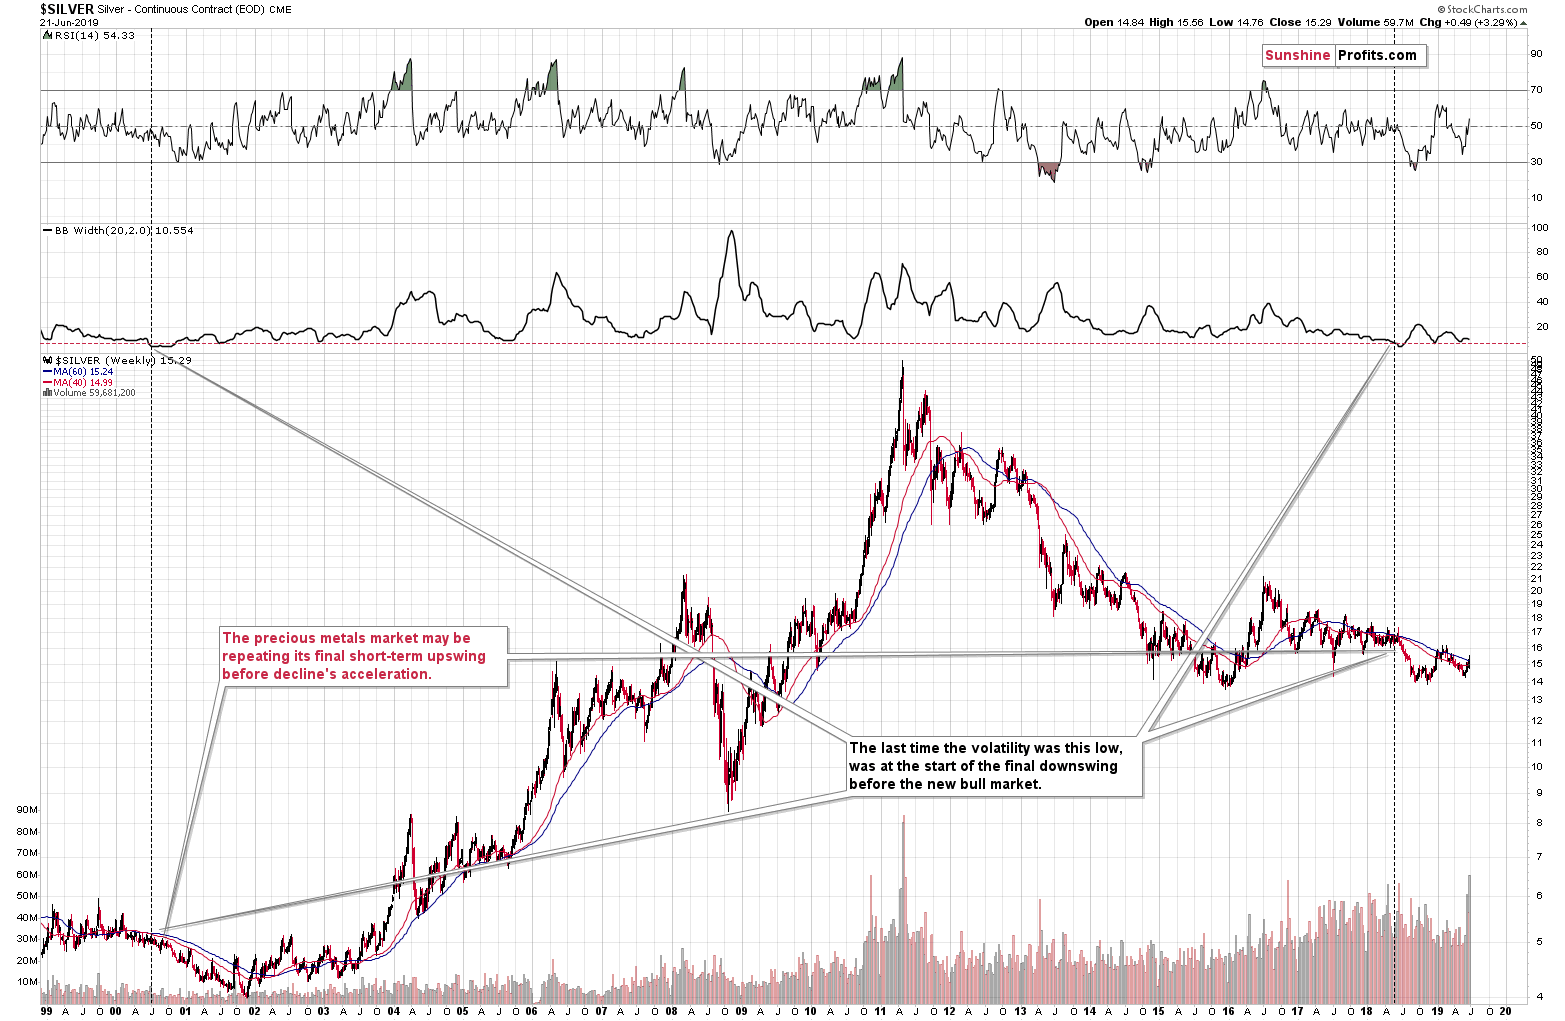
The indicator that is visible on the above chart second from top is the width of the Bollinger Band. It's a proxy for the market volatility. Please note how the moves in silver (especially upswings) became smaller over time. It came to the point when gold moved above its 2016 high, while silver is relatively close to the 2015 bottom.
The key question is when was silver just as boring (calm) and when did it take place for as long as it's been taking place right now. The answer is that it was the case about 20 years ago right before silver's slide to its final bottom. This analogy continues to favor the scenario in which we get lower precious metals values and the true bottom after a several-month-long decline.
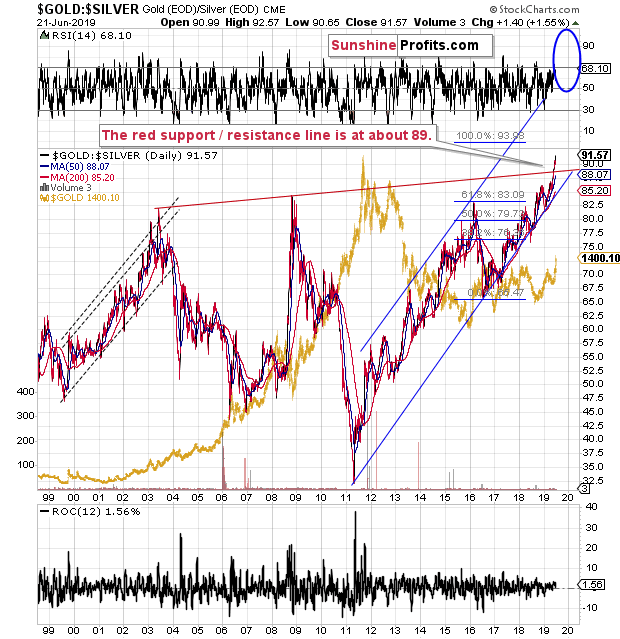
Meanwhile, the gold to silver ratio continues to soar, suggesting that the true bottom for the precious metals sector is not yet in.
Let's move to the mining stocks. Unlike silver, they moved considerably higher in the recent past.
Gold Miners' Correction
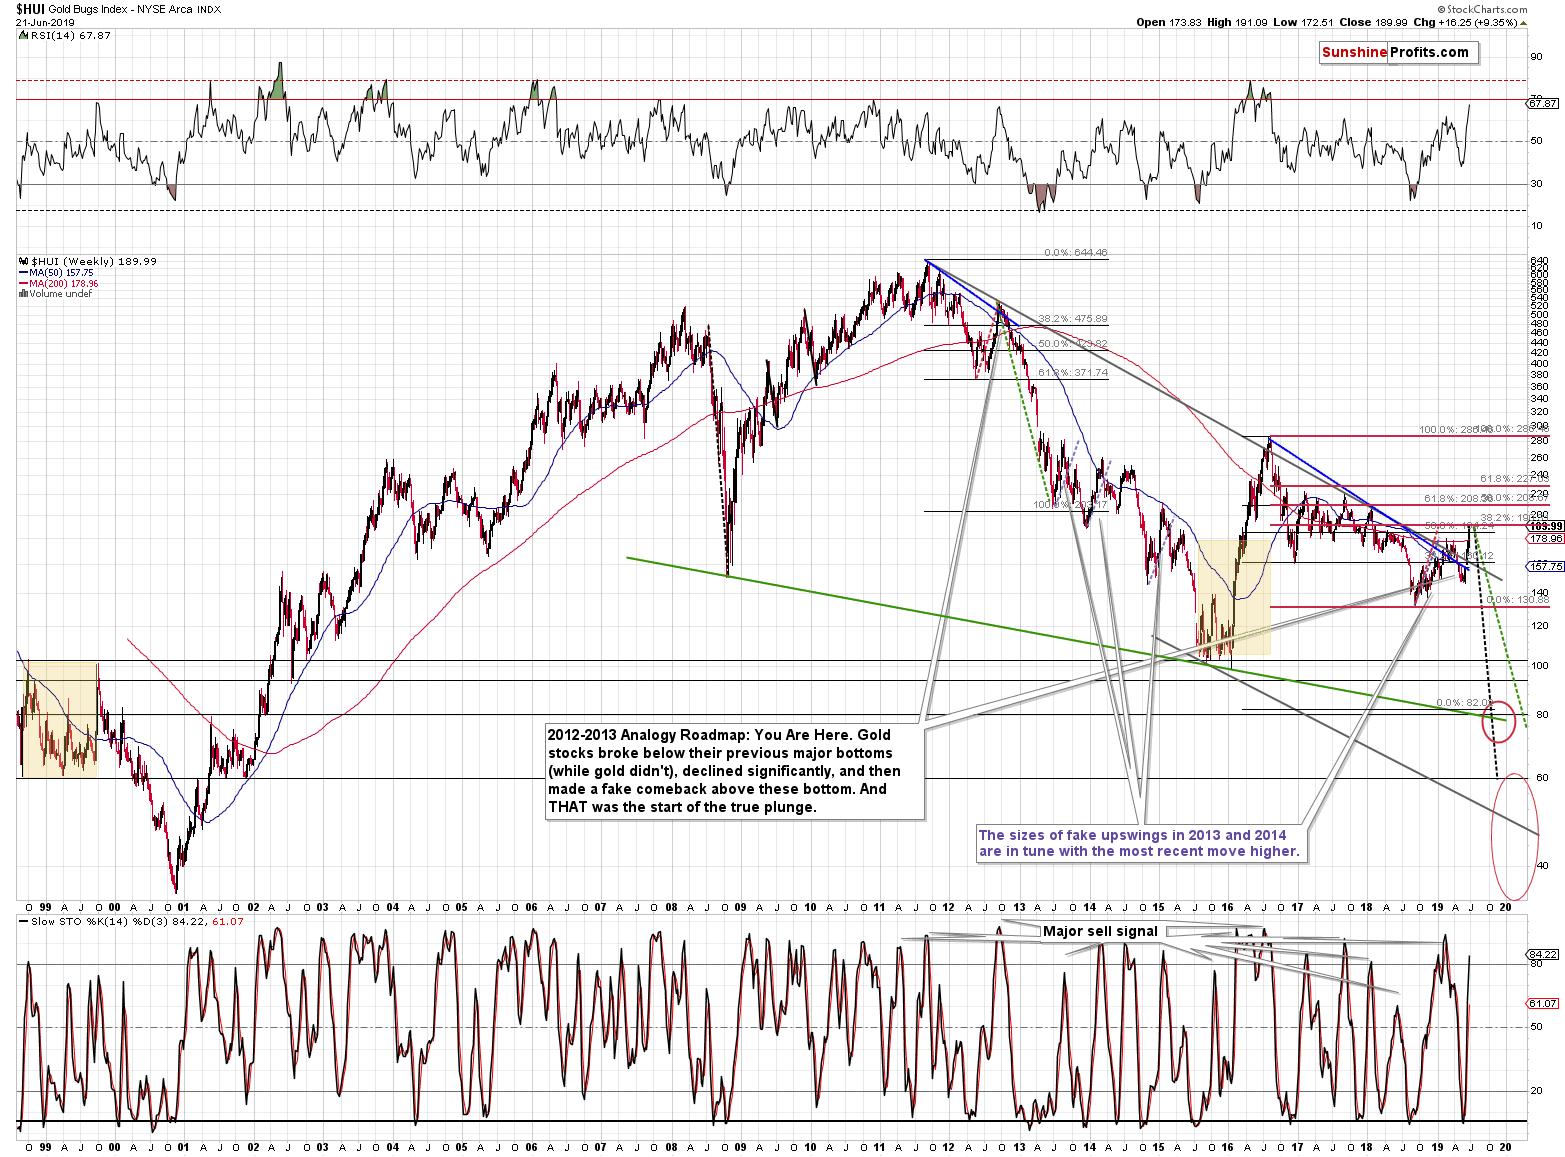
But is the move really that significant? The blue (or purple depending on one's screen settings) lines that you can see on the above chart are identical. The mid-2013 rally, the late-2013 - early-2014 rally, the late-2014 - early-2015 rally, and the current upswing are almost identical. Almost, because the current one is just slightly bigger.
In 2016, gold miners soared much higher and much faster based on almost no meaningful fundamental news. This time, we have already seen myriads of bullish news for the precious metals market and miners rallied only a little more than during the above-mentioned corrections. The entire upswing - even though it appears important - looks like yet another corrective upswing, not like the powerful upleg that we saw in 2016.
The current move higher is a bit bigger than the other upswings that we saw in 2013, 2014 and 2015, but do you know what was practically identical?
The May 16, 2012 low was 372.74 and the September 21, 2012 high was 529.80, so the during the 2012 correction, the HUI Index gained about 42%.
The 2018 low was 131.12. Friday's high was 191.09. That's about 45% - the moves are almost identical in terms of size. We marked both moves dashed red lines. The 3% difference is practically invisible on the chart.
We already wrote that the HUI Index is not even close to its 2016 high, but there's more to it than just that. The index just reached the 38.2% Fibonacci retracement levels based on the decline from this high to the 2018 bottom. It didn't even erase half thereof. Are gold stocks leading the way higher here? Absolutely not.
There is also another similarity to the recent upswing - in terms of sharpness. Please take a look at the 1999 rally that preceded the slide to the final low. Gold rallied sharply at that time as well. It was right after the Brown bottom in gold, which adds to the similarity to the current situation. The fundamental news is different, but it's of similar nature. We didn't see one single extremely bullish sign for gold this time, but we saw a series of fundamental news that were almost as chaotic as Gordon Brown's decision. The trade war with China, the supposed tariff on Mexico, much more dovish Fed, public calling for lower US dollar and there was even a quite oddly justified Iran accusation.
Please remember that after the 1999 top, mining stocks declined by about 65%, before declining. Applying this to the current 190 value, provides us with 66.5 as the target... Not too bullish after all.
Let's look at gold miners' performance relative to gold from the long-term point of view.
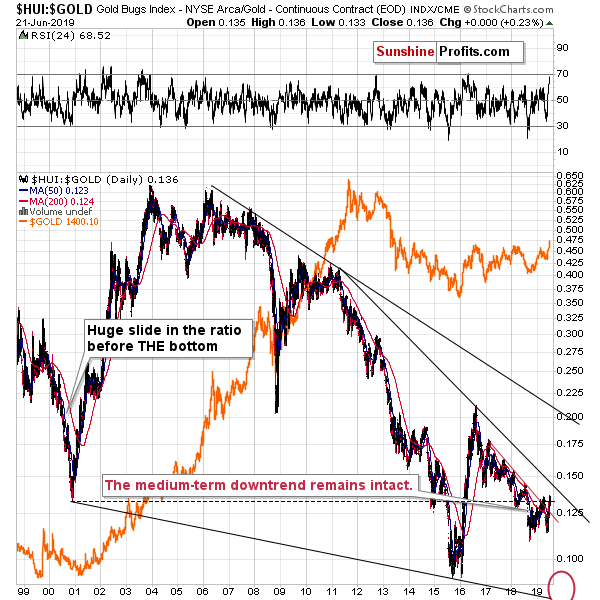
There was no major rally - only a small move above the declining red resistance line. The previous 2019 attempt was quickly invalidated, so we simply might see something analogous shortly.
The above chart is particularly useful, because it shows you how different the current situation is from what happened in 2016. It's much more similar to what happened in mid-2012 - a corrective upswing above the 200-day moving average that was visible from the short-term point of view, but only a little more than a blip on the radar screen, when looking at the big picture.
If we look at a different proxy for the mining stocks and compare it with the analogous instrument, we get a very interesting short-term reading.
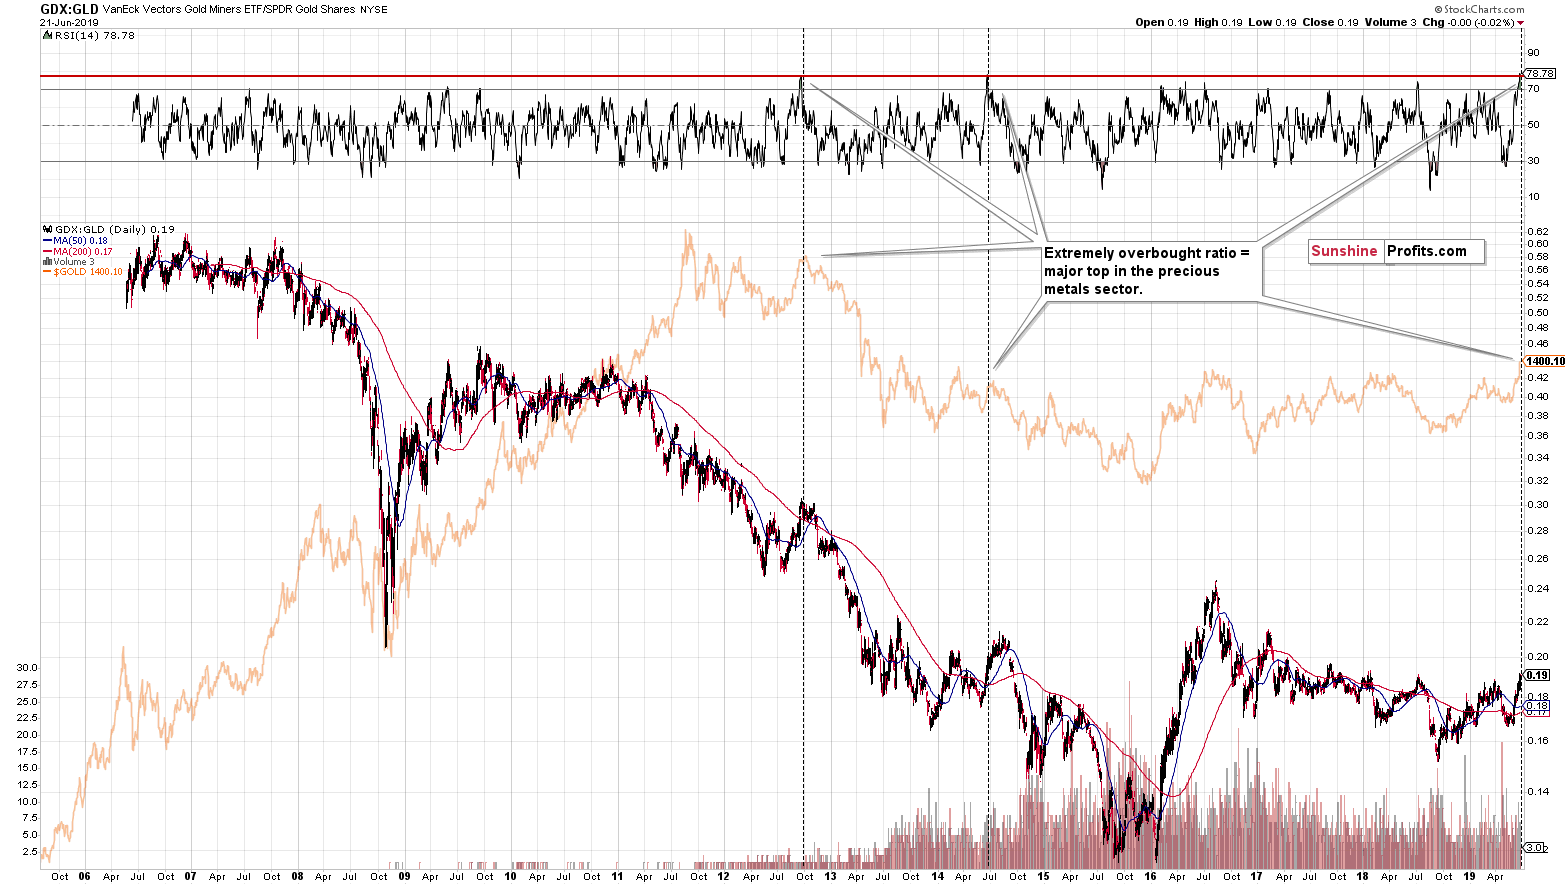
The GDX to GLD ratio shows the same kind of corrective upswing within a bigger downtrend, but in this case we see also something else. The RSI indicator based on the ratio just moved to... it's all time high. There were only two cases when the RSI was almost as overbought as it is right now. It was at the 2012 top and at the 2014 top. Since they were both tops, it seems that we are looking at another top right now. The analogy to the 2012 top is particularly important, because that's the same thing that we could see based on the size of the upswing (42% vs. the current 45%).
Two different techniques pointing to the same analogy are much more important than just one of them. Especially given all the extreme volume readings and the triangle-vertex-based reversals.
Before summarizing, let's take a look at the USD Index.
The USD Target
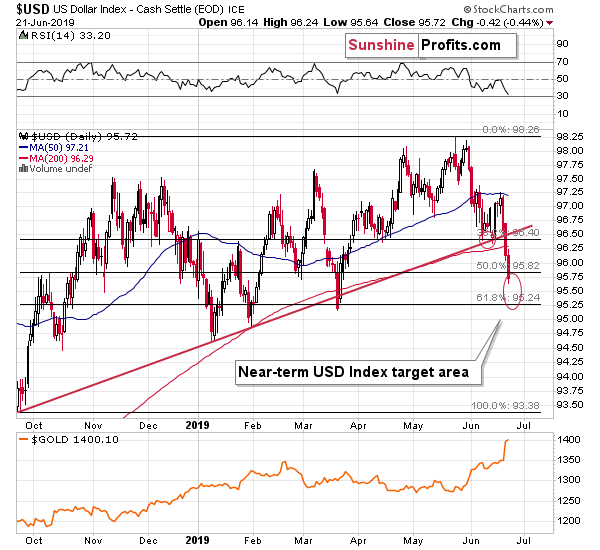
The USD Index bottomed at our first target area and at the moment of writing these words it's at the current target area. The lower border thereof is created by the March low and the 61.8% Fibonacci retracement based on the entire September - May rally. All the previous medium-term bottoms were higher than the previous one, so it seems likely that the USD will reverse above the March bottom. The above-mentioned retracement is a good candidate as the place where the reversal could take place. Being at 95.24, it's 0.48 below yesterday's closing price. At the moment of writing these words, the USD Index is 0.18 lower, so it could decline about 0.3 more today before bottoming. Naturally, that's not required, and it could rally right away based on its long-term trend.
This reversal would probably trigger gold's reversal and push gold back below the $1,400 level. The invalidation of this move would likely trigger further selling and thus a top would be formed. Given the similarity to both: 1999 and late-2012 bottoms in gold stocks, the following decline is likely to be epic.
Summary
Summing up, the gold-silver ratio, silver itself, gold stocks to gold ratio, the size of the upswing in the gold stocks, and the situation in the USD Index all suggest that the most recent move higher in the precious metals sector is nothing more than just a corrective upswing within a bigger trend. It is only gold price itself that can make one wonder if gold has truly broken out and that it will now continue to soar. This is doubtful, because this strength is not confirmed, as it happened right after a series of rather chaotic and surprising news. Adding extremely positive sentiment as confirmed by volume across the precious metals board and the very strong triple vertex-based reversal indication makes the outlook for gold much less bullish that everyone and their brother would have you believe. Please note that we are not "married" to the bearish outlook for gold and we will return to viewing the medium-term outlook as bullish, but not until the cold analysis suggests that the tables have indeed turned. This is not the case right now - please look at today's charts for details. In particular, it's a bad idea to adjust one's outlook just because many people got excited. The excitation itself is a sign of a turnaround, not something to take at the face value.
We are moving the stop-loss level higher in case of silver and mining stocks.
As always, we'll keep you - our subscribers - informed.
To summarize:
Trading capital (supplementary part of the portfolio; our opinion): Full short position (250% of the full position) in gold, silver, and mining stocks is justified from the risk/reward perspective with the following stop-loss orders and exit profit-take price levels:
- Gold: profit-take exit price: $1,241; stop-loss: $1,452; initial target price for the DGLD ETN: $51.87; stop-loss for the DGLD ETN $31.67
- Silver: profit-take exit price: $13.81; stop-loss: $16.32; initial target price for the DSLV ETN: $39.38; stop-loss for the DSLV ETN $23.87
- Mining stocks (price levels for the GDX ETF): profit-take exit price: $17.61; stop-loss: $26.17; initial target price for the DUST ETF: $34.28; stop-loss for the DUST ETF $10.37
In case one wants to bet on junior mining stocks' prices (we do not suggest doing so - we think senior mining stocks are more predictable in the case of short-term trades - if one wants to do it anyway, we provide the details), here are the stop-loss details and target prices:
- GDXJ ETF: profit-take exit price: $24.71; stop-loss: $36.27
- JDST ETF: profit-take exit price: $78.21 stop-loss: $23.72
Long-term capital (core part of the portfolio; our opinion): No positions (in other words: cash)
Insurance capital (core part of the portfolio; our opinion): Full position
Whether you already subscribed or not, we encourage you to find out how to make the most of our alerts and read our replies to the most common alert-and-gold-trading-related-questions.
Please note that the in the trading section we describe the situation for the day that the alert is posted. In other words, it we are writing about a speculative position, it means that it is up-to-date on the day it was posted. We are also featuring the initial target prices, so that you can decide whether keeping a position on a given day is something that is in tune with your approach (some moves are too small for medium-term traders and some might appear too big for day-traders).
Plus, you might want to read why our stop-loss orders are usually relatively far from the current price.
Please note that a full position doesn't mean using all of the capital for a given trade. You will find details on our thoughts on gold portfolio structuring in the Key Insights section on our website.
As a reminder - "initial target price" means exactly that - an "initial" one, it's not a price level at which we suggest closing positions. If this becomes the case (like it did in the previous trade) we will refer to these levels as levels of exit orders (exactly as we've done previously). Stop-loss levels, however, are naturally not "initial", but something that, in our opinion, might be entered as an order.
Since it is impossible to synchronize target prices and stop-loss levels for all the ETFs and ETNs with the main markets that we provide these levels for (gold, silver and mining stocks - the GDX ETF), the stop-loss levels and target prices for other ETNs and ETF (among other: UGLD, DGLD, USLV, DSLV, NUGT, DUST, JNUG, JDST) are provided as supplementary, and not as "final". This means that if a stop-loss or a target level is reached for any of the "additional instruments" (DGLD for instance), but not for the "main instrument" (gold in this case), we will view positions in both gold and DGLD as still open and the stop-loss for DGLD would have to be moved lower. On the other hand, if gold moves to a stop-loss level but DGLD doesn't, then we will view both positions (in gold and DGLD) as closed. In other words, since it's not possible to be 100% certain that each related instrument moves to a given level when the underlying instrument does, we can't provide levels that would be binding. The levels that we do provide are our best estimate of the levels that will correspond to the levels in the underlying assets, but it will be the underlying assets that one will need to focus on regarding the signs pointing to closing a given position or keeping it open. We might adjust the levels in the "additional instruments" without adjusting the levels in the "main instruments", which will simply mean that we have improved our estimation of these levels, not that we changed our outlook on the markets. We are already working on a tool that would update these levels on a daily basis for the most popular ETFs, ETNs and individual mining stocks.
Our preferred ways to invest in and to trade gold along with the reasoning can be found in the how to buy gold section. Additionally, our preferred ETFs and ETNs can be found in our Gold & Silver ETF Ranking.
As a reminder, Gold & Silver Trading Alerts are posted before or on each trading day (we usually post them before the opening bell, but we don't promise doing that each day). If there's anything urgent, we will send you an additional small alert before posting the main one.
=====
Latest Free Trading Alerts:
The broad stock market extended its bull market on Friday, as the S&P 500 index reached the new record high of 2,964.15. But it reversed its intraday upward course and closed slightly below the Thursday's closing price. So was it a downward reversal or just another short-term correction?
S&P 500 Pulling Back From New Record, Reversal?
=====
Thank you.
Sincerely,
Przemyslaw Radomski, CFA
Editor-in-chief, Gold & Silver Fund Manager

