

Briefly: in our opinion, full (200% of the regular size of the position) speculative short positions in gold, silver and mining stocks are justified from the risk/reward perspective at the moment of publishing this alert.
Gold declined yesterday and the rest of the precious metals sector followed. Silver stocks are even quite close to breaking to new 2018 lows and gold stocks just confirmed a critical move that happened last Friday, which has very important implications going forward. However, this week’s turning points are about to come into play – what’s likely to happen?
Of course, it’s more of a guesstimate than a clear prediction as it’s impossible to tell how exactly the precious metals are going to perform, but the scenario that seems to be quite realistic is the one in which metals and miners decline today and tomorrow, while miners show strength during tomorrow’s session and we see a bottom around $1,250 in gold. Then a comeback to more or less the current levels and a continuation of a decline on June 27th. There can be deviations from the above scenario, even a few-day ones, but it still seems to be the most likely outcome for the very short term.
Let’s take a look why (charts courtesy of http://stockcharts.com/).
Gold’s Decline and Downside Targets
In yesterday’s alert, we commented on the above chart in the following way:
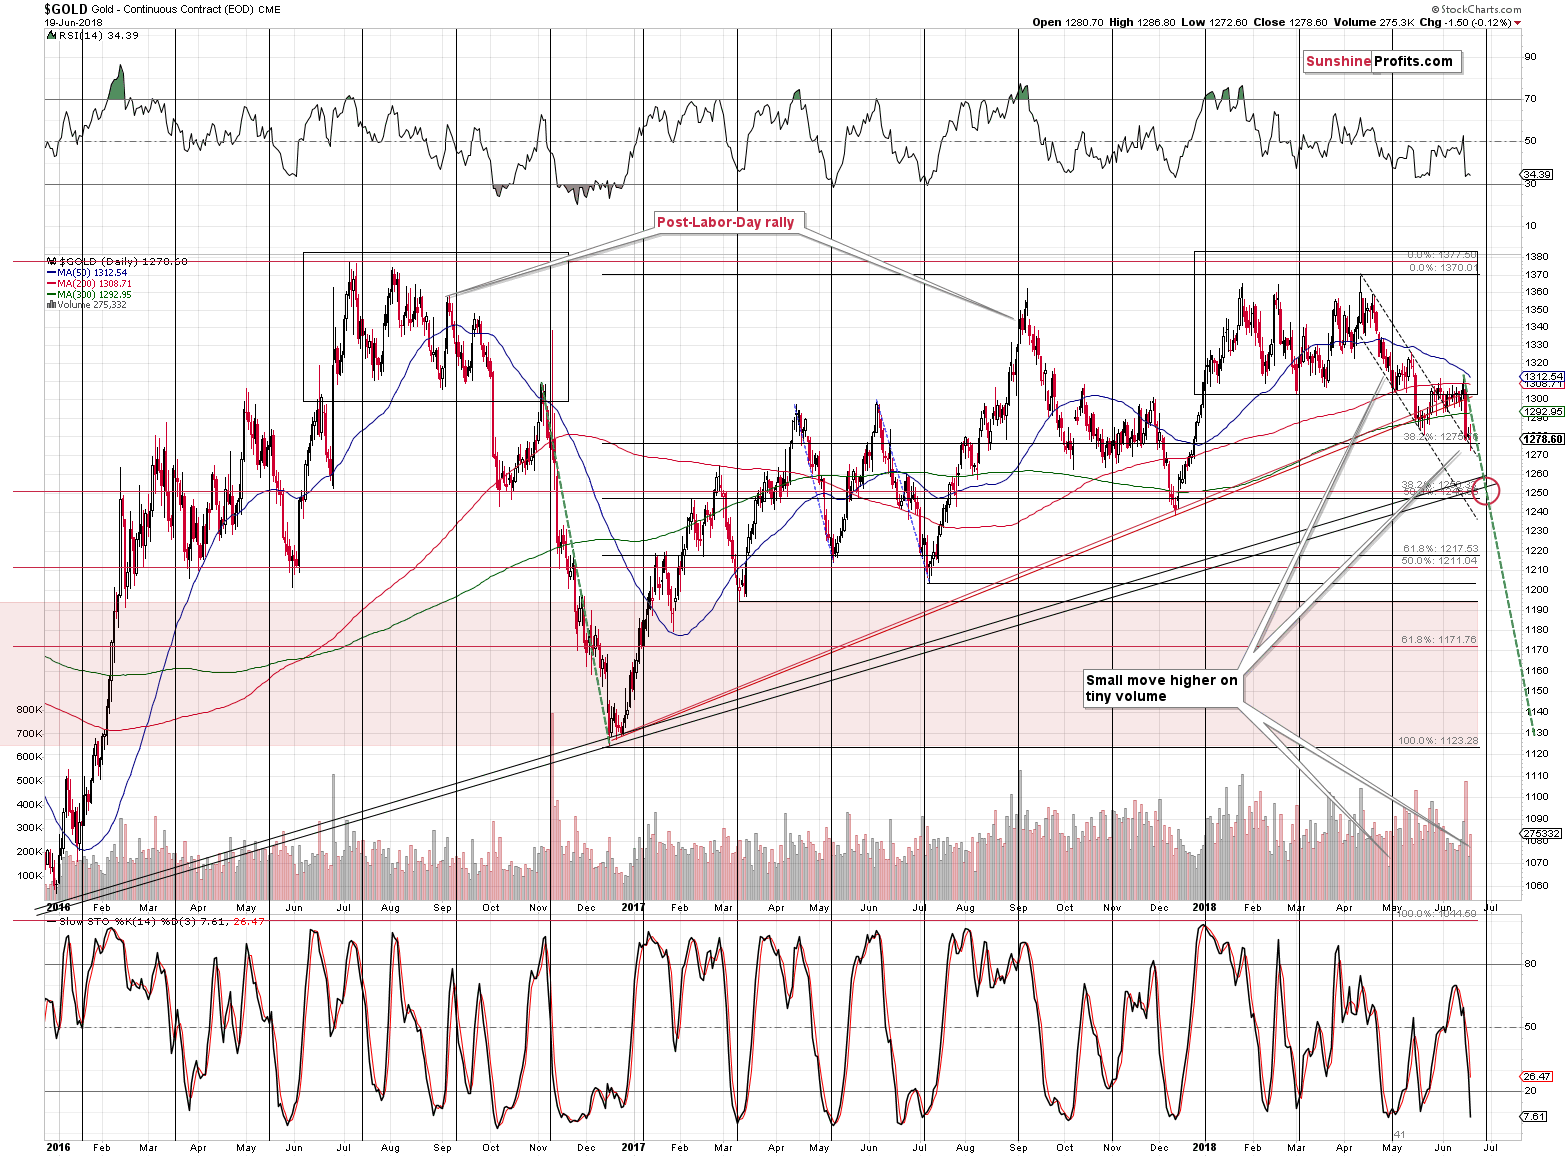
Gold moved higher very insignificantly, and the volume was very low. That’s a classic breather after a big move that doesn’t change the outlook. Moreover, that’s exactly what we saw on April the 27th and it had this textbook implication. Consequently, everything that we wrote about the precious metals market yesterday remains up-to-date. If you didn’t have the chance to read yesterday’s analysis so far, we encourage you to do so today.
The above chart shows that gold declined by only about $1, but it seems that the correct implications come from the intraday chart.
Gold declined almost $4 and it’s declining in today’s pre-market movement – at least at the moment of writing these words.
This means that yesterday’s back and forth movement shouldn’t be viewed as a form of reversal, but rather as a normal decline that followed a daily pause.
Our previous comments on gold’s downside targets remain up-to-date. Gold is still likely to take a breather close to $1,250 and then close to $1,200.
At this time, we can’t rule out a scenario in which gold pierces through $1,250 and moves even lower shortly. After all, it’s been consolidating for weeks, so since it finally started to move – one of the general rules of the technical analysis is that the longer the preparation stage is, the bigger the follow-up move becomes. In this case, it could mean that gold is about to decline quite far. That’s why we are not planning to automatically exit our short positions when gold moves to $1,250, but rather to see what kind of confirmations we get at that time and act accordingly.
Silver’s Decline Continues
In yesterday’s alert, we wrote the following:
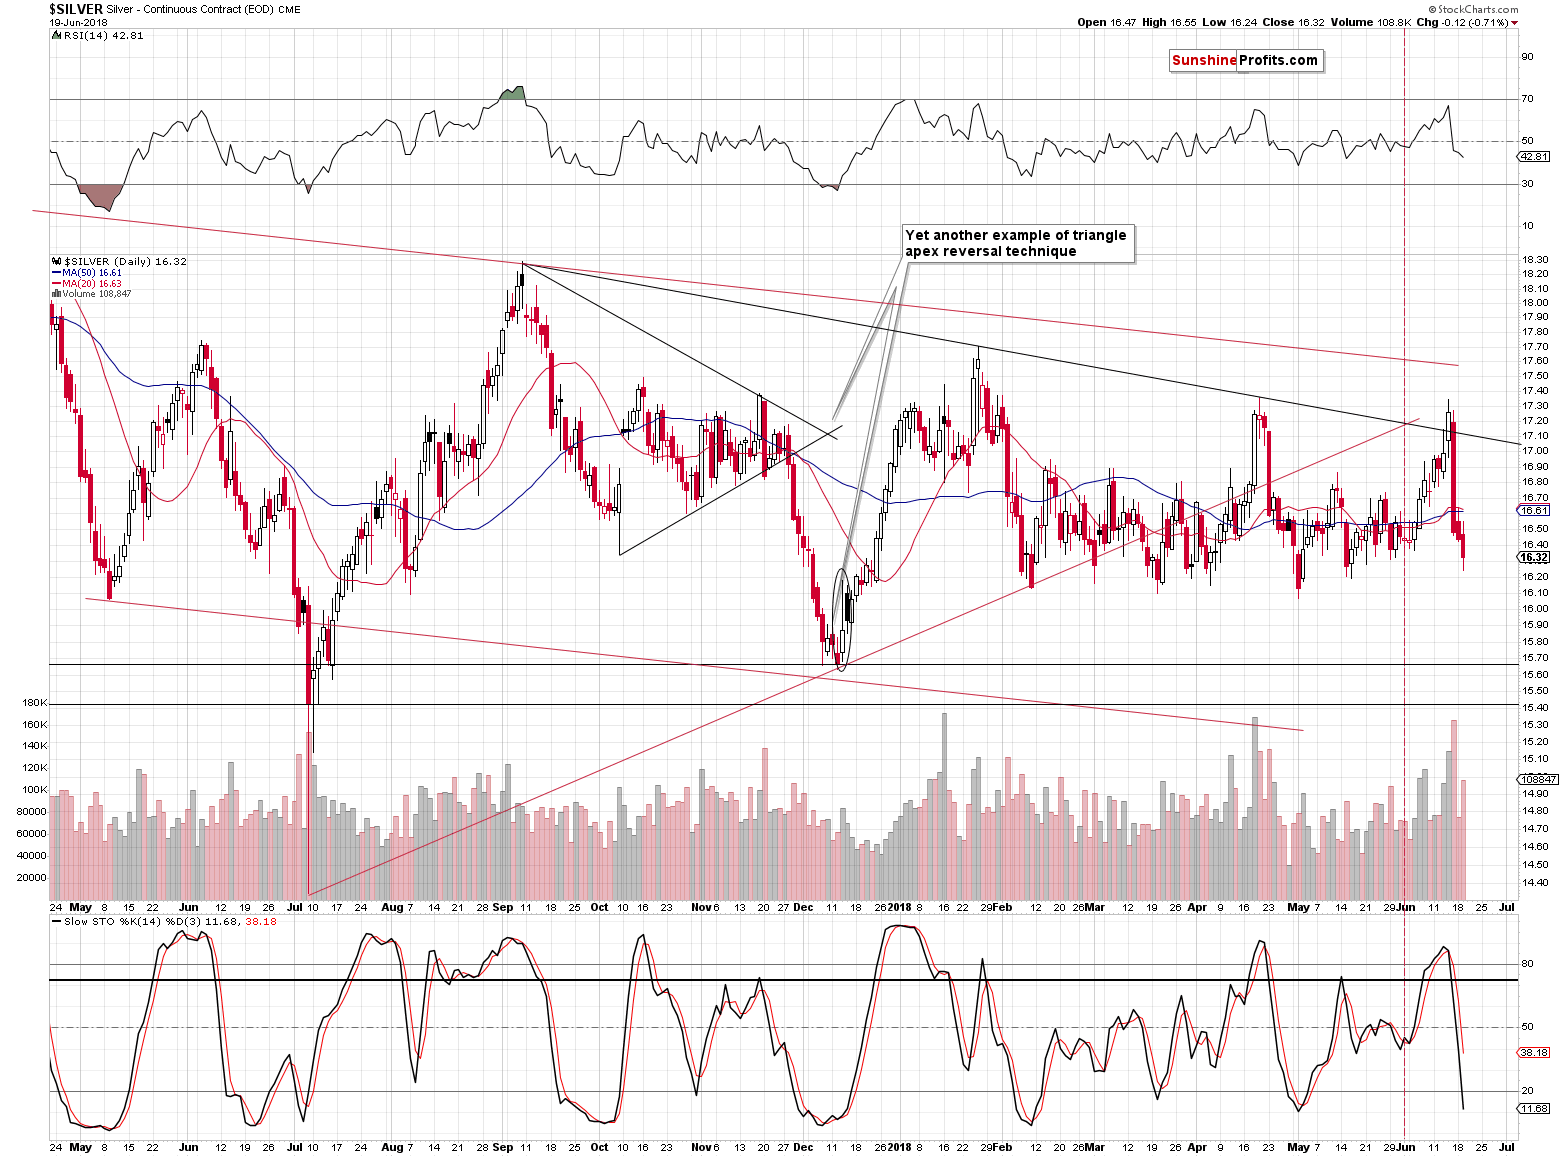
Silver moved lower on average volume, which is normal during a decline. The decline in volatility is a way of the market taking a breather, but unlike in case of gold, there was not enough strength among the silver bulls to prevent the daily decline.
Given the regularity in the recent bottoms, the silver bulls may be planning to take advantage of a move to $16.10 or so. That’s why we may see a temporary bounce from this level, but we don’t expect it to be anything major.
The above remains up-to-date, and we don’t have much to add to it today. Silver’s decline simply continues.
Gold Stocks’ Critical Confirmation
As far as the HUI Index (key proxy for gold stocks) is concerned, we wrote the following yesterday:
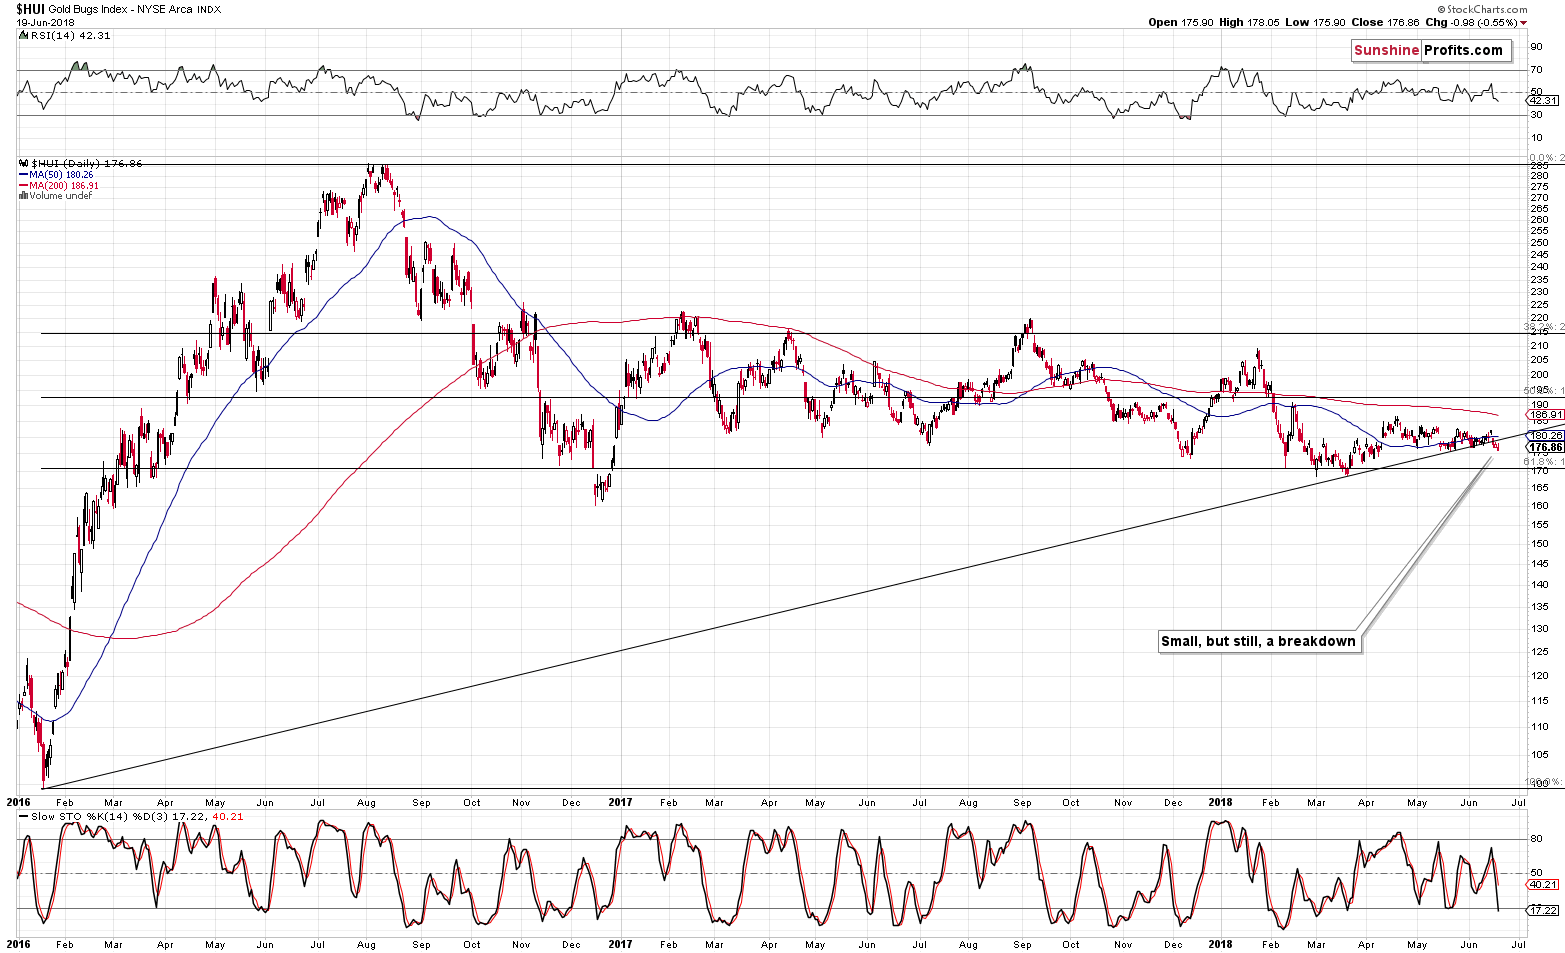
Nothing happened in case of gold stock, but this actually has some implications. Bearish implications. The reason is that this is the second daily close after a breakdown below the critical, long-term support line. It generally takes 3 consecutive market closes for a breakout or breakdown to be confirmed on the precious metals market and since we saw the second close, we are only one day away from the full confirmation. The implications of the breakdown are therefore not yet fully bearish, but definitely more bearish than they were yesterday.
Additionally, please note that there are sell signals from the Stochastic indicator on all above charts. These signals are not subtle, but clear and so are the bearish implications.
And so, it happened. We saw the third close after a breakdown and one of these sessions was also a weekly close. The long-term breakdown has just been confirmed and the implications are very bearish for the next several weeks.
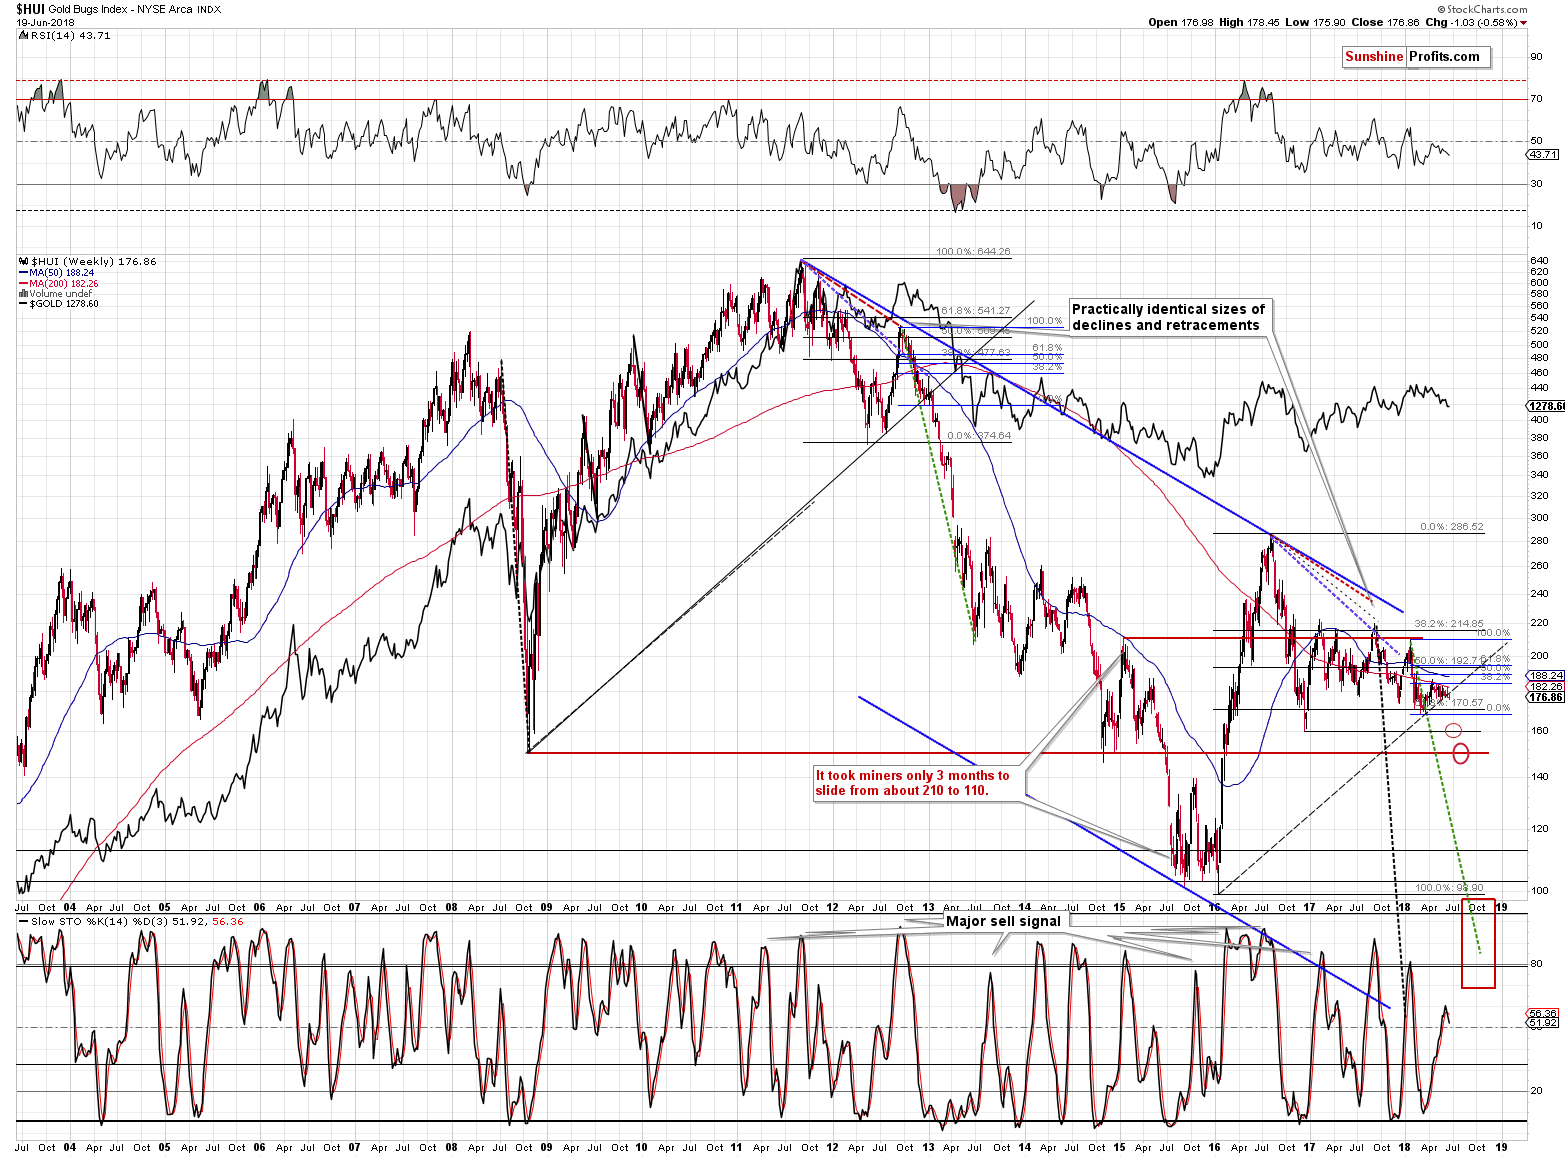
Zooming out shows how significant this support line is and thus how important the confirmed breakdown is. On June the 11th, we wrote the following on the above chart in the section entitled Gold Stocks: On the Verge:
Let’s start the discussion by looking at the rising dashed support line that’s based on the 2016 low and the 2018 low. Gold stocks are practically right at this support line and breaking it is likely to trigger a bigger move lower as that’s how important support lines work in general. The above is an important line, because it’s based on important bottoms (both are yearly lows).
But, there’s much more to this line than just the above. Namely, we saw something similar in late 2012 and early 2013. The HUI Index moved to the important rising support line that was based on major bottoms and it consolidated above it. That’s more or less what we’re seeing at this time. The key thing is what happened next in 2013 and what happened next was the biggest decline in years. The pause at the rising support line was the final stop before the biggest dive. It seems that mining stocks are in the final part of preparing to do the same.
The striking thing about the above analogy is that it’s confirmed by slope of the support line. We copied the current (dashed) support line to the 2008 bottom and if you didn’t notice it previously, it only confirms just how similar both lines are. Speaking of slopes, if you look at the purple dashed lines that start at the 2011 and 2016 tops (they are identical to emphasize the very similar shape of the post-top action), you’ll see that extending them causes them to cross the above-mentioned rising support line practically right at the moment when the decline accelerated. That’s right, it means that it should start any day now.
There are no implications for the next day or a few of them, but the consequences for the following weeks and months are extremely bearish, especially as what we described today is only an addition to multiple other bearish factors that we had described in the previous alerts.
The long-term support line is one of the factors that makes this decline similar to the 2012-2013 one and the confirmed breakdown means that the really volatile part has just begun.
Silver Stocks’ Weakness
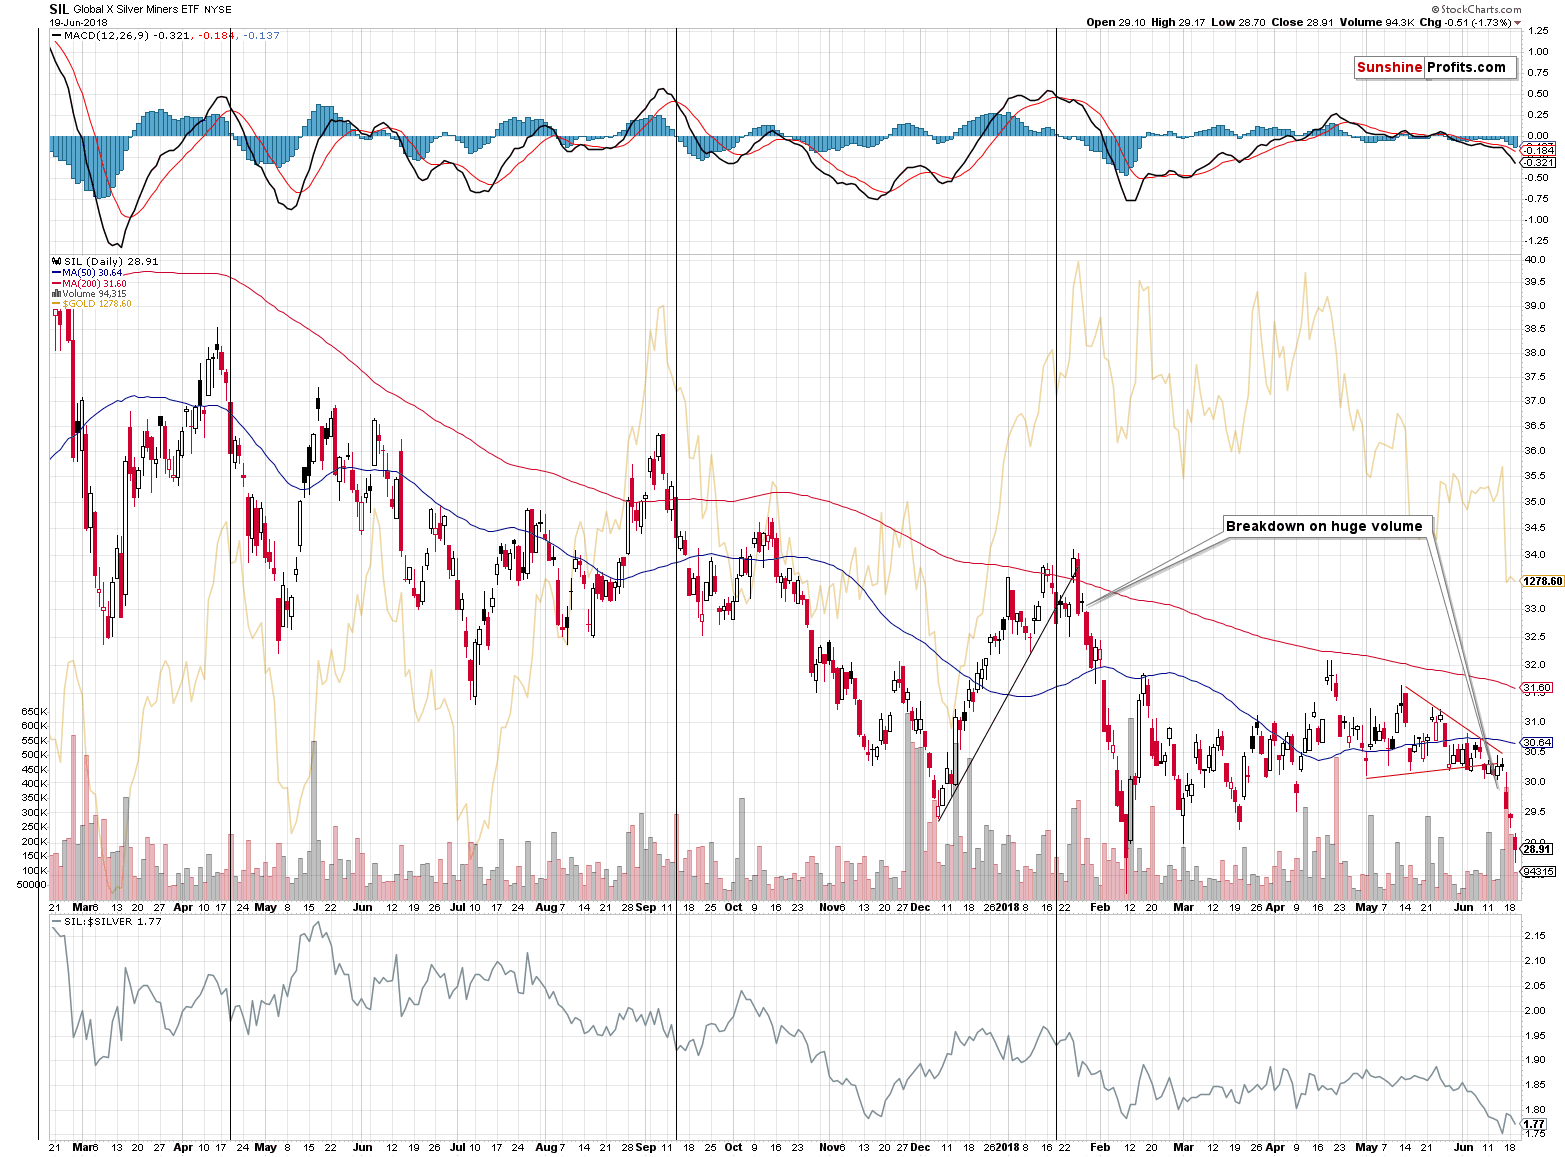
The silver miners have been underperforming in the previous days and we even made that the main topic of one of our recent alerts. The underperformance definitely continued since that time as we saw a breakdown on huge volume that was followed by a sharp slide.
Just as this underperformance had bearish implications in the past, it continues to have them today. Please note that the previous huge-volume breakdown (seen in early 2018) was followed by a $5 decline. So far, the SIL ETF declined by only $1.5 and based on the analogy to the above, it seems that it has further to fall.
Having said that, let’s take a look at the forex charts.
Forex
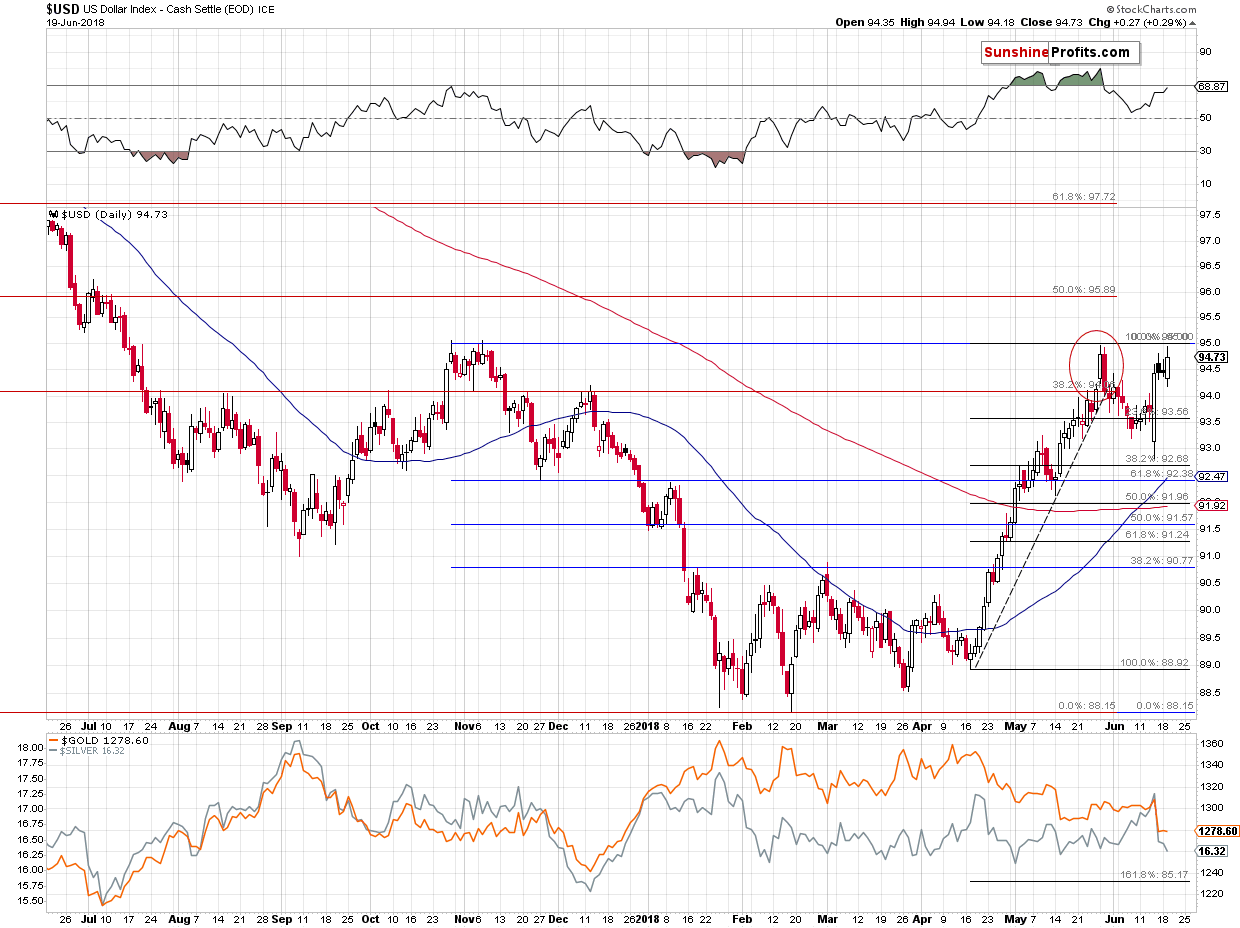
The above chart shows that the USD Index is moving higher, which is in tune with our previous expectations based on i.e. the analogy to how the USD rallied in 2014. Consequently, our previous comments on the long-term USDX chart remain up-to-date:
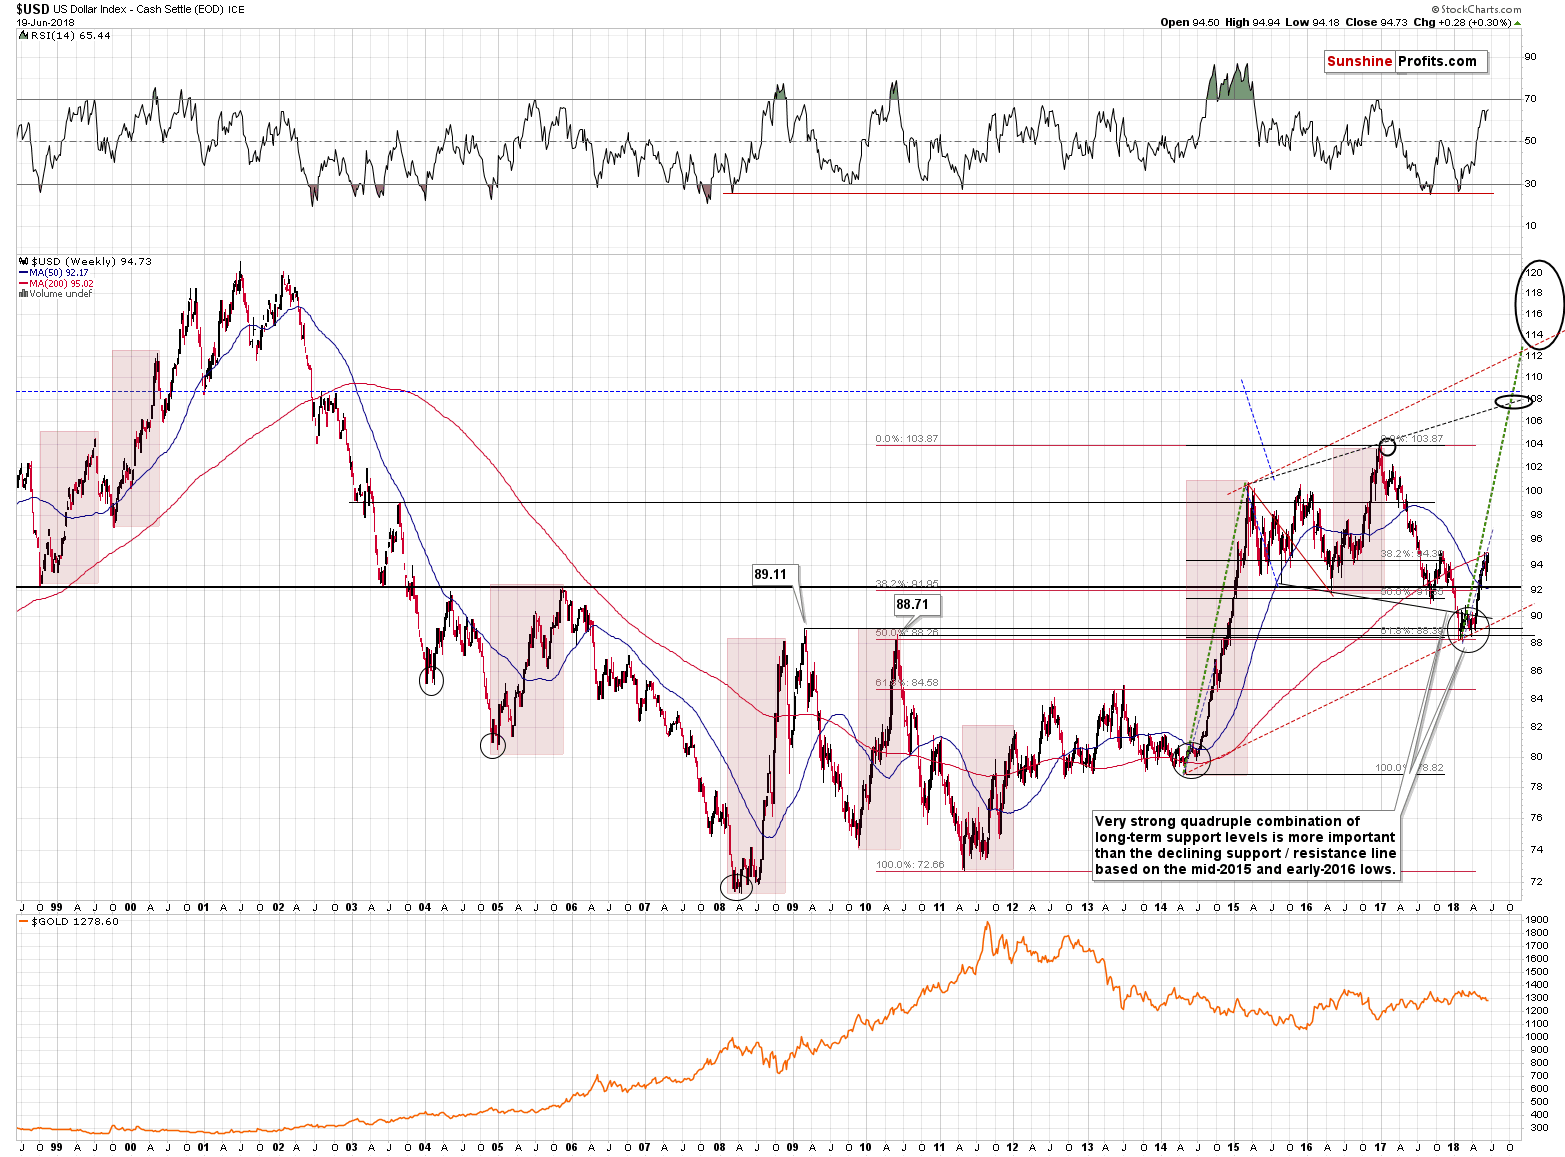
The interesting thing about the recent corrective downswing in the USD Index is that it’s visible from the long-term perspective and that at the first sight it appears similar to what we had seen in the second half of 2014. Since both: 2014-2015 and the current rally started in a similar way and then corrected likewise, the analogy between them is even stronger than it was before the correction. The implications for the following weeks and months are bullish for the US currency (and the USD/JPY pair), which makes them bearish for the precious metals market and the EUR/USD pair.
Yesterday’s move higher was mostly driven by the EUR/USD pair and the Japanese yen has actually managed to show strength relative to the US currency. The question is if this changes anything regarding our outlook for the USD/JPY pair.
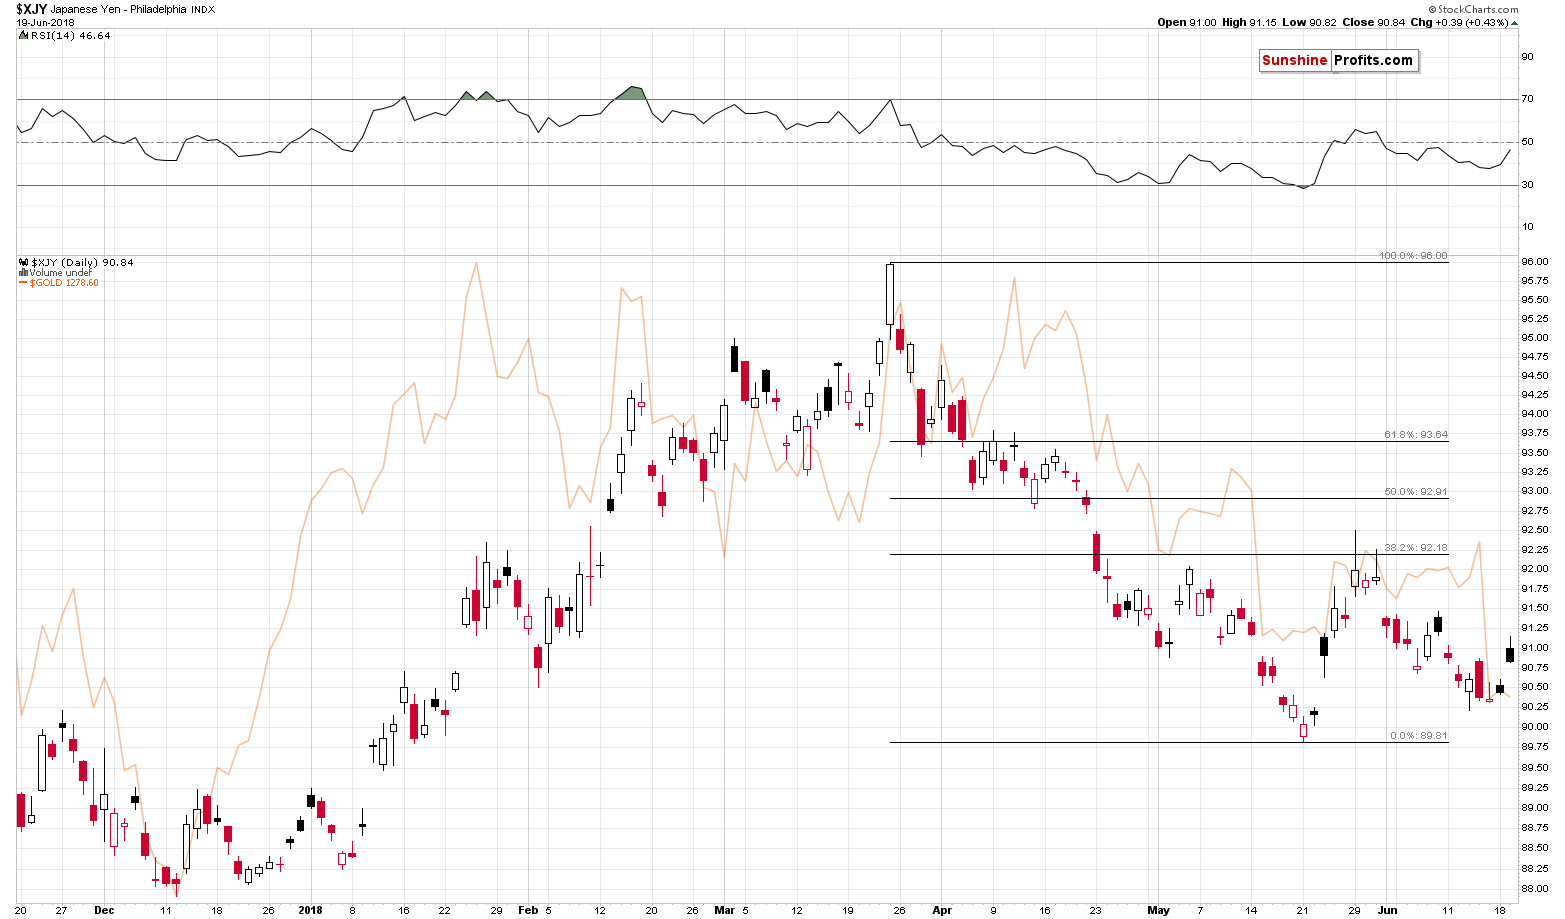
In short, it doesn’t. The black candlestick means that the currency opened the session higher but then declined on an intraday basis. We saw similar developments quite often this year and it usually meant that one should expect a decline in the following days. There were a few exceptions from this rule, but overall, the shape of yesterday’s session was followed by lower, not higher prices in the near term.
Consequently, it doesn’t seem that adjusting our short position at this time is justified.
As a reminder, we view the following positions as justified from the risk to reward point of view: short in case of the EUR/USD with the stop-loss level at 1.186 and the initial target price at 1.1203, and long in case of the USD/JPY with the stop-loss level at 107.78 and the initial target price at 113.88.
On an administrative note, this week’s alerts include more forex details than usually. For the next several days (most likely until June the 22nd), your Editor will be providing the crude oil and forex analysis and we thought that it would be a pleasant surprise to include the latter right into our Gold & Silver Trading Alerts. So, while we’re not going to include forex trading positions into the normal summary of positions for this type of alert as it might be confusing for some subscribers, we are providing additional information regarding any positions in the forex sections, just like we did today.
Summary
Summing up, the decline in the precious metals market seems to continue and both: silver stocks’ underperformance and confirmation of a major breakdown in gold stocks confirm that the big decline is just starting. There is quite likely to be a pause or a corrective upswing when gold moves close to the $1,250 level, but it doesn’t seem that it will generate anything more than just a brief correction. The analogous target prices are $16.10 for silver, and $21 for the GDX. Based on the nearby turning points, it seems that we might see some kind of reversal on Wednesday or Thursday this week and then on next Wednesday, June the 27th.
Will it be justified to exit the short positions and to perhaps open long ones in order to profit from this bounce? It’s a tough call. We’ll have to wait for what happens on Wednesday and Thursday and see what kind of confirmations we get. If miners bottom before gold and show strength on Thursday, then we might adjust the current position or even switch it.
As always, we’ll keep you – our subscribers – informed.
To summarize:
Trading capital (supplementary part of the portfolio; our opinion): Full short positions (200% of the full position) in gold, silver and mining stocks are justified from the risk/reward perspective with the following stop-loss orders and initial target price levels:
- Gold: initial target price: $1,251; stop-loss: $1,382; initial target price for the DGLD ETN: $48.88; stop-loss for the DGLD ETN $37.48
- Silver: initial target price: $15.73; stop-loss: $18.06; initial target price for the DSLV ETN: $27.58; stop-loss for the DSLV ETN $19.17
- Mining stocks (price levels for the GDX ETF): initial target price: $21.03; stop-loss: $23.54; initial target price for the DUST ETF: $28.88; stop-loss for the DUST ETF $21.16
In case one wants to bet on junior mining stocks' prices (we do not suggest doing so – we think senior mining stocks are more predictable in the case of short-term trades – but if one wants to do it anyway, we provide the details), here are the stop-loss details and initial target prices:
- GDXJ ETF: initial target price: $30.62; stop-loss: $36.14
- JDST ETF: initial target price: $59.68 stop-loss: $40.86
Long-term capital (core part of the portfolio; our opinion): No positions (in other words: cash)
Insurance capital (core part of the portfolio; our opinion): Full position
Important Details for New Subscribers
Whether you already subscribed or not, we encourage you to find out how to make the most of our alerts and read our replies to the most common alert-and-gold-trading-related-questions.
Please note that the in the trading section we describe the situation for the day that the alert is posted. In other words, it we are writing about a speculative position, it means that it is up-to-date on the day it was posted. We are also featuring the initial target prices, so that you can decide whether keeping a position on a given day is something that is in tune with your approach (some moves are too small for medium-term traders and some might appear too big for day-traders).
Plus, you might want to read why our stop-loss orders are usually relatively far from the current price.
Please note that a full position doesn’t mean using all of the capital for a given trade. You will find details on our thoughts on gold portfolio structuring in the Key Insights section on our website.
As a reminder – “initial target price” means exactly that – an “initial” one, it’s not a price level at which we suggest closing positions. If this becomes the case (like it did in the previous trade) we will refer to these levels as levels of exit orders (exactly as we’ve done previously). Stop-loss levels, however, are naturally not “initial”, but something that, in our opinion, might be entered as an order.
Since it is impossible to synchronize target prices and stop-loss levels for all the ETFs and ETNs with the main markets that we provide these levels for (gold, silver and mining stocks – the GDX ETF), the stop-loss levels and target prices for other ETNs and ETF (among other: UGLD, DGLD, USLV, DSLV, NUGT, DUST, JNUG, JDST) are provided as supplementary, and not as “final”. This means that if a stop-loss or a target level is reached for any of the “additional instruments” (DGLD for instance), but not for the “main instrument” (gold in this case), we will view positions in both gold and DGLD as still open and the stop-loss for DGLD would have to be moved lower. On the other hand, if gold moves to a stop-loss level but DGLD doesn’t, then we will view both positions (in gold and DGLD) as closed. In other words, since it’s not possible to be 100% certain that each related instrument moves to a given level when the underlying instrument does, we can’t provide levels that would be binding. The levels that we do provide are our best estimate of the levels that will correspond to the levels in the underlying assets, but it will be the underlying assets that one will need to focus on regarding the signs pointing to closing a given position or keeping it open. We might adjust the levels in the “additional instruments” without adjusting the levels in the “main instruments”, which will simply mean that we have improved our estimation of these levels, not that we changed our outlook on the markets. We are already working on a tool that would update these levels on a daily basis for the most popular ETFs, ETNs and individual mining stocks.
Our preferred ways to invest in and to trade gold along with the reasoning can be found in the how to buy gold section. Additionally, our preferred ETFs and ETNs can be found in our Gold & Silver ETF Ranking.
As a reminder, Gold & Silver Trading Alerts are posted before or on each trading day (we usually post them before the opening bell, but we don't promise doing that each day). If there's anything urgent, we will send you an additional small alert before posting the main one.
=====
Latest Free Trading Alerts:
Crude oil’s Friday’s huge daily decline was not followed by yet another daily slide, but by a profound reversal. The price has surely turned by 180 degrees, but can we say the same thing about the outlook for the following days?
Major Turnaround in Crude Oil’s Price
=====
Hand-picked precious-metals-related links:
PRECIOUS-Gold dips as dollar soars on trade woes; platinum at more than two-year low
There Is Still A Case For Gold, Just At A Lower Exposure - BlackRock
Gold Street Is Where South Africa’s Mining History Goes to Die
=====
In other news:
Dollar perched at 11-month highs as trade concerns weigh
European shares post modest rebound as trade war fears linger on
Merkel's conservatives warn euro zone budget could split EU
U.S. Growth Is ‘Close to a Peak’, But Risks Are Mounting
Chinese investment in the United States has plummeted 92% this year
Mark Cuban, Others Agree With Dimon, Buffett's Criticism Of Quarterly Guidance
U.K. Companies Face Pre-Brexit Tax Bombshell From EU
OPEC Maths Reveals Gap Between Headlines and Real Barrels
Oil up on U.S. stocks, Libya ahead of OPEC meeting
=====
Thank you.
Sincerely,
Przemyslaw Radomski, CFA
Founder, Editor-in-chief, Gold & Silver Fund Manager
Gold & Silver Trading Alerts
Forex Trading Alerts
Oil Investment Updates
Oil Trading Alerts

