

Briefly: in our opinion, full (300% of the regular position size) speculative short positions in mining stocks are justified from the risk/reward point of view at the moment of publishing this Alert.
Yesterday’s session was quite boring, as nothing really changed and no previous pattern was invalidated. However, we did see a fresh bearish confirmation.
The confirmation came from the mining stocks, which closed the session lower, despite a higher close in the case of gold and the GLD ETF. And despite a higher close in the S&P 500. Miners had every reason to rally, especially given that they are oversold in terms of the RSI indicator – and yet, they declined. That’s a clear sign that miners want to move lower from here, not higher.
My previous comments on the above and below gold and the USD Index charts remain up-to-date:
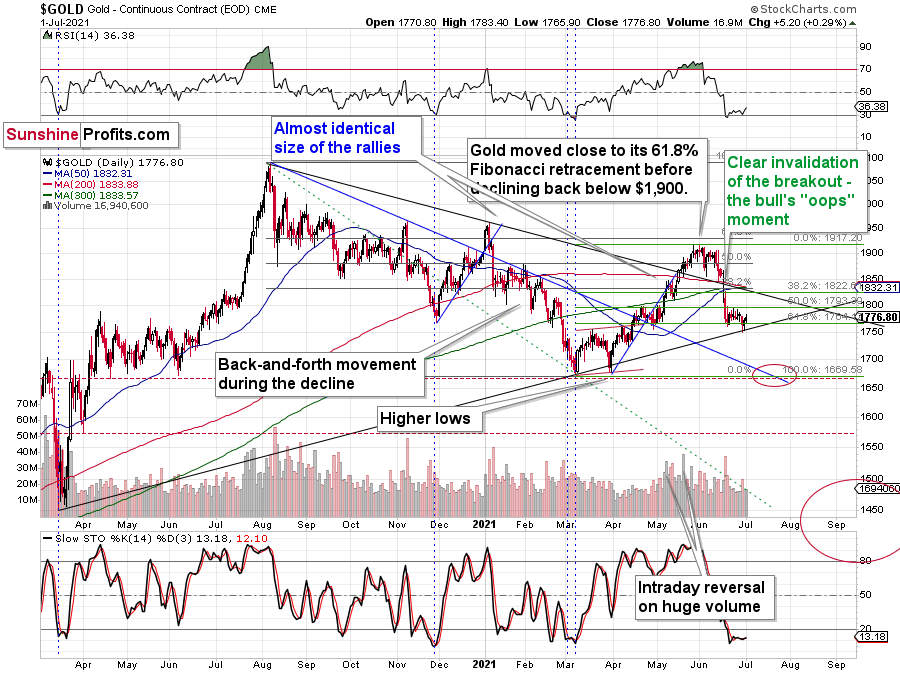
Gold moved a little higher when it reached the rising support line based on its previous important lows. The possible rebound was likely to take place based on this single development, and we’re seeing it right now. What does this change? Well, nothing. The technical bounce is a normal phenomenon and – by itself – doesn’t tell us that the decline is over.
In fact, if you look at what happened in January, you will see that the price of gold is developing in the same way now. And what happened then? Gold declined substantially. This time, it’s likely to fall even more in the following months.
Let’s keep in mind that while gold moved higher after reaching this support line, it already broke below a more important line, and it’s currently verifying this breakdown.
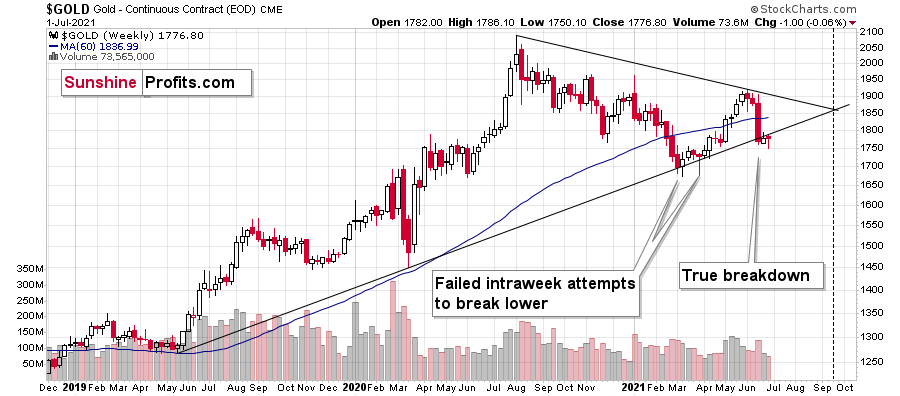
As I emphasized yesterday, this is the first time when gold managed to break below this line and not rally back up. This time is already different. And as the previously broken line now provides resistance, it seems that one shouldn’t expect gold to rally particularly high in the near term. Moving above the recent highs seems relatively unlikely.
The situation in the USD Index supports this outlook:
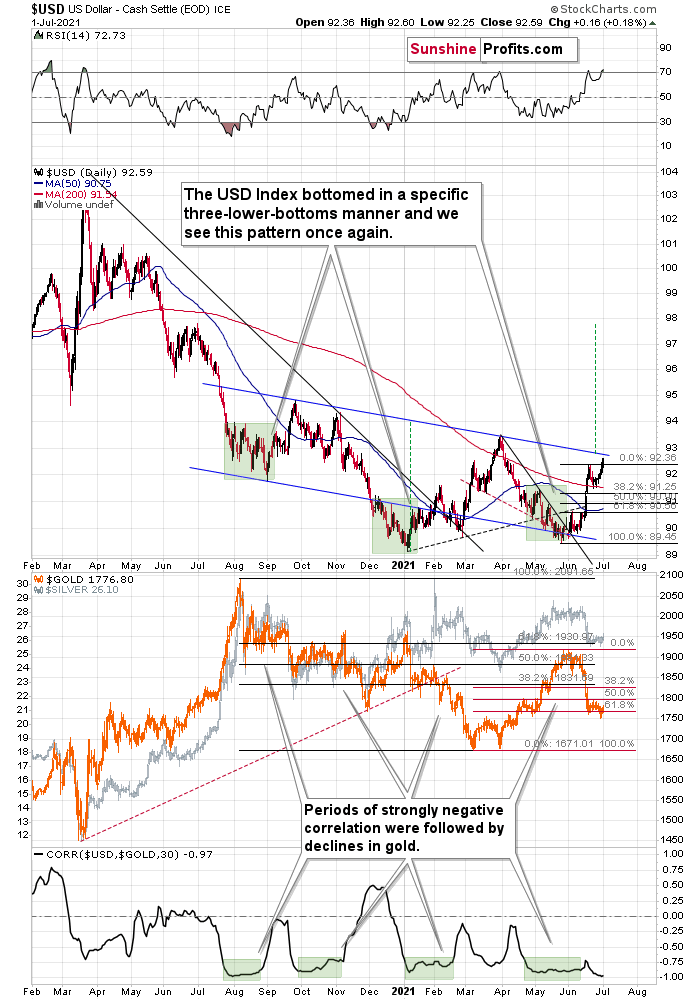
We recently saw a breather that was similar in terms of time and price to the previous patterns which happened after quick short-term rallies. And now, the USDX is moving higher once again. Yesterday, I wrote that as soon as the USD Index exceeds the previous June highs, it’s likely to rally more substantially – perhaps stopping temporarily at the late-March high or rallying even higher, to 95 or so. Well, the USDX has just broke above the June highs, but gold is not yet responding with a decline.
Still, gold’s rally here seems to be of technical and temporary nature. If it doesn’t decline soon while the USDX continues to rally, it will be suspiciously bullish, but for now, it doesn’t seem that it should raise anyone’s eyebrow.
In fact, the markets – especially gold – might simply be waiting for the upcoming (today’s) non-farm payroll statistics. People might be hesitating to take any action before seeing the employment numbers, but once they do see them, and the dust settles, the previous trends are likely to be resumed.
Sooner or later, gold is likely to get the bearish push off the cliff that will likely take it below the above-mentioned rising red line. Gold’s next support is at the previous 2021 lows – close to $1,670.
Moreover, let’s keep in mind that gold stocks’ relative performance hasn’t stopped indicating the bearish outlook recently.
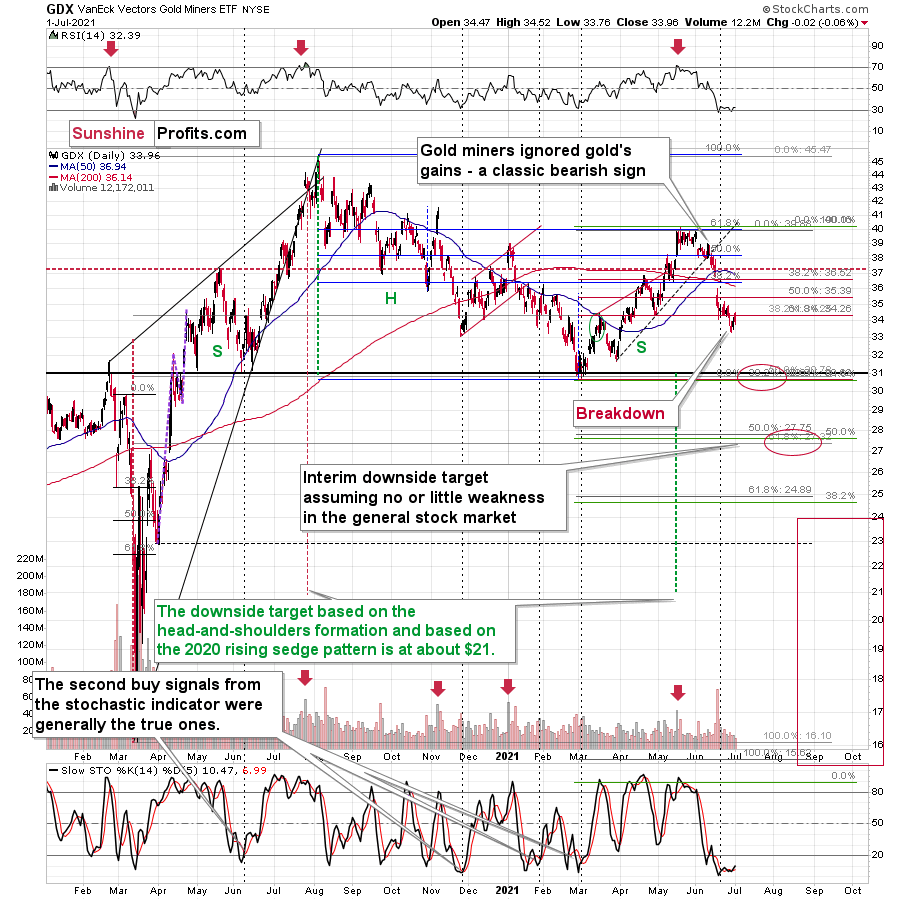
Yesterday, gold stocks underperformed gold in a clear manner by moving temporarily above the recent lows and then declining once again, closing the session a bit lower. That’s a verification of a breakdown, and it’s a bearish development. It’s also clear in the case of the GDXJ ETF.
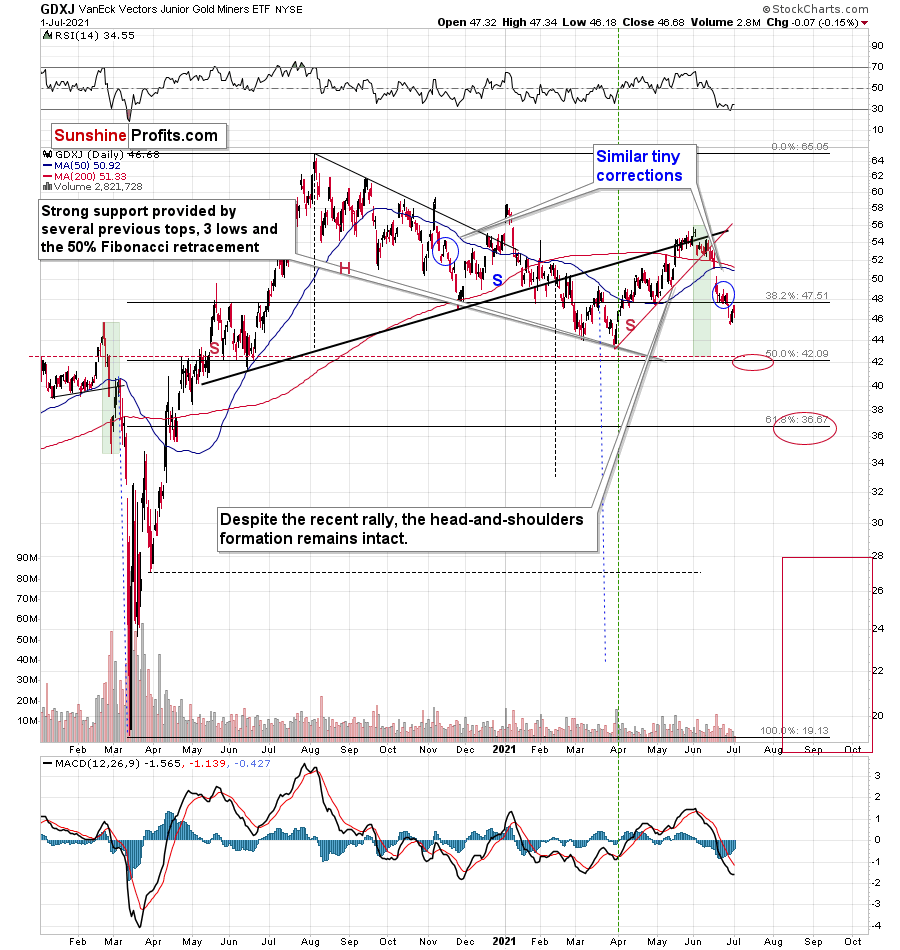
Junior gold miners moved slightly higher – almost touching their recent lows – and then they declined, verifying the breakdown.
It’s even clearer in the case of the 4-hour candlestick GDXJ ETF chart.
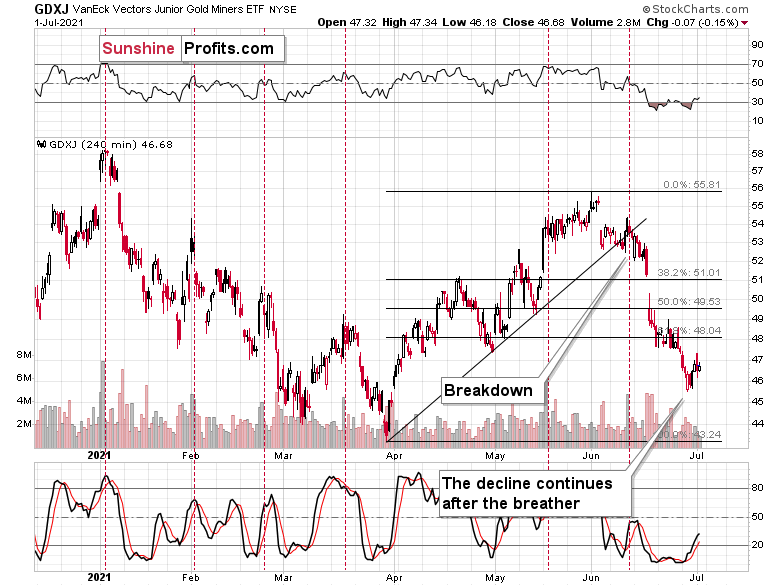
The late June – now decline is what corresponds to gold’s back-and-forth trading. Miners are already declining even though gold isn’t.
The same thing happened right after the 2012 top when gold was correcting.
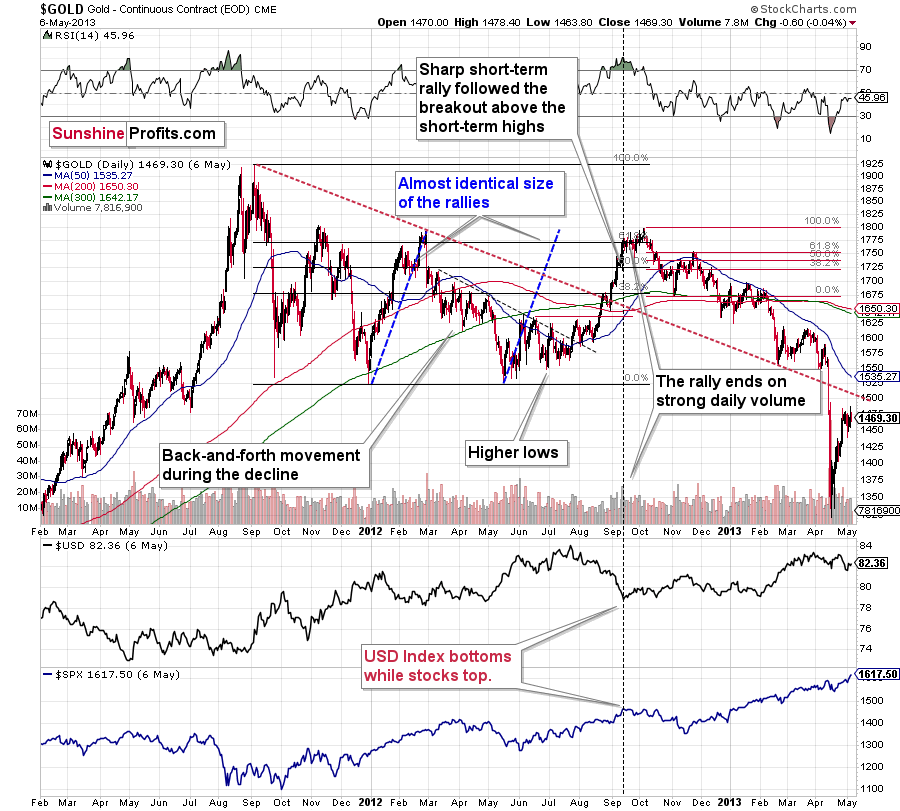
Please focus on the red Fibonacci retracement in the right part of the chart. After the first sizable move lower (Oct. – Nov. 2012), gold first corrected to its 50% Fibonacci retracement, pulled back, and then moved to the 61.8% Fibonacci retracement. During that time gold miners first corrected to almost their 38.2% Fibonacci retracement and then – after the pullback – they didn’t even manage to move to their previous highs. Also, the entire corrective upswing took a similar amount of time as the preceding decline.
While we didn’t see gold correcting 61.8% of its preceding decline, everything else is intact. For your convenience, I’m placing gold’s current chart once again below.
There was a pullback, and now gold is moving higher once again. The huge difference is that the size of the upswing was much smaller this time, as the buyers’ strength seems to be much smaller as well. The second short-term upswing was the final one in 2012, and it’s likely to be the final one also this time, especially that gold has been consolidating for more or less the same amount of time as it spent declining.
Moreover, the mining stocks are underperforming gold, so it’s (barely, but still) recognizable that what we see is a pause in a decline. Miners simply decline less profoundly during their “correction”. They are likely to slide once again soon.
All in all, it seems that the outlook for the precious metals market – especially for the junior gold miners – is very bearish for the following weeks and months, and it seems that the profits on our current short position will grow much more quite soon.
Possible non-PM Opportunity
One more thing before we move to the fundamentals. There might be a specific opportunity in bitcoin soon. While bitcoin analysis goes beyond the scope of the Gold & Silver Trading Alerts, it’s difficult not to notice a huge head and shoulders pattern in the most popular cryptocurrency.
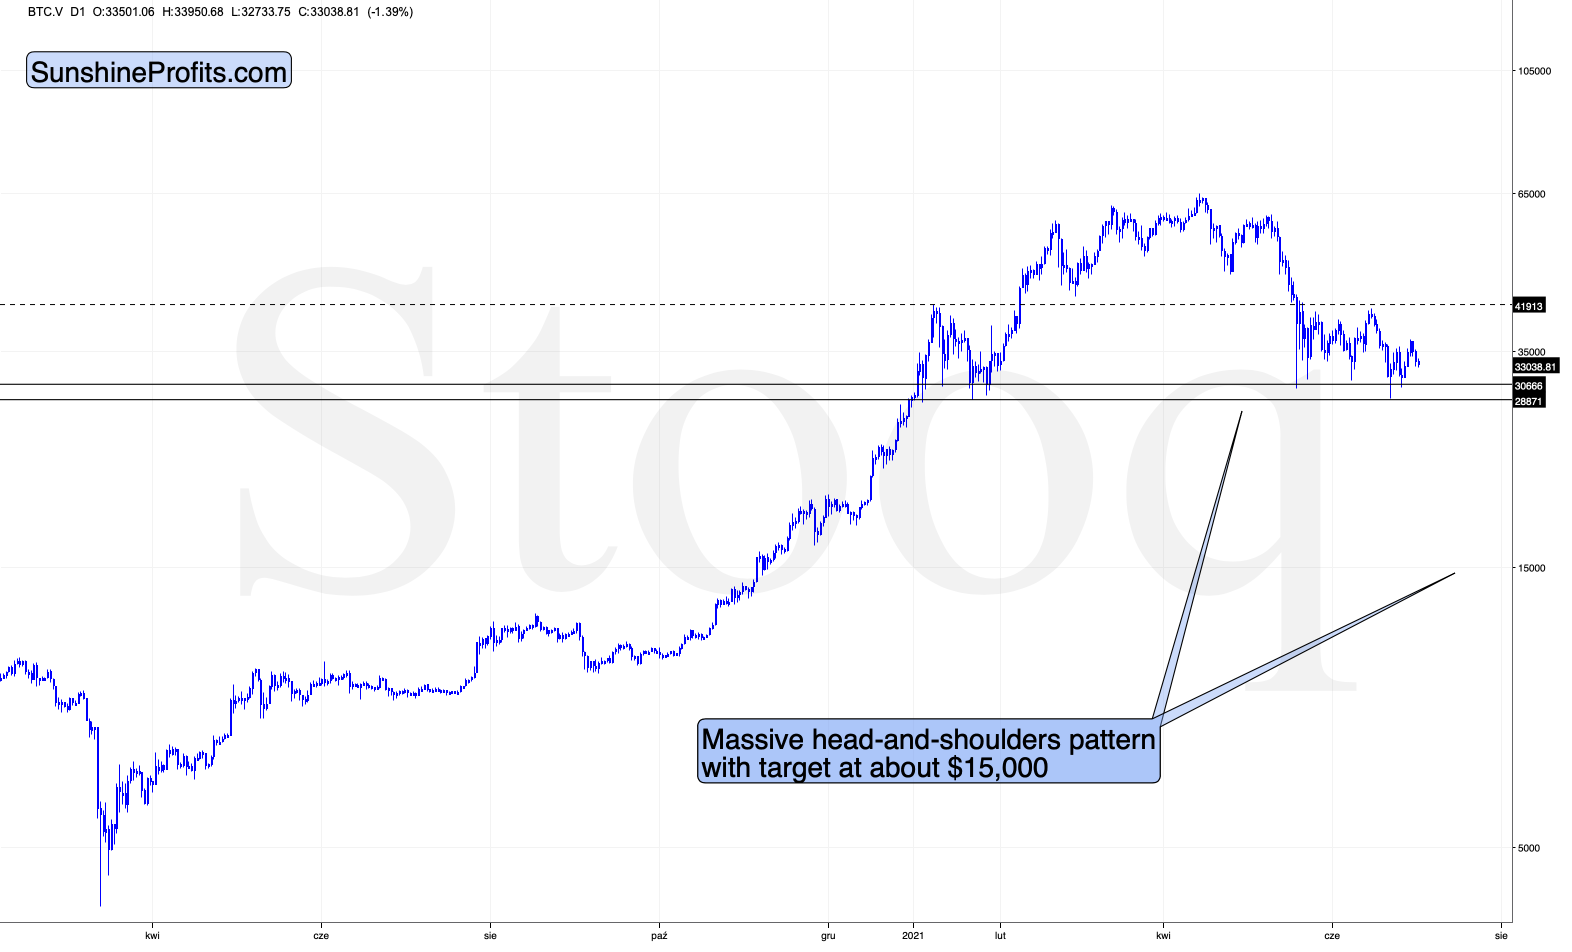
During the April decline, the bitcoin price was approximately cut in half, and we might see the same thing happen once again soon based on the above-mentioned pattern. In the current case, it would imply bitcoin at about $15,000, or perhaps lower, as there’s practically no meaningful support in that area. That’s a huge move.
If that’s something you might be interested in taking advantage of, there’s an inverse Bitcoin ETF in Canada – BITI.TO (I’m not aware of any ETF listed in the U.S. that would provide inverse exposure to the price of bitcoin). While this will not become a part of our regular “Trading” section, it might be something you’d be interested in, anyway. I’m not sure if I will decide to participate in this trade myself, but if this is the case, I’ll let you – my subscribers – know.
Having said that, let’s take a look at the markets from a more fundamental angle.
The Rising Tide of Inflation
While investors are all-in on the U.S. Federal Reserve’s (FED) “transitory” narrative, the inflationary cauldron continues to boil. Case in point: the IHS Markit released its manufacturing PMI on Jul. 1 and the report read that “June PMI data from IHS Markit signaled the joint-fastest improvement in the health of the U.S. manufacturing sector on record.”
Please see below:
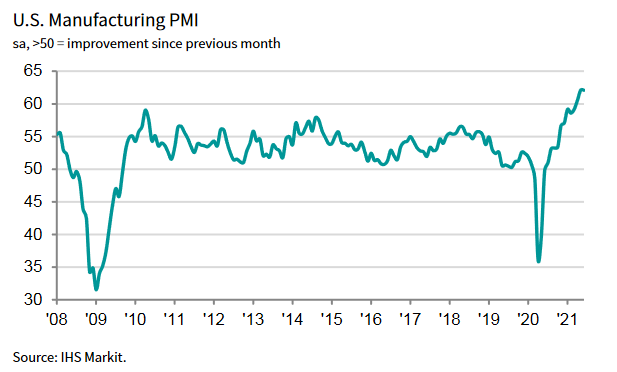
Moreover, demand remained resilient:
“New orders growth remained substantial in June, despite the rate of expansion easing from May's historic high. The pace of increase was the second-fastest on record, with firms continuing to note marked upturns in demand from both new and existing clients.”
More importantly, though:
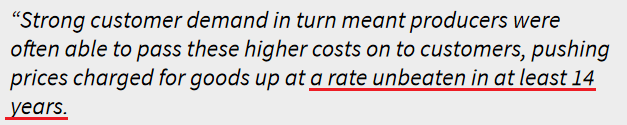
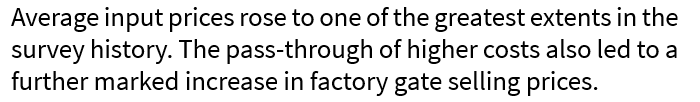
“Suppliers' delivery times lengthened to the greatest extent on record in June, as component shortages and transportation issues exacerbated supply-chain woes. Subsequently, vendors hiked their charges. Input costs rose at the fastest pace since data collection for the series began in May 2007, as greater global demand for inputs put pressure on material shortages. Manufacturers were able to partially pass on higher costs to clients, however, as the rate of charge inflation matched May's historic peak.”
Please see below:
 Source: IHS Markit
On top of that, the J.P.Morgan Global Manufacturing PMI (also released on Ju1. 1) had a similar message:
 Source: IHS Markit, J.P. Morgan
Thus, while FED Chair Jerome Powell told Congress on Jun. 22 that the U.S. economy "is still a ways off” and that "we will not raise interest rates preemptively because we fear the possible onset of inflation., we will wait for evidence of actual inflation or other imbalances:”
- The FED increased its 2021 real GDP growth forecast from 6.5% to 7.0% on Jun. 16.
- The headline Personal Consumption Expenditures (PCE) Index rose by 3.91% year-over-year (YoY) on Jun. 25 and came in ahead of the FED’s revised forecast of 3.4%.
The bottom line? Powell’s gambit is a classic case of ‘do as I say, not as I do.’
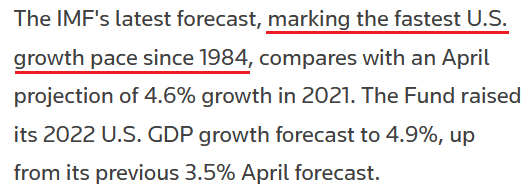
To that point, The International Monetary Fund (IMF) raised its 2021 U.S. GDP growth forecast from 4.6% to 7.0% on Jul. 1 (pending the passage of U.S. President Joe Biden’s recent infrastructure package).
Please see below:
 Source: Reuters
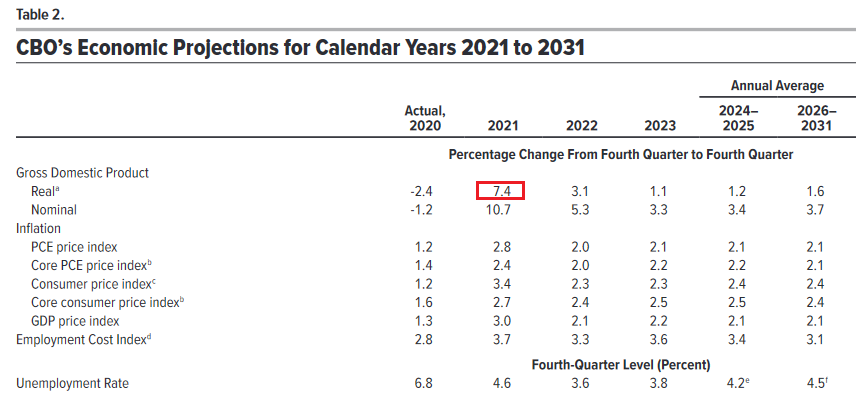
Similarly, The U.S. Congressional Budget Office (CBO) doubled its 2021 U.S. GDP growth forecast on Jul. 1. Excerpts from the report read:
“As the pandemic eases and demand for consumer services surges, real (inflation-adjusted) GDP is projected to increase by 7.4% and surpass its potential (maximum sustainable) level by the end of 2021.
In CBO’s projections, employment grows quickly in the second half of 2021—reflecting increased demand for goods and services and the waning of factors dampening the supply of labor, including health concerns and enhanced unemployment insurance benefits.”
In addition, the group’s “PCE price index” forecast of a 2.8% YoY rise is still too low, and forthcoming prints will likely surprise to the upside.
Please see below:
 Source: CBO
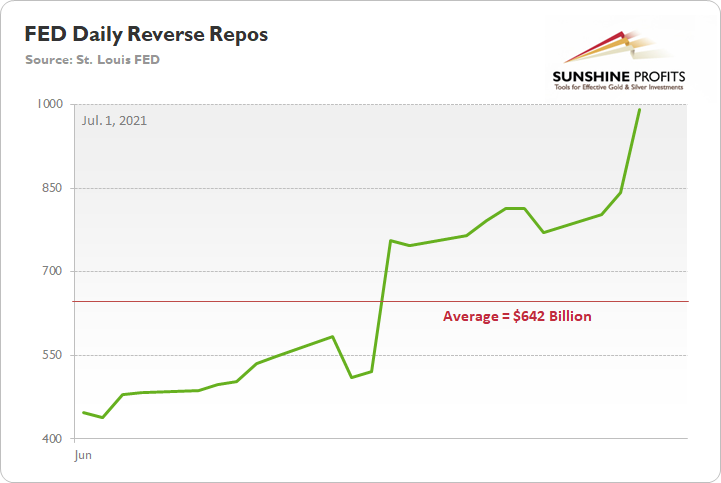
Piecing it all together: with economic growth projected to reach the levels last seen in 1984, does the FED need to purchase a combined $120 billion worth of Treasuries and mortgage-backed securities per month? As a reminder, the FED’s daily reverse repurchase agreements averaged $642 billion in June and the transactions essentially negated 5.35 months’ worth of QE in the last month alone. However, the psychological effect isn’t the same as an actual taper announcement.
Please see below:
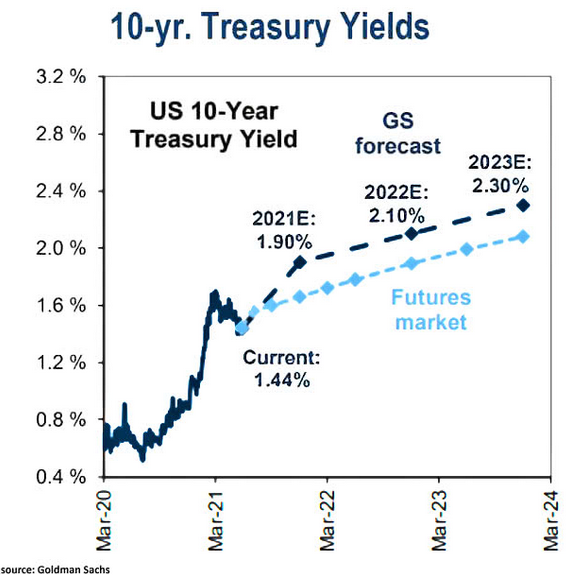
The U.S. 10-Year Treasury Yield
On top of that, the last time U.S. economic growth hit 7%, the USD Index and the U.S. 10-Year Treasury yield reached highs of 151 and 11% respectively. And while similar strength is unlikely to emerge this time around, it’s still a reminder of how low the pair’s current readings are relative to the prospective GDP growth.
To that point, while the long-end of the U.S. yield curve remains in its own little world, Goldman Sachs expects the U.S. 10-Year Treasury yield to end 2021 at 1.90% (roughly 44 basis points higher than the Jul. 1 close).
Please see below:
Likewise, Robin Brooks, chief economist at the Institute of International Finance (IIF), predicts that the U.S. cocktail of growth and inflation should result in higher long-term interest rates in the coming months.
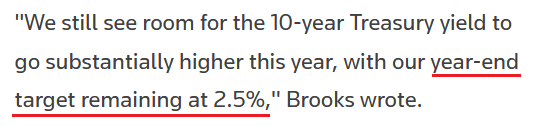 Source: Reuters
As further evidence, following the spike in the headline PCE Index on Jun. 25, the U.S. 10-Year Treasury yield is now trading at its lowest level relative to realized inflation since the mid-1970s.
Please see below:
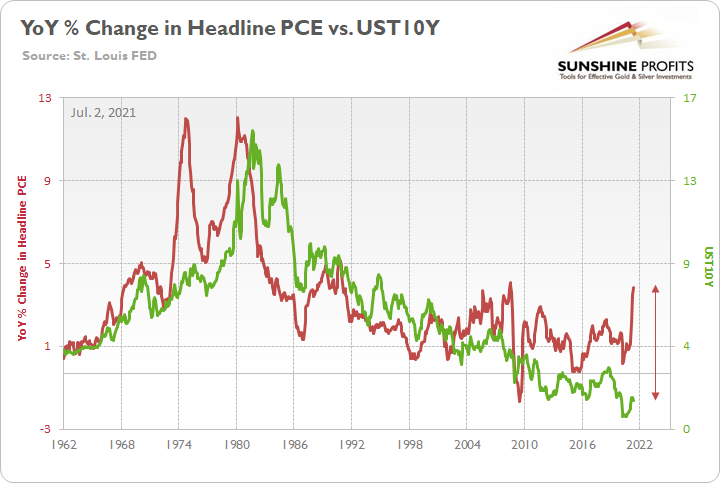
To explain, the green line above tracks the U.S. 10-Year Treasury yield, while the red line above tracks the YoY percentage change in the headline PCE Index. If you analyze the relationship, it’s been nearly 50 years since the U.S. 10-Year Treasury yield has underperformed to this degree. As a result, while the front-end of the U.S. yield curve (2s, 3s, 5s) is destined to move higher as the taper talk heats up, participation from the long-end (10s, 20s, 30s) will only add to the PMs’ ills.
The USD Up, the EUR Down
Furthermore, with the FED’s hawkish shift lighting a fire under the greenback, U.S.-Eurozone growth differentials should also propel the USD Index higher over the medium term. For context, the EUR/USD accounts for nearly 58% of the movement of the USD Index.
To that point, I warned on Apr. 8 that a shift in the central bank sentiment would uplift the U.S. dollar over the medium term.
I wrote:
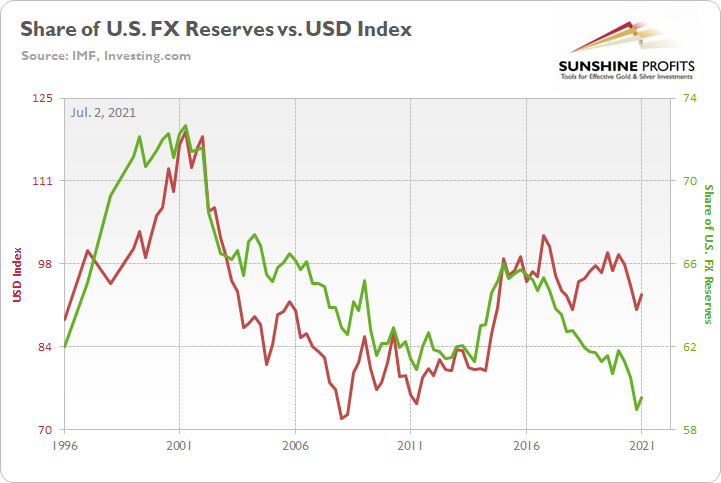
On Mar. 31, the International Monetary Fund (IMF) released its fourth quarter Currency Composition of Official Foreign Exchange Reserves (COFER). The U.S. dollar’s fourth-quarter share of allocated FX reserves fell to its lowest level since 1995, and coincidentally, the USD Index often tracks global central banks’ net-purchases of U.S. dollars (25-year correlation of 0.70).
And with a current reading of 59%, you may be thinking: the ‘death of the dollar’ is unfolding before our eyes. Keep in mind though: global central banks often behave like average investors. Meaning? They buy after an uptrend is already in place. Case in point: since 1995, 83% of major USD Index bottoms were followed by an increase in allocated FX reserves. For context, the largest increase occurred from 2014 to 2015 (2.67%), while the lone decrease occurred from 2018 to 2019 (– 1.21%).
Please see below:
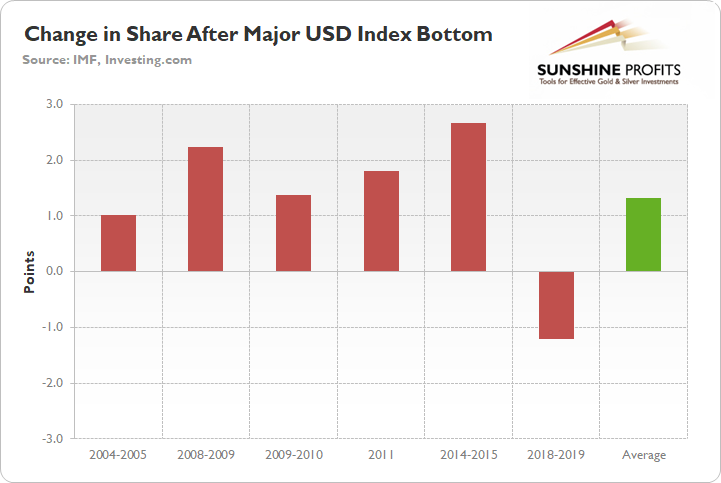
In addition, because the current reading of 59% is 1.70 standard deviations (SD) below the 25-year average, there is a ~4.5% chance that dollar-share declines in the coming months and a ~95.5% chance that dollar-share increases (applying standard normal probabilities).
Fast forward to the present, and the IMF announced on Jun. 30 that the U.S. dollar’s share of allocated FX reserves increased from 58.94% to 59.54%.
Please see below:
In addition, I warned that the euro would likely head in the opposite direction:
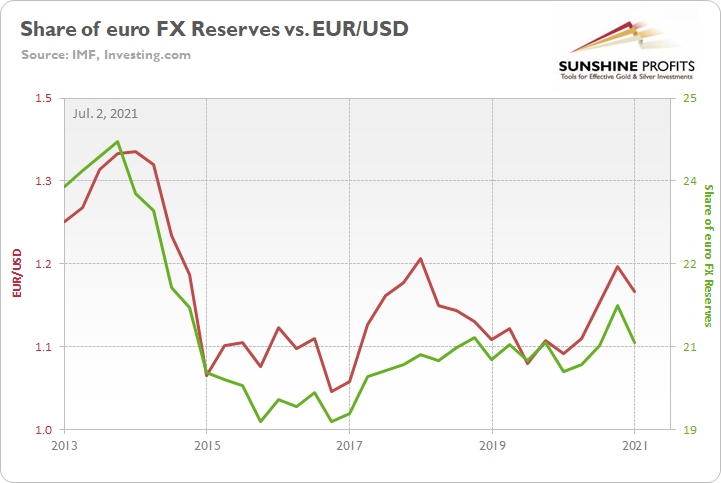
The euro is another critical component. Following the same script, global central banks often buy the euro after it rises and sell the euro after it falls. More importantly though, euro-share has a seven-year correlation of 0.92 with the EUR/USD. For context, euro-share is currently 0.30 SD above its seven-year average, which implies a ~62% chance of moving lower in the coming months.
And surprise, surprise, the euro’s share of allocated FX reserves decreased from 21.29% to 20.57%.
Please see below:
The bottom line?
While central banks have warmed up to the U.S. dollar once again, its current share of allocated FX reserves is still 1.53 SD below its 25-year average (which implies a ~93.7% chance of moving higher). Thus, if the momentum continues, it could add to the PMs selling pressure in the coming months.
Nonfarm Payrolls Incoming!
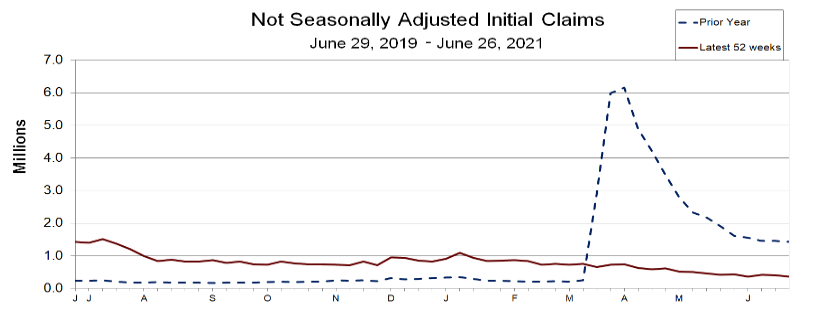
Finally, with U.S. nonfarm payrolls scheduled for release today, I noted that outperformance likely won’t materialize until August or September. However, with initial jobless claims (released on Jul. 1) coming in better than expected – at 364,000 vs. 390,000 expected – the U.S. Department of Labor (DOL) revealed that “this is the lowest level for initial claims since March 14, 2020, when it was 256,000.”
Please see below:
 Source: DOL
And while it’s more of a wild card at this point, U.S. nonfarm payrolls have been lagging behind the recent decline in initial claims.
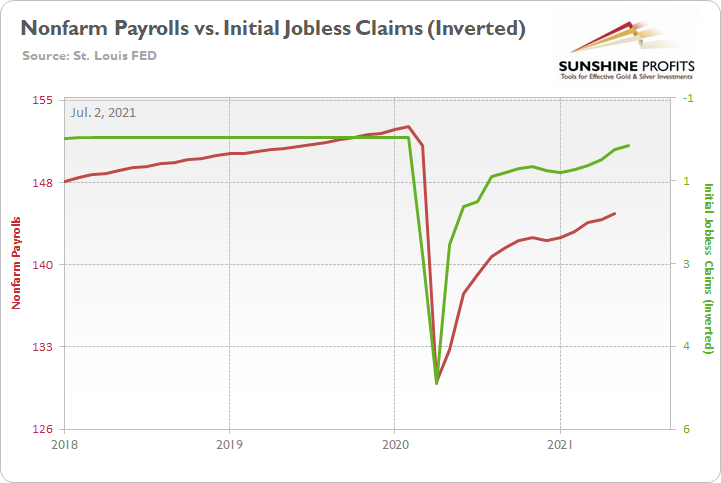
To explain, the red line above tracks U.S. nonfarm payrolls, while the green line above tracks inverted initial jobless claims. For context, inverted means that the latter’s scale is flipped upside down and that a rising green line represents falling initial jobless claims, while a falling green line represents rising initial jobless claims. If you analyze the relationship, you can see that U.S. nonfarm payrolls have some catching up to do. Thus, while we don’t expect any substantial progress until August or September, a strong print for June would serve as a pleasant surprise.
In conclusion, the PMs remain range-bound, as they debate whether the next catalyst will be bullish or bearish. However, with U.S. economic growth poised to outperform in the coming months, not only are the USD Index and Treasury yields (both long and short) undervalued relative to U.S. GDP growth prospects, but inflation is surging, and a forthcoming taper should only add to their upward momentum. As a result, the medium-term outlook remains bearish for the precious metals market, even though the long-term outlook is bullish.
Overview of the Upcoming Part of the Decline
- The barely visible corrective upswing in gold might already be over, and another huge decline is likely just around the corner.
- After miners slide in a meaningful and volatile way, but silver doesn’t (and it just declines moderately), I plan to switch from short positions in miners to short positions in silver. At this time, it’s too early to say at what price levels this would take place – perhaps with gold close to $1,600. I plan to exit those short positions when gold shows substantial strength relative to the USD Index, while the latter is still rallying. This might take place with gold close to $1,350 - $1,500 and the entire decline (from above $1,900 to about $1,475) would be likely to take place within 6-20 weeks, and I would expect silver to fall the hardest in the final part of the move. This moment (when gold performs very strongly against the rallying USD and miners are strong relative to gold – after gold has already declined substantially) is likely to be the best entry point for long-term investments, in my view. This might also happen with gold close to $1,475, but it’s too early to say with certainty at this time.
- As a confirmation for the above, I will use the (upcoming or perhaps we have already seen it?) top in the general stock market as the starting point for the three-month countdown. The reason is that after the 1929 top, gold miners declined for about three months after the general stock market started to slide. We also saw some confirmations of this theory based on the analogy to 2008. All in all, the precious metals sector would be likely to bottom about three months after the general stock market tops.
- The above is based on the information available today, and it might change in the following days/weeks.
Please note that the above timing details are relatively broad and “for general overview only” – so that you know more or less what I think and how volatile I think the moves are likely to be – on an approximate basis. These time targets are not binding or clear enough for me to think that they should be used for purchasing options, warrants or similar instruments.
Letters to the Editor
Q: I think I have the stats right. Gold fell about 10% in June and the dollar went up 2.5%. If these two asset classes are so closely correlated, how do you process the stats together? How much of gold’s drop was because of the dollar?
A: I’m attaching the current version of our Correlation Matrix for context – in the 30-day column, the correlation is at -0.98, which is a strongly negative reading. It’s based on 30 trading days, so a bit more than a month, but overall, the link remains intact.
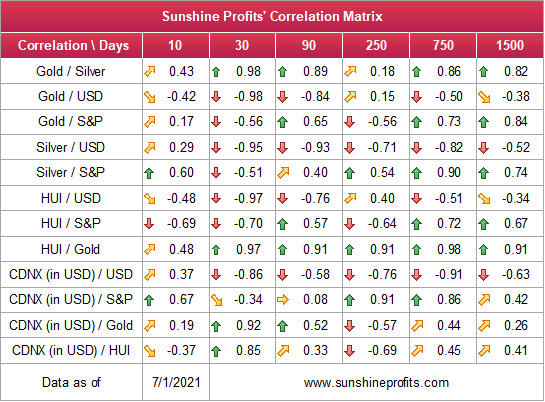
In short, what you described shows no anomaly. The “correlation” (precisely: linear correlation coefficient) tells you how much in the same direction two variables moved, and it doesn’t tell you anything about the size of the moves. What would tell something about that is leverage, not correlation. These two might be interlaced in some cases, but they are not the same thing.
For example, if you turn your steering wheel by just an inch and you’re driving at significant speed, the car will move to the right by a lot. And if you turn it to the left by just an inch, it will move to the left by a lot. These two actions would be perfectly correlated, regardless of the huge difference in distances that the car made and how little you had to move the steering wheel. You can read more about the specifics of the correlation coefficient and its limitations in this article.
How much of gold’s drop was because of the dollar? Actually, to reply to that we would need to use build a detailed statistic model using the VAR methodology, but we’d have to assume what “could” influence the price of gold and after putting all those factors (currency exchange rates, interest rates, other markets, indices, inflation, GDP etc.), we could then see what recently (out of them all) made the biggest impact on the price of gold.
Actually, we did the above several years ago. The result was that the top factor influencing the price of gold (it was about 60%) is… the price of gold. In other words, previous behavior and patterns that the gold price made determined what it would do next. If there was ever perfect scientific reasoning for applying technical analysis to the markets, it’s that. The USD Index was next with about 15% - 20% weight (which varied from time to time). I don’t have the up-to-date calculations right now, but I’d say that the above hasn’t likely changed much. The key reason why gold has declined recently was because of what happened in it previously and how history rhymes. The USD Index is quite important as well, but not as much as the former.
Q: I enjoy your service very much, and I am looking forward to every daily update with great expectations.
"The binding profit-take level for the JDST: $39.87"
I'm puzzled on a daily basis by the question of how you arrive at such a target. Please, can you help me out with an explanation? To what level does Gold/GDX OR GDXJ need to go in order to get there?
A: Thanks, I’m very happy to read that! I’m making assumptions as to how long the price move can take place, I check the average daily decline it takes to get there, I multiply it by the ETFs leverage and then apply that daily (leveraged) price move to the same length (in terms of days) that I had assumed in step 1. I then round it down and put it slightly below the nearby resistance level – if there is none, then below the nearest round number. The last part is to maximize the odds of exiting the position.
The key point is that I’ll be updating those targets once we move closer to them as that’s when it will be clearer how much longer a given move is likely to take.
Q: Thank you for the latest update. With reference to the timing of the pm sector bottom about three months after the general stock market tops (notwithstanding it's a broad comment), could you please narrow down the meaning of the general stock market? The Dow Jones made a high in May, whereas the S&P500 is still making new highs. Many thanks.
A: I think the key duo to watch is the S&P 500 and the Nasdaq is. First, because it’s the “broad market” – it shows what stocks are doing in general. Second, because the tech stocks were the leader of the recent rally. It seems to me that when we see sizable declines, it will be clear this is “it” and the 3-4-months timer has started. Let’s keep in mind that it’s one of the supplementary methods, not the sole one. Seeing strength in gold while the USD Index continues to soar will be the key indication that the bottom is in, especially if we see it close to the price target areas that I’ve been featuring.
Summary
To summarize, even though gold could still move somewhat higher in the near term, it seems that having a short position in the junior mining stocks is much more justified from the risk-to-reward point of view than having a long one in any part of the precious metals market. Gold miners’ underperformance along with a self-similar pattern in the USD Index (pointing to the breather being over) and the length of the “bottoming” process in gold that no longer resembles a bottom (but rather a pause within a slide) all make the bearish outlook justified from the risk-to-reward point of view.
After the sell-off (that takes gold to about $1,350 - $1,500), I expect the precious metals to rally significantly. The final part of the decline might take as little as 1-5 weeks, so it's important to stay alert to any changes.
Most importantly, please stay healthy and safe. We made a lot of money last March and this March, and it seems that we’re about to make much more on the upcoming decline, but you have to be healthy to enjoy the results.
As always, we'll keep you - our subscribers - informed.
By the way, we’re currently providing you with a possibility to extend your subscription by a year, two years or even three years with a special 20% discount. This discount can be applied right away, without the need to wait for your next renewal – if you choose to secure your premium access and complete the payment upfront. The boring time in the PMs is definitely over and the time to pay close attention to the market is here. Naturally, it’s your capital, and the choice is up to you, but it seems that it might be a good idea to secure more premium access now, while saving 20% at the same time. Our support team will be happy to assist you in the above-described upgrade at preferential terms – if you’d like to proceed, please contact us.
To summarize:
Trading capital (supplementary part of the portfolio; our opinion): Full speculative short positions (300% of the full position) in mining stocks are justified from the risk to reward point of view with the following binding exit profit-take price levels:
Mining stocks (price levels for the GDXJ ETF): binding profit-take exit price: $24.12; stop-loss: none (the volatility is too big to justify a stop-loss order in case of this particular trade)
Alternatively, if one seeks leverage, we’re providing the binding profit-take levels for the JDST (2x leveraged) and GDXD (3x leveraged – which is not suggested for most traders/investors due to the significant leverage). The binding profit-take level for the JDST: $39.87; stop-loss for the JDST: none (the volatility is too big to justify a SL order in case of this particular trade); binding profit-take level for the GDXD: $94.87; stop-loss for the GDXD: none (the volatility is too big to justify a SL order in case of this particular trade).
For-your-information targets (our opinion; we continue to think that mining stocks are the preferred way of taking advantage of the upcoming price move, but if for whatever reason one wants / has to use silver or gold for this trade, we are providing the details anyway.):
Silver futures upside profit-take exit price: unclear at this time - initially, it might be a good idea to exit, when gold moves to $1,512.
Gold futures upside profit-take exit price: $1,512.
Long-term capital (core part of the portfolio; our opinion): No positions (in other words: cash
Insurance capital (core part of the portfolio; our opinion): Full position
Whether you already subscribed or not, we encourage you to find out how to make the most of our alerts and read our replies to the most common alert-and-gold-trading-related-questions.
Please note that we describe the situation for the day that the alert is posted in the trading section. In other words, if we are writing about a speculative position, it means that it is up-to-date on the day it was posted. We are also featuring the initial target prices to decide whether keeping a position on a given day is in tune with your approach (some moves are too small for medium-term traders, and some might appear too big for day-traders).
Additionally, you might want to read why our stop-loss orders are usually relatively far from the current price.
Please note that a full position doesn't mean using all of the capital for a given trade. You will find details on our thoughts on gold portfolio structuring in the Key Insights section on our website.
As a reminder - "initial target price" means exactly that - an "initial" one. It's not a price level at which we suggest closing positions. If this becomes the case (like it did in the previous trade), we will refer to these levels as levels of exit orders (exactly as we've done previously). Stop-loss levels, however, are naturally not "initial", but something that, in our opinion, might be entered as an order.
Since it is impossible to synchronize target prices and stop-loss levels for all the ETFs and ETNs with the main markets that we provide these levels for (gold, silver and mining stocks - the GDX ETF), the stop-loss levels and target prices for other ETNs and ETF (among other: UGL, GLL, AGQ, ZSL, NUGT, DUST, JNUG, JDST) are provided as supplementary, and not as "final". This means that if a stop-loss or a target level is reached for any of the "additional instruments" (GLL for instance), but not for the "main instrument" (gold in this case), we will view positions in both gold and GLL as still open and the stop-loss for GLL would have to be moved lower. On the other hand, if gold moves to a stop-loss level but GLL doesn't, then we will view both positions (in gold and GLL) as closed. In other words, since it's not possible to be 100% certain that each related instrument moves to a given level when the underlying instrument does, we can't provide levels that would be binding. The levels that we do provide are our best estimate of the levels that will correspond to the levels in the underlying assets, but it will be the underlying assets that one will need to focus on regarding the signs pointing to closing a given position or keeping it open. We might adjust the levels in the "additional instruments" without adjusting the levels in the "main instruments", which will simply mean that we have improved our estimation of these levels, not that we changed our outlook on the markets. We are already working on a tool that would update these levels daily for the most popular ETFs, ETNs and individual mining stocks.
Our preferred ways to invest in and to trade gold along with the reasoning can be found in the how to buy gold section. Furthermore, our preferred ETFs and ETNs can be found in our Gold & Silver ETF Ranking.
As a reminder, Gold & Silver Trading Alerts are posted before or on each trading day (we usually post them before the opening bell, but we don't promise doing that each day). If there's anything urgent, we will send you an additional small alert before posting the main one.
Thank you.
Przemyslaw Radomski, CFA
Founder, Editor-in-chief

