

Briefly: in our opinion, full (300% of the regular position size) speculative short positions in junior mining stocks are justified from the risk/reward point of view at the moment of publishing this Alert.
So, Russia withdrew some of its troops, but in reality it might have not done so. One source says one thing, the other says something different. It doesn’t matter that much, because regardless of whether the troops have moved away from the border with Ukraine or not, it’s likely to happen anyway. Whatever we are seeing and reading now is probably smoke and mirrors. It’s unclear to me what the purpose is, as there are quite a few candidates.
Perhaps Biden is seeing his support wane and wants to be “the successful man of action, defender of Ukraine” – knowing that there was no real threat (come on, the reports that he gets from the U.S. intelligence might be something completely different than what is presented to the public), it’s very easy to claim “success”. Almost as easy as if someone introduced vaccines to an illness when the population was generally achieving group immunity, even though it was not apparent based on official statistics (I’m not referring to any specific illness or vaccines here; perhaps something like that happened recently, perhaps it didn’t; we won’t get official documentation for decades, probably…). This seems the most likely reason, in my view, but there could be others, connected with market manipulation.
It’s rather obvious that with the Ukraine-Russia war looming and WW3-possibility anxiety, gold and oil would soar. Those who knew in advance that the tensions would get so much attention could have easily positioned themselves in those markets. Knowing when the tensions subside (aren’t all the reports that get the spotlight coming from the U.S.? Or almost all of them?) presents another opportunity. If you had huge long positions in both of the above (and nice profits, in particular in the case of crude oil), and wanted to exit them without triggering a sharp slide, you could easily do so provided there was strong, “reasonable” buying power, ideally in the investment public, so spread across multiple buyers. All that’s needed for this to work is a good reason for an investment the public would like to buy. That’s where the supposed invasion scenario fits in.
What about today’s rally in gold, along with the extra narrative about Putin not retreating his forces?
It’s quite a nice (by that I mean “effective”) way for U.S. intelligence to save face after a failed prediction of an invasion that just didn’t happen yesterday. Providing a deadline works if one wants to create a sense of urgency and trigger action – and it worked. We’re probably seeing the “milking the very last of this opportunity” now. There’s a limited number of things (that would work) that can now be done in order to keep people scared of the conflict if it’s simply not happening and things are getting back to normal. What we’re seeing now are likely the final attempts to both: get the most of the situation, and provide a public relations cover-up so that it all doesn’t look like market/public manipulation.
I may be too skeptical about all this, but I’ve seen these kinds of techniques used so many times in many areas, mostly in marketing and sales, but also when analyzing history books (how the masses were manipulated and so on), that I really take them at their face value. Of course, it’s just my opinion, and I might be wrong. Also, I’m not saying that the U.S. is “the bad guy” here – I’m saying that politicians (from all countries) and various “groups of interest” might want to influence people, events, and narratives to fit their agendas, and it looks like something like that is taking place.
Let’s check what did the above change on the charts.
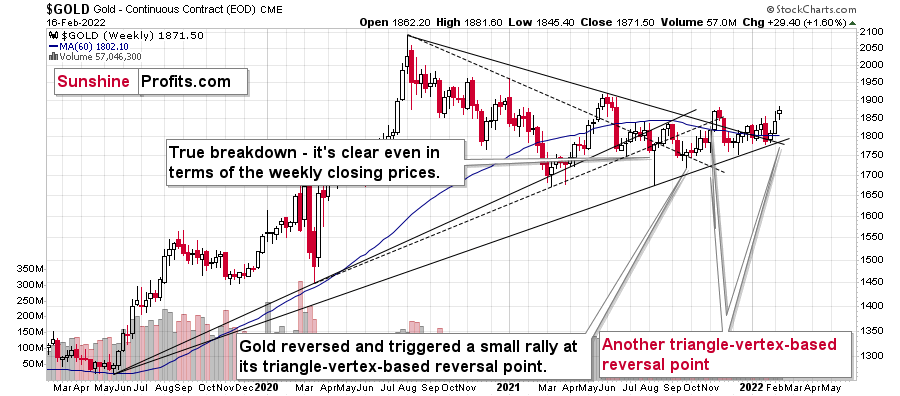
Gold’s weekly chart remains generally unchanged. Gold is visibly up this week, but since this rally is right at its important triangle-vertex-based reversal, its implications are bearish, not bullish.
Interestingly, the above information about the reversal was known in advance, just the exact direction was unclear. Well, it is clear now.
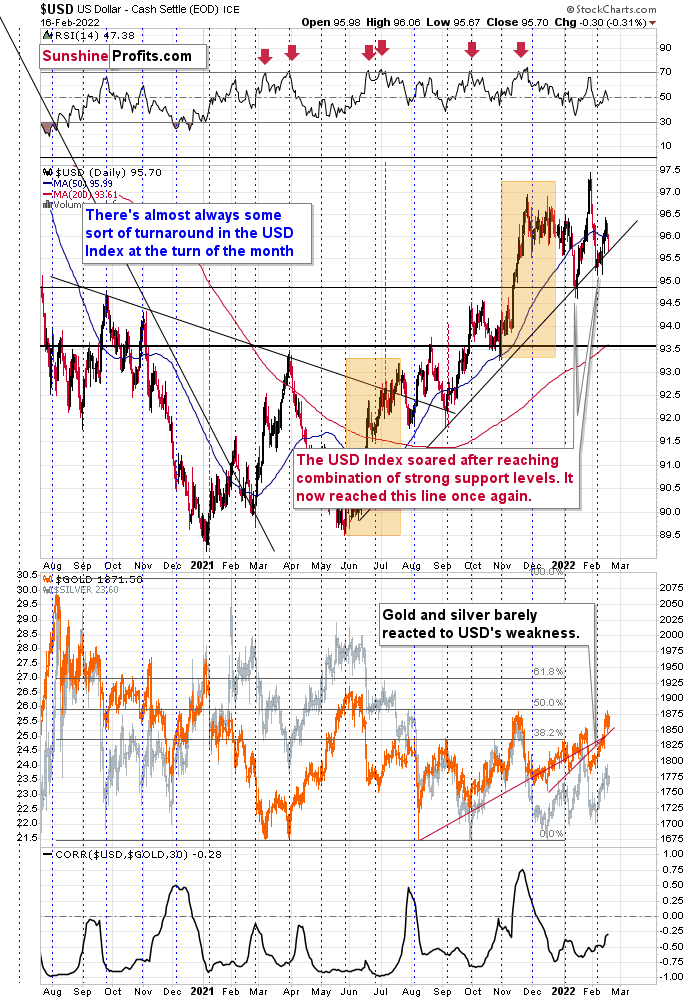
The USD Index is at its medium-term support line. All previous moves to / slightly below it were then followed by rallies, sometimes really big rallies, so we’re likely to see something like that once again.
Such a rally would be the prefect trigger for the triangle-vertex-based reversal in gold and the following slide.
The short-term charts for GLD and GDX are not bullish either, despite the very short-term upswing.
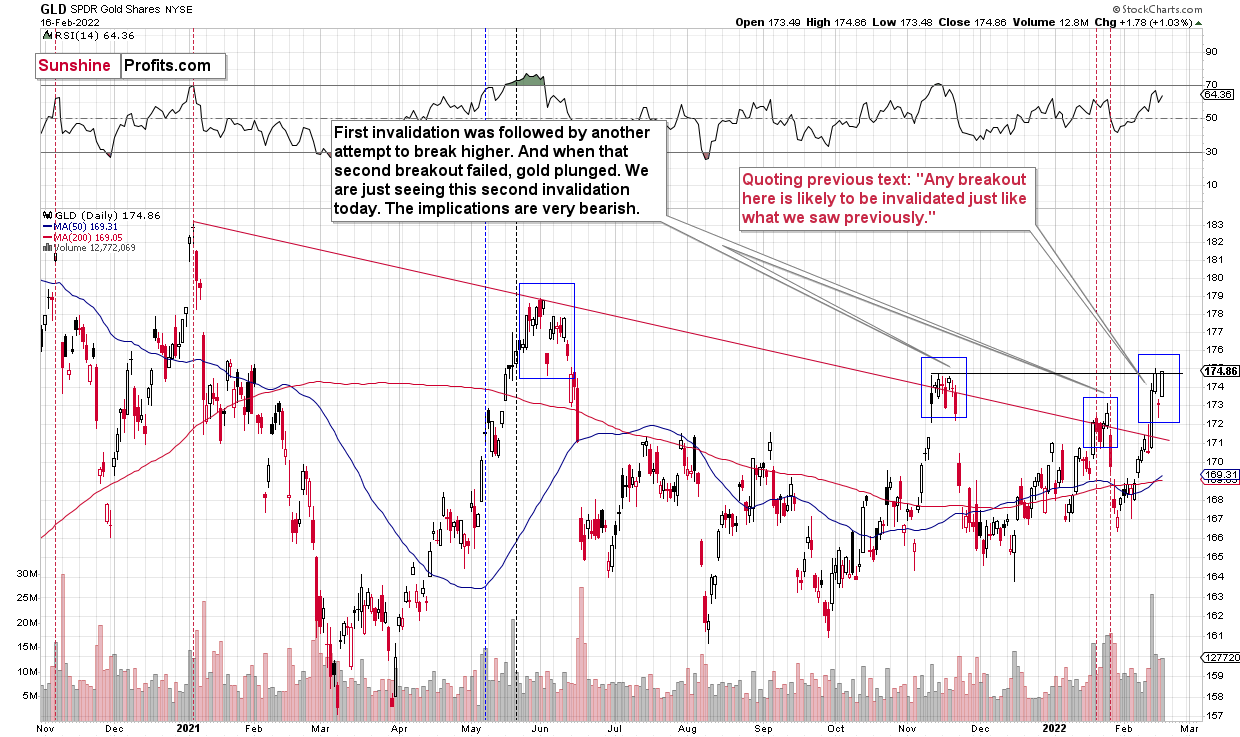
Please note the blue rectangles. It’s common for gold to decline initially, then move back up, and start a massive slide only after the second top. Interestingly, sometimes the second short-term top is below the previous top (June 2021), sometimes it’s close to the previous top (November 2021), and sometimes it’s above the initial top (January 2022).
For now, we see the second top being formed at the level of the previous top, but given today’s pre-market upswing in gold (about $20), GLD is likely to move to new yearly highs before reversing and triggering another powerful slide, just like it happened previously.
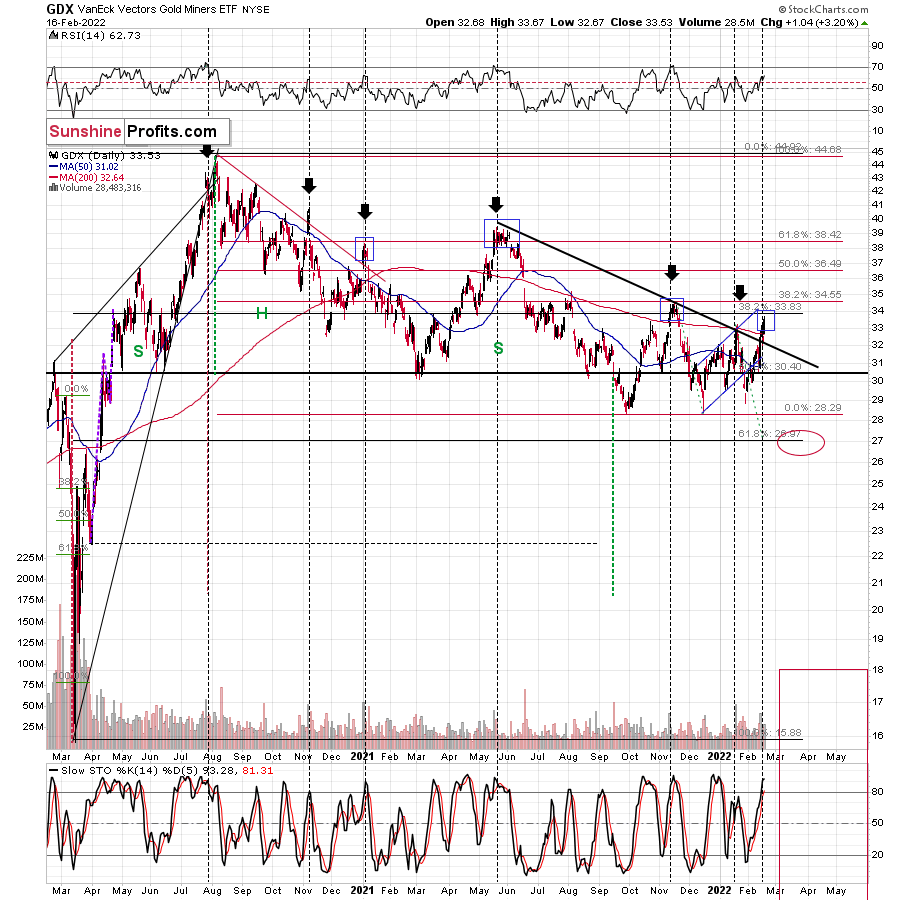
I marked similar situations in the GDX ETF as well, and I also used blue rectangles for them. Broad short-term tops are rather common.
Strong volume accompanied the early parts of the broader short-term tops that I marked. So, the big volume that we saw recently confirms the above.
Yes, the back-and-forth movement that we’ve been seeing is extremely discouraging and boring. No question about it. It’s more boring than the consolidation that we saw in 2013 as the price moves are narrower. However, as the sun always shines after a storm or cloudy day, a much bigger move will stem from this prolonged consolidation.
The bigger the base, the stronger the move.
This huge, boring back-and-forth trading is a giant base – likely for a giant move.
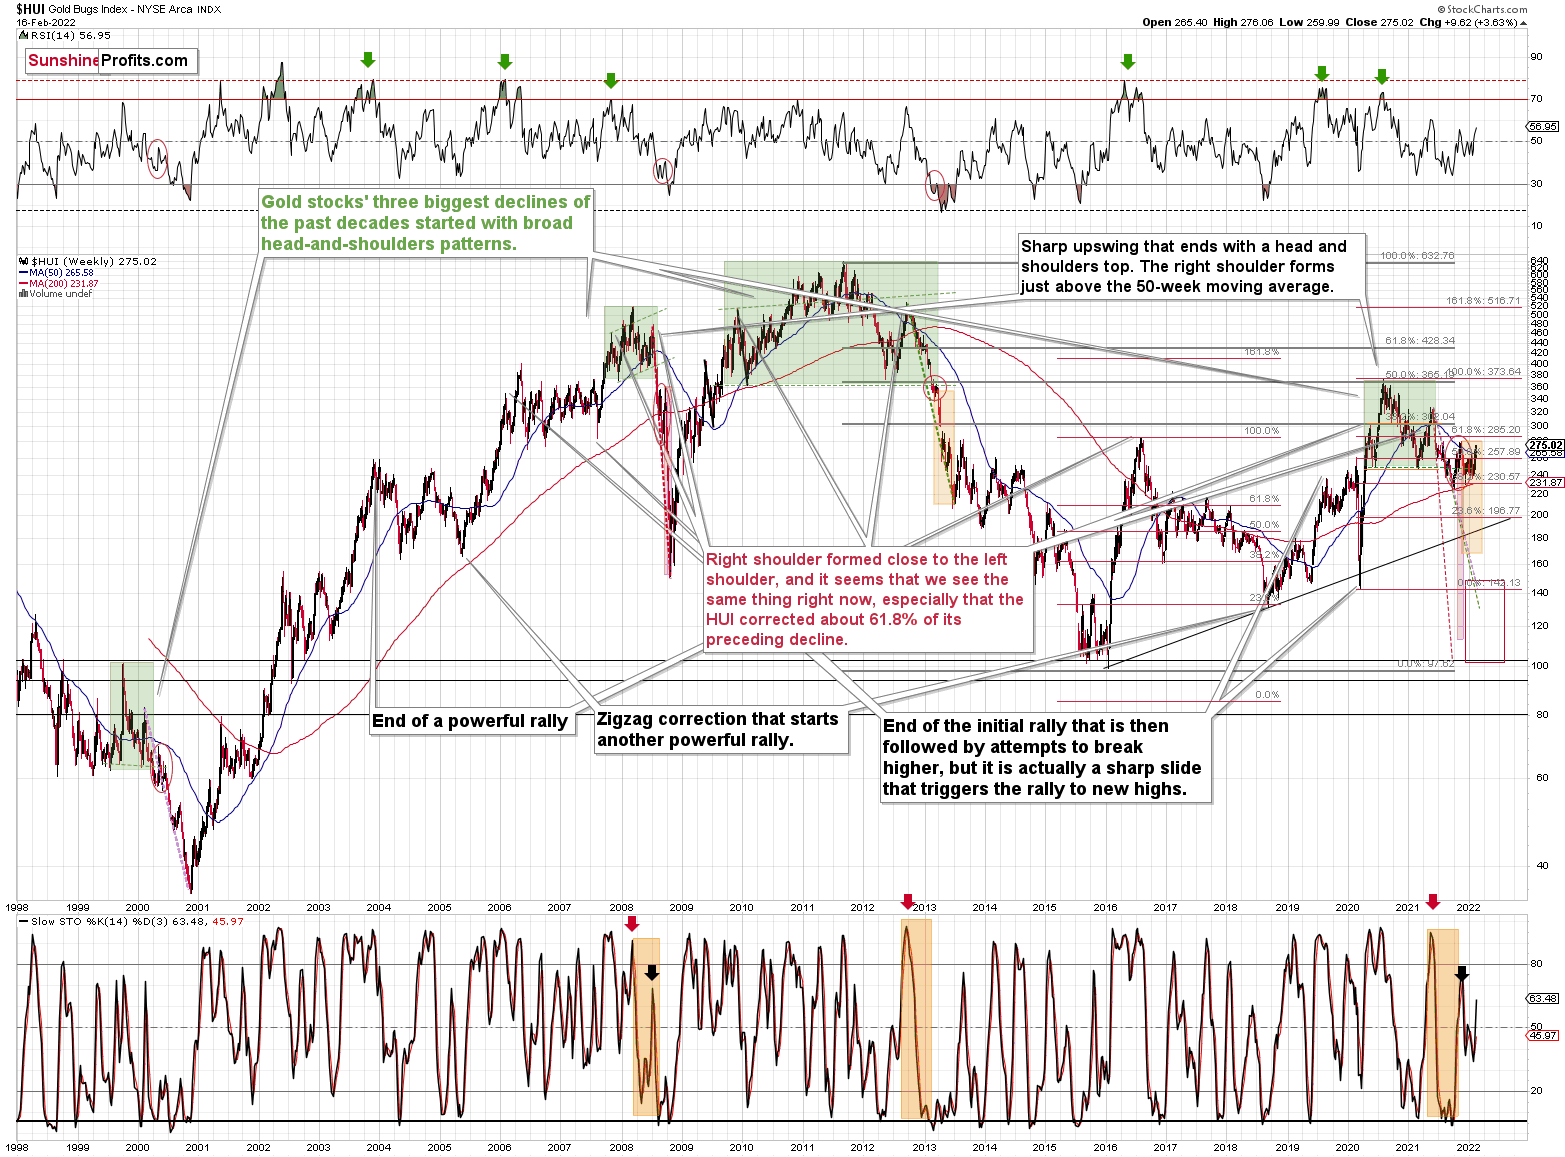
Based on the past patterns (history does rhyme, after all!), we’re about to see something huge. Namely, a profound decline is likely to follow patterns that are similar to what we saw in 2013, 2008, and – to a lesser extent – in 2000.
In my opinion, the wait will be well worth it – at least for those positioned to make the most of this upcoming slide (could be through a short position, but could also be through simply staying away from long positions and getting into them close to the bottom).
Having said that, let’s take a look at the markets from a more fundamental point of view.
March Higher
While the PMs remain uplifted due to geopolitical rumors and speculation, the reality is that the Fed’s next monetary policy meeting is only one month away (Mar. 15/16). With gold, silver, and mining stocks’ fundamental outlooks worsening by the day, another flash crash will likely materialize if/once the Russia-Ukraine conflict settles down.
To explain, the Fed released the minutes from its January 25/26 monetary policy meeting on Feb. 16. While I’ve been warning for months that uncontrolled inflation would elicit a hawkish shift, the report revealed:
“Participants remarked that recent inflation readings had continued to significantly exceed the Committee’s longer-run goal and elevated inflation was persisting longer than they had anticipated, reflecting supply and demand imbalances related to the pandemic and the reopening of the economy.”
More importantly, though:
“With inflation well above 2 percent and a strong labor market, members expected that it would soon be appropriate to raise the target range for the federal funds rate.”
On top of that:
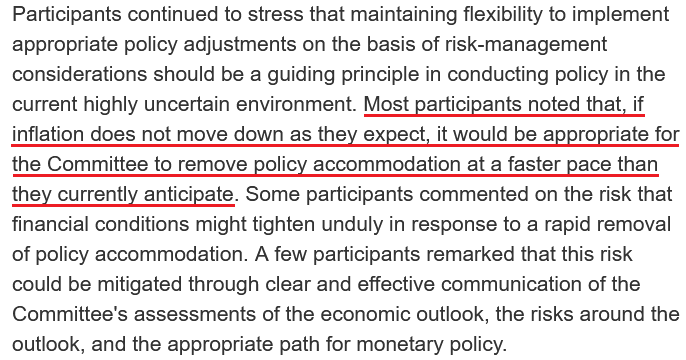 Source: U.S. Fed
If that wasn’t enough, the “median” FOMC member expects quantitative tightening (selling bonds on the balance sheet) to begin in the “third quarter of this year” and occur “at a significantly faster pace” than they thought previously.
Please see below:
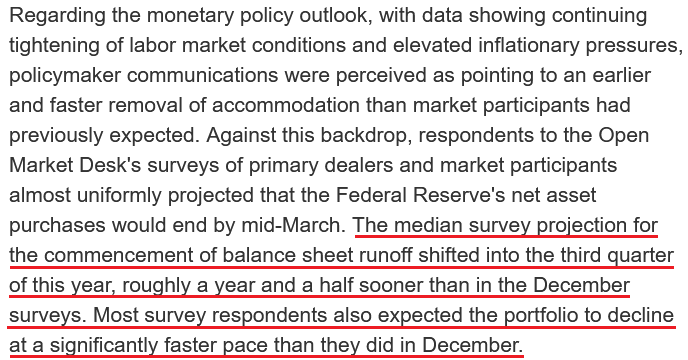 Source: U.S. Fed
As a result, while I warned throughout 2021 that surging inflation would force the Fed’s hand, the PMs remain distracted by the Russia-Ukraine drama. However, with Fed officials forecasting an even swifter liquidity drain than they expected in December, the PMs’ fundamental outlooks are more bearish now than they were in 2021.
To that point, hawkish rhetoric only turns into hawkish policy if inflation, employment and economic growth hold up their end of the bargain. As such, that’s why I warned on numerous occasions that a bullish U.S. economy is bearish for the PMs. Moreover, while inflation and the Omicron variant have depressed consumer sentiment, an important lesson can be learned: focus on what consumers do, not what they say.
To explain, I wrote on Jan. 19:
After U.S. retail sales disappointed on Jan. 14 – falling by 1.9% month-over-month (MoM) versus a decline of 0.1% expected – some investors assume that the weak print may give the Fed cause for pause. However, with depressed December data known to reverse sharply in January, another realization should keep the Fed on hawkish autopilot.
Please see below:
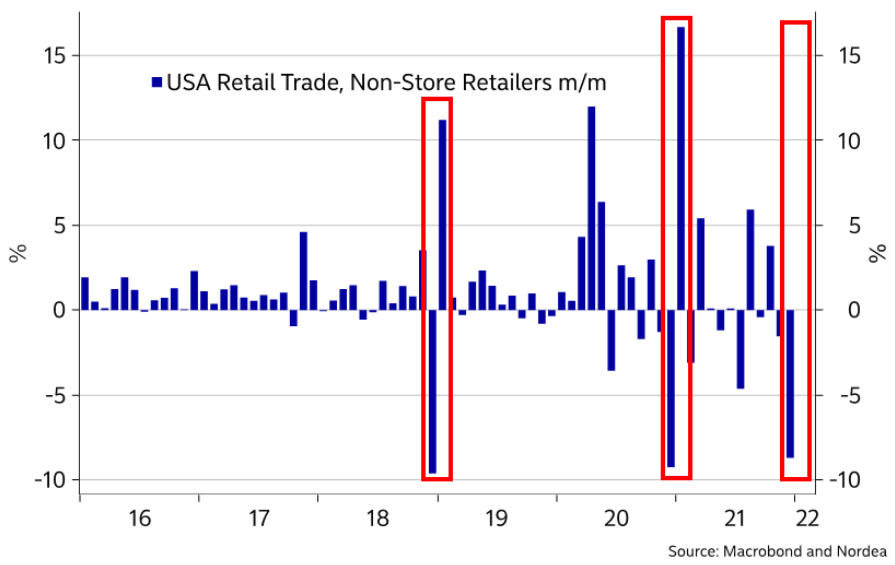
To explain, the blue bars above track the MoM percentage change in non-store (primarily online) retail sales. If you analyze the red rectangles in 2018 and 2020, you can see that sharp December decreases resulted in profound January increases. As a result, another positive re-enactment will likely materialize next month.
To that point, with the U.S. Census Bureau releasing the January data on Feb. 16, a 2.5% MoM decrease (revised) in December turned into a 3.8% MoM increase in January.
Please see below:
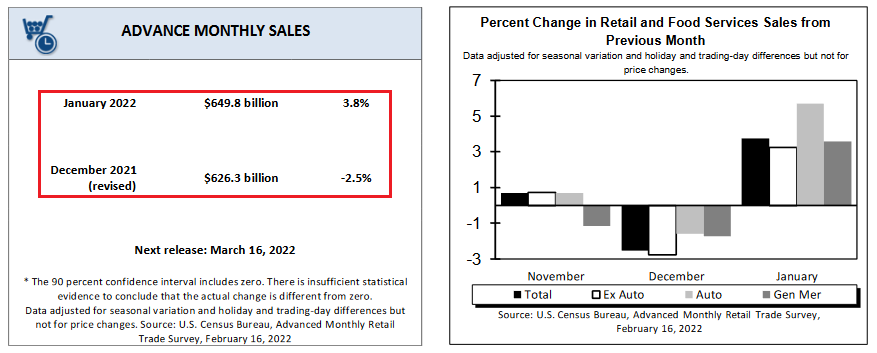
Moreover, non-store retail sales increased by 14.5% MoM in January, and with the overall sum hitting $649.776 billion, January’s data was a new all-time high. As a result, while I’ve highlighted on numerous occasions that U.S. consumers are still cash-rich – despite the narrative that a lack of stimulus checks leaves them destitute – they have plenty of financial ammunition in their bank accounts.
For context, I wrote on Dec. 23:
While “the Fed is trapped” crew cites these issues as reasons for an economic calamity, they often miss the forest through the trees. For example, while the fiscal spending spree may end, U.S. households are still flush with cash.
Please see below:
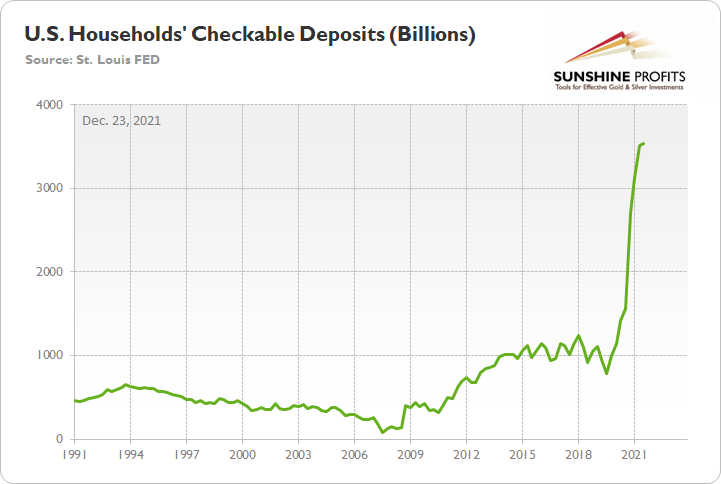
To explain, the green line above tracks U.S. households’ checkable deposits (data released on Dec. 9). In a nutshell: it’s the amount of money that U.S. households have in their checking accounts and/or demand deposit accounts.
If you analyze the vertical ascent on the right side of the chart, you can see that U.S. households have nearly $3.54 trillion in their checking accounts. For context, this is 253% more than Q4 2019 (pre-COVID-19).
Likewise, even though U.S. stimulus has disproportionately flowed to the top, the bottom 50% of American households (based on wealth percentiles) still have plenty of money to spend.
Please see below:
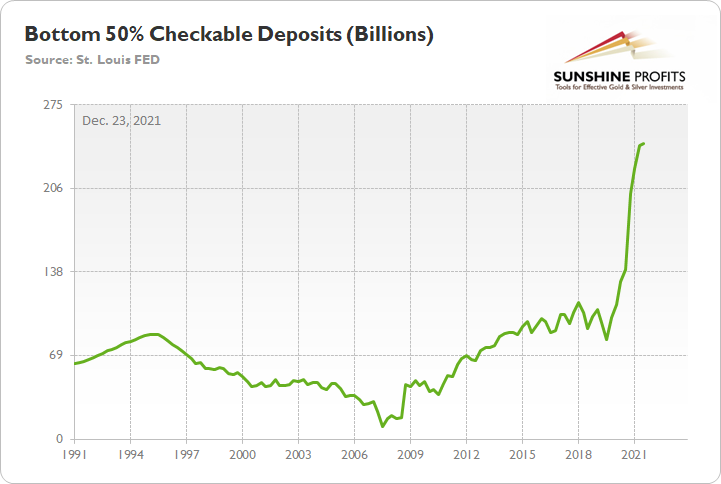
To explain, the green line above tracks the checkable deposits held by the bottom 50% of U.S. households (again, data released on Dec. 9). And with these individuals sitting on nearly $243 billion in cash, it's 142% more than Q4 2019.
Furthermore, whether it's households, corporations or banks, there is plenty of money out there. As such, as long as the U.S. economy remains resilient, the pressure on the Fed should only intensify.
Please see below:
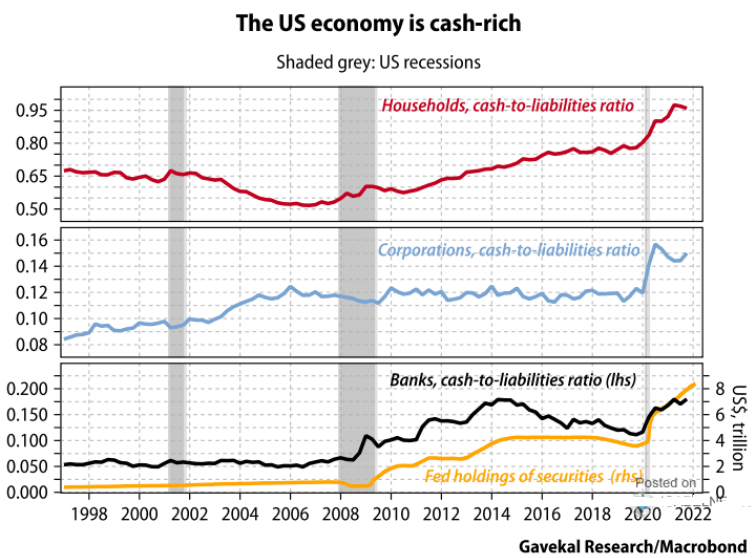
To explain, the red, blue, and black lines above track households, corporations, and banks’ cash-to-liabilities ratios. For context, the yellow line above tracks the Fed’s balance sheet. If you analyze the performance of the three, you can see that cash relative to liabilities is at or near more than 20-year highs.
As a result, while some forecast doom and gloom for the U.S. economy, the reality is that bad outcomes materialize when consumers don’t have money and can’t find employment. In stark contrast, U.S. consumers have plenty of money and job openings are near all-time highs. Thus, the Fed has plenty of reasons to raise interest rates, and liftoff should occur at the Mar. 15/16 monetary policy meeting.
Continuing the theme, another important factor should also uplift the U.S. economy. With coronavirus cases on the decline, the Omicron variant has materially decelerated. Moreover, with the warm weather poised to enhance consumers’ spirits (people are often happier in the summer), it’s another tailwind that should support economic growth.
Please see below:
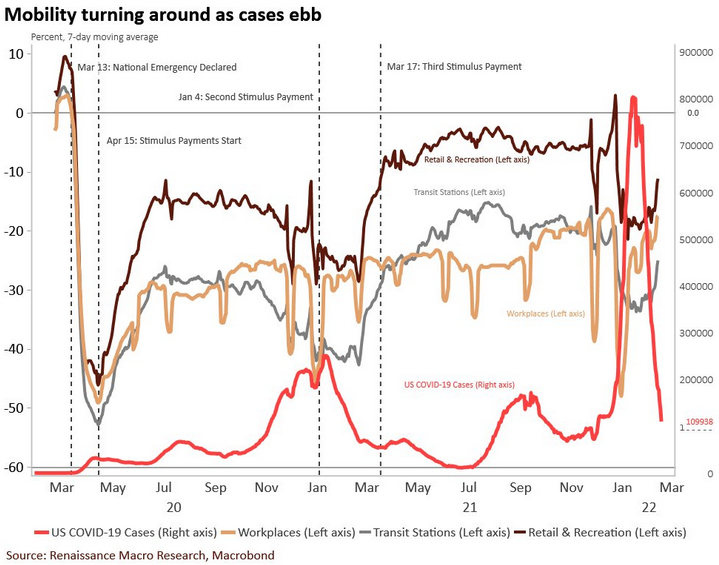
To explain, the red line above tracks U.S. COVID-19 cases, while the light brown, gray, and dark brown lines above track workplace, transit, and retail mobility. If you analyze the connection, you can see that the other three lines often fall when the red line rises. In a nutshell: rising coronavirus cases increase consumers' anxiety, and they often hunker down.
However, if you focus your attention on the right side of the chart, you can see that the sharp drop in the red line has coincided with material increases in the other three lines. As a result, consumers' movement is on the rise, and this supports economic growth.
Furthermore, if you analyze the behavior of the red line, you can see that the spring and summer months (roughly May to July) resulted in fewer COVID-19 cases in 2020 and 2021. As a result, we're approaching a seasonal period where cases should decline, mobility should increase, and that should uplift economic data. Since strong data should elicit a hawkish response from the Fed, it's fundamentally bullish for U.S. Treasury yields and the USD Index and bearish for the PMs.
Finally, while the U.S. economy forges ahead, global growth also remains resilient.
Please see below:
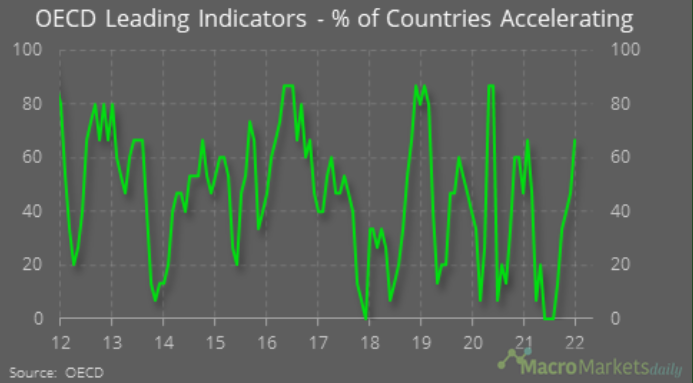
To explain, the green line above tracks the percentage of Organisation for Economic Co-operation and Development (OECD) countries where leading economic indicators are increasing. If you analyze the right side of the chart, you can see that the current proportion is 67%, and the economic upswing is essentially a global phenomenon. As a result, the hawkish realities that stem from resilient growth are unlikely to support the PMs over the medium term.
The bottom line? While gold will likely remain distracted until the Russia-Ukraine drama resolves itself, the fundamentals that supported our bearish outlook in 2021 have only intensified. While geopolitical tensions are short-term bullish, history shows that their influence wanes over the medium term. As a result, while the PMs may be in season right now, the weather can change rather quickly.
In conclusion, the PMs rallied on Feb. 16, as conflicting reports about the Russia-Ukraine situation kept investors on their toes. However, a safe-haven bid for U.S. Treasuries did not materialize, and bonds usually rally hard when genuine fear erupts. As a result, while the short-term implications are frustrating, bearish technical and fundamental realities will likely reign supreme over the medium term.
Overview of the Upcoming Part of the Decline
- It seems to me that the corrective upswing is now over, and that gold, silver, and mining stocks are now likely to continue their medium-term decline.
- It seems that the first (bigger) stop for gold will be close to its previous 2021 lows, slightly below $1,700. Then it will likely correct a bit, but it’s unclear if I want to exit or reverse the current short position based on that – it depends on the number and the nature of the bullish indications that we get at that time.
- After the above-mentioned correction, we’re likely to see a powerful slide, perhaps close to the 2020 low ($1,450 - $1,500).
- If we see a situation where miners slide in a meaningful and volatile way while silver doesn’t (it just declines moderately), I plan to – once again – switch from short positions in miners to short positions in silver. At this time, it’s too early to say at what price levels this could take place, and if we get this kind of opportunity at all – perhaps with gold close to $1,600.
- I plan to exit all remaining short positions once gold shows substantial strength relative to the USD Index while the latter is still rallying. This may be the case with gold close to $1,350 - $1,400. I expect silver to fall the hardest in the final part of the move. This moment (when gold performs very strongly against the rallying USD and miners are strong relative to gold after its substantial decline) is likely to be the best entry point for long-term investments, in my view. This can also happen with gold close to $1,375, but at the moment it’s too early to say with certainty.
- As a confirmation for the above, I will use the (upcoming or perhaps we have already seen it?) top in the general stock market as the starting point for the three-month countdown. The reason is that after the 1929 top, gold miners declined for about three months after the general stock market started to slide. We also saw some confirmations of this theory based on the analogy to 2008. All in all, the precious metals sector is likely to bottom about three months after the general stock market tops.
- The above is based on the information available today, and it might change in the following days/weeks.
You will find my general overview of the outlook for gold on the chart below:
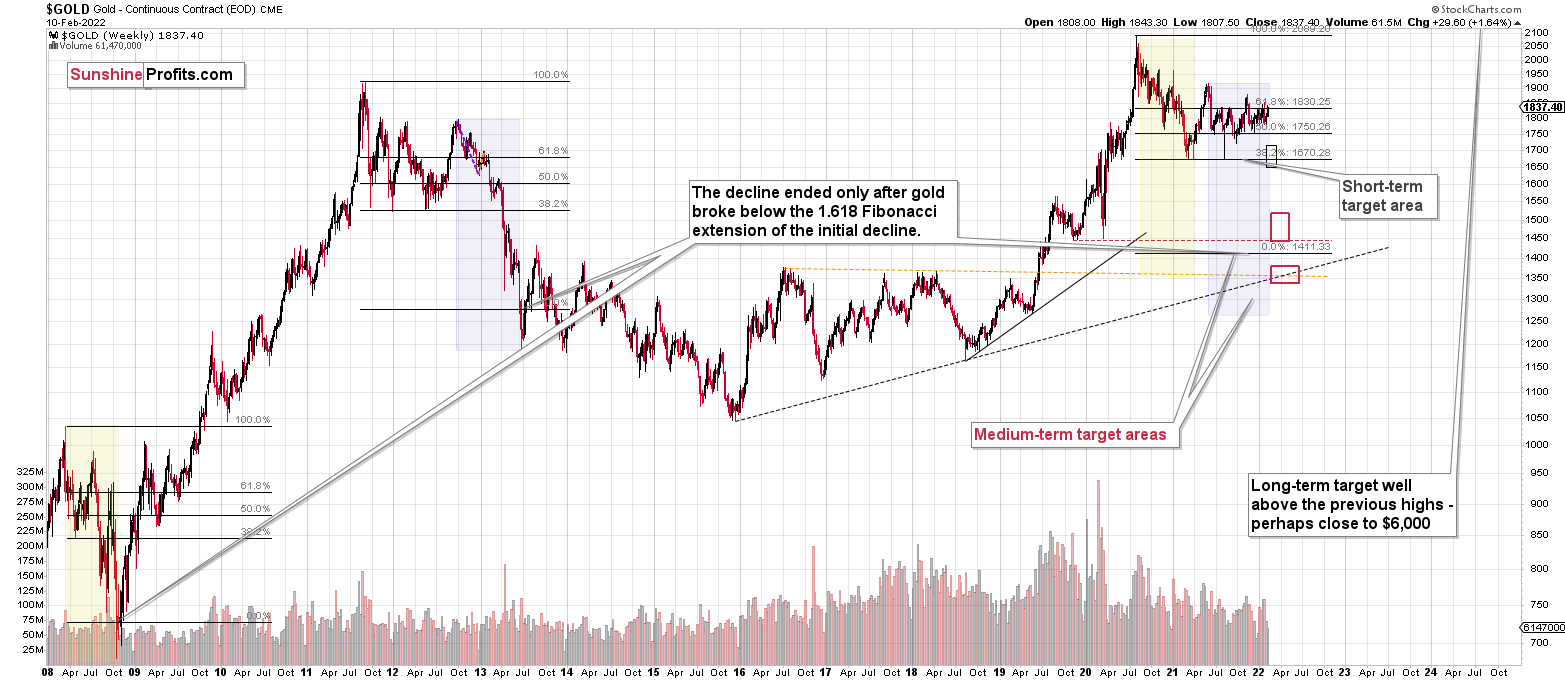
Please note that the above timing details are relatively broad and “for general overview only” – so that you know more or less what I think and how volatile I think the moves are likely to be – on an approximate basis. These time targets are not binding or clear enough for me to think that they should be used for purchasing options, warrants or similar instruments.
Summary
Summing up, it seems to me that the corrective upswing is over, or that we won’t have to wait too long for it to be over. Let’s keep in mind that there are triangle-vertex-based reversals in mid- and late-February, so even if we see more back-and-forth trading soon, it’s likely that the decline resumes later this month.
I continue to think that junior mining stocks are currently likely to decline the most out of all the parts of the precious metals sector.
From the medium-term point of view, the two key long-term factors remain the analogy to 2013 in gold and the broad head and shoulders pattern in the HUI Index. They both suggest much lower prices ahead.
It seems that our profits from the short positions are going to become truly epic in the coming months.
After the sell-off (that takes gold to about $1,350 - $1,500), I expect the precious metals to rally significantly. The final part of the decline might take as little as 1-5 weeks, so it's important to stay alert to any changes.
Most importantly, please stay healthy and safe. We made a lot of money last March and this March, and it seems that we’re about to make much more on the upcoming decline, but you have to be healthy to enjoy the results.
As always, we'll keep you - our subscribers - informed.
To summarize:
Trading capital (supplementary part of the portfolio; our opinion): Full speculative short positions (300% of the full position) in junior mining stocks are justified from the risk to reward point of view with the following binding exit profit-take price levels:
Mining stocks (price levels for the GDXJ ETF): binding profit-take exit price: $34.63; stop-loss: none (the volatility is too big to justify a stop-loss order in case of this particular trade)
Alternatively, if one seeks leverage, we’re providing the binding profit-take levels for the JDST (2x leveraged) and GDXD (3x leveraged – which is not suggested for most traders/investors due to the significant leverage). The binding profit-take level for the JDST: $14.98; stop-loss for the JDST: none (the volatility is too big to justify a SL order in case of this particular trade); binding profit-take level for the GDXD: $25.48; stop-loss for the GDXD: none (the volatility is too big to justify a SL order in case of this particular trade).
For-your-information targets (our opinion; we continue to think that mining stocks are the preferred way of taking advantage of the upcoming price move, but if for whatever reason one wants / has to use silver or gold for this trade, we are providing the details anyway.):
Silver futures downside profit-take exit price: $19.12
SLV profit-take exit price: $17.72
ZSL profit-take exit price: $38.28
Gold futures downside profit-take exit price: $1,683
HGD.TO – alternative (Canadian) inverse 2x leveraged gold stocks ETF – the upside profit-take exit price: $11.79
HZD.TO – alternative (Canadian) inverse 2x leveraged silver ETF – the upside profit-take exit price: $29.48
Long-term capital (core part of the portfolio; our opinion): No positions (in other words: cash
Insurance capital (core part of the portfolio; our opinion): Full position
Whether you already subscribed or not, we encourage you to find out how to make the most of our alerts and read our replies to the most common alert-and-gold-trading-related-questions.
Please note that we describe the situation for the day that the alert is posted in the trading section. In other words, if we are writing about a speculative position, it means that it is up-to-date on the day it was posted. We are also featuring the initial target prices to decide whether keeping a position on a given day is in tune with your approach (some moves are too small for medium-term traders, and some might appear too big for day-traders).
Additionally, you might want to read why our stop-loss orders are usually relatively far from the current price.
Please note that a full position doesn't mean using all of the capital for a given trade. You will find details on our thoughts on gold portfolio structuring in the Key Insights section on our website.
As a reminder - "initial target price" means exactly that - an "initial" one. It's not a price level at which we suggest closing positions. If this becomes the case (like it did in the previous trade), we will refer to these levels as levels of exit orders (exactly as we've done previously). Stop-loss levels, however, are naturally not "initial", but something that, in our opinion, might be entered as an order.
Since it is impossible to synchronize target prices and stop-loss levels for all the ETFs and ETNs with the main markets that we provide these levels for (gold, silver and mining stocks - the GDX ETF), the stop-loss levels and target prices for other ETNs and ETF (among other: UGL, GLL, AGQ, ZSL, NUGT, DUST, JNUG, JDST) are provided as supplementary, and not as "final". This means that if a stop-loss or a target level is reached for any of the "additional instruments" (GLL for instance), but not for the "main instrument" (gold in this case), we will view positions in both gold and GLL as still open and the stop-loss for GLL would have to be moved lower. On the other hand, if gold moves to a stop-loss level but GLL doesn't, then we will view both positions (in gold and GLL) as closed. In other words, since it's not possible to be 100% certain that each related instrument moves to a given level when the underlying instrument does, we can't provide levels that would be binding. The levels that we do provide are our best estimate of the levels that will correspond to the levels in the underlying assets, but it will be the underlying assets that one will need to focus on regarding the signs pointing to closing a given position or keeping it open. We might adjust the levels in the "additional instruments" without adjusting the levels in the "main instruments", which will simply mean that we have improved our estimation of these levels, not that we changed our outlook on the markets. We are already working on a tool that would update these levels daily for the most popular ETFs, ETNs and individual mining stocks.
Our preferred ways to invest in and to trade gold along with the reasoning can be found in the how to buy gold section. Furthermore, our preferred ETFs and ETNs can be found in our Gold & Silver ETF Ranking.
As a reminder, Gold & Silver Trading Alerts are posted before or on each trading day (we usually post them before the opening bell, but we don't promise doing that each day). If there's anything urgent, we will send you an additional small alert before posting the main one.
Thank you.
Przemyslaw Radomski, CFA
Founder, Editor-in-chief

