

Briefly: In our opinion, full (150% of the regular size of the position) speculative short positions in gold, silver and mining stocks are justified from the risk/reward perspective at the moment of publishing this alert.
In Monday’s alert, we featured the remarkable combination of factors that provide uncanny clarity for the prediction of THE bottom in gold. But how do we get there? When and at what price will the decline finally start? Today’s combination of popular and practically unknown factors provides the answer. The Dow to gold ratio is something quite popular among gold bulls – but not in the way that we’re using it in today’s alert.
Let’s start with something known, but discussed in a way that very few understand. The Dow to gold ratio is very often discussed while describing the long-term trends in gold. It is also almost always followed by the statement that gold will go much higher, because stocks are already very high and gold needs to catch up in order to for the ratio to move to historical norms. And that’s fine with us.
What may surprise those who only scan our analyses instead of digging deeper is that we’re actually very bullish on gold for the following years. We just don’t think it has moved beyond the ultimate buying opportunity yet and we’re meticulously planning to take advantage of it. We’re expecting gold to move well above its 2011 high. In fact, we think gold is likely to more than double its 2011 high and we’ll get into details in one of the upcoming analyses.
Moving back to the relationship between gold and the general stock market, there is also another way to look at it. First of all, it seems that using S&P 500 instead of the DJIA might be useful. It represents more stocks and thus could be more meaningful and less vulnerable to an individual company’s price swings. Secondly, the ratio can be useful in the case of medium-term moves, not only for analyses that are oriented on the very long term.
Let’s take a closer look (chart courtesy of http://stockcharts.com).
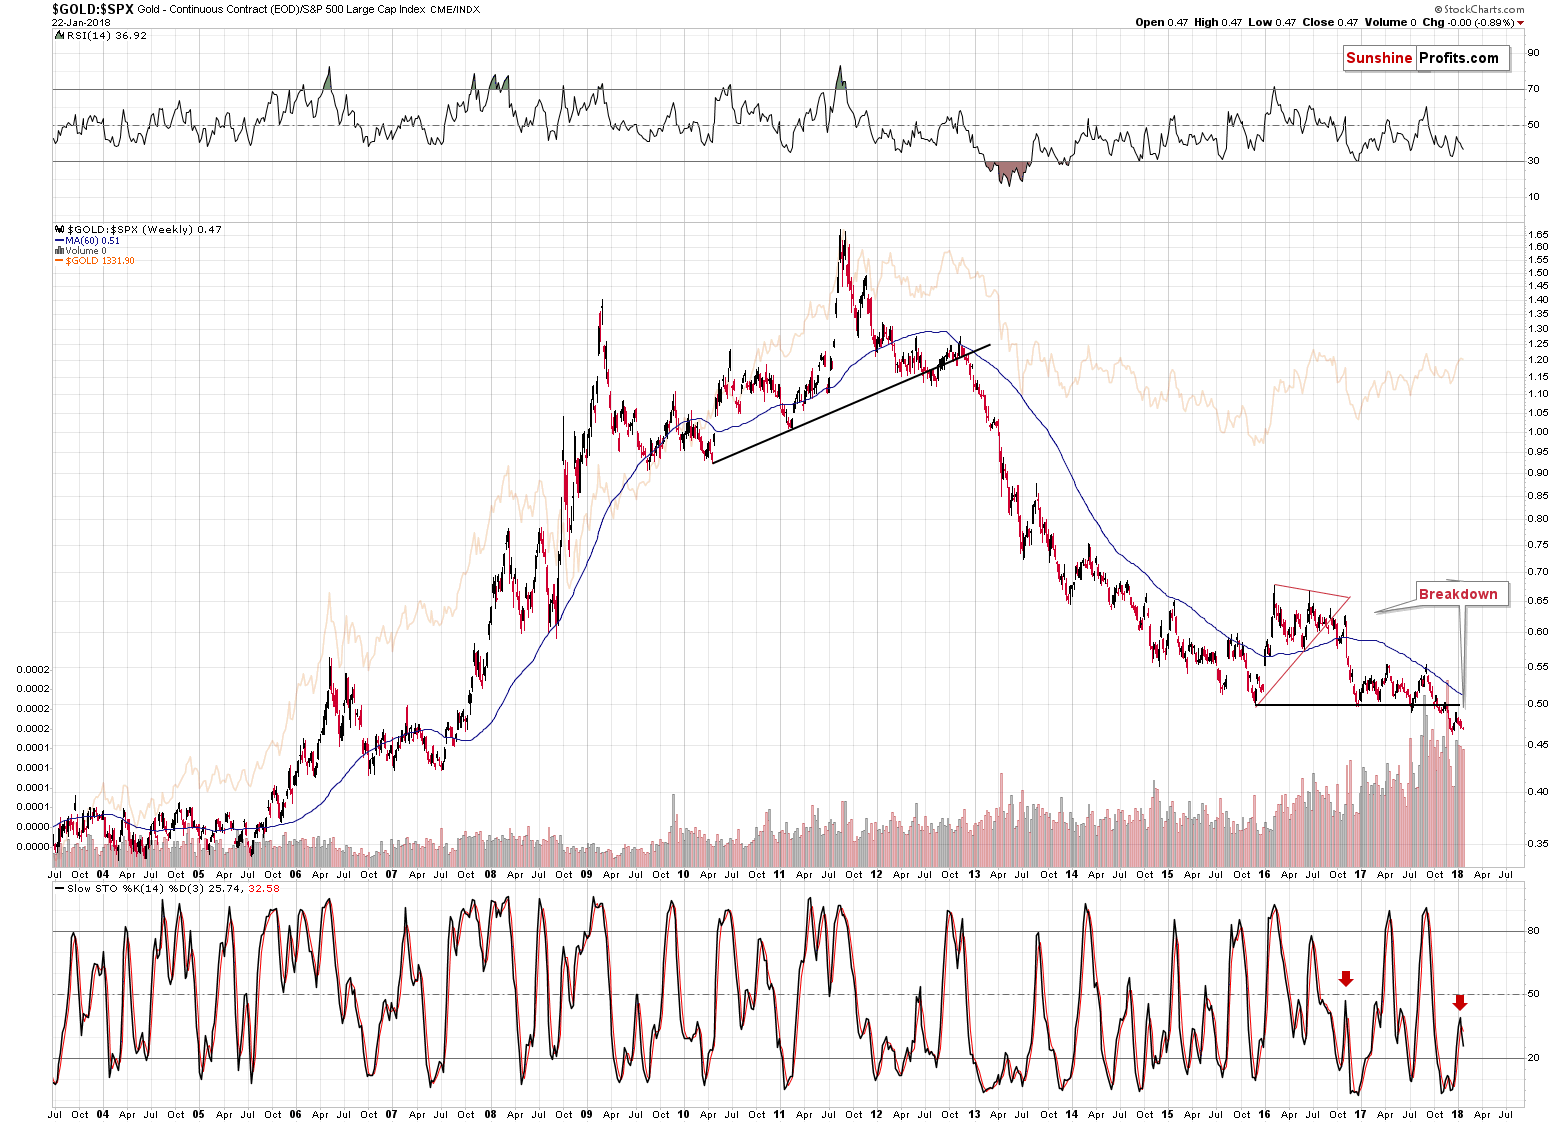
The special thing about the gold to S&P ratio is that it smoothens the price swings and makes it clear what’s really going on. In the case of the price of gold itself, the short-term price swings are more important and they look just like early parts of bigger moves. In the case of the ratio, however, the small moves are even smaller and the bigger ones are even bigger. It’s easier to differentiate between them in this way.
The flag example is the 2012 breakdown and the early 2013 decline. In the case of gold, it still looked like a consolidation after a rally, but the ratio showed that the rally was over. The latter turned out to be the reality.
The ratio is now after a major breakdown and after a corrective upswing that verified it. It now resumed its decline as confirmed by the sell signal from the Stochastic indicator.
The significance of the above is much greater than it may appear at the first sight. The reasons are the analogies to the similar cases. The breakdown below a major support line is very important because the only analogous case was the 2012 breakdown. The one that started the huge slide in the precious metals prices. Why is the confirmation so significant? Because we already had fake breakdowns previously that were shortly invalidated. Not this time. This time the implications are fully bearish and confirmed.
Speaking of the confirmation and sell signal from the Stochastic indicator – it’s significant, because of the similarity to the action in late 2016. Back then the ratio broke below the triangle pattern and rallied back up. It then topped and continued to slide – and this slide was confirmed by the sell signal from the Stochastic indicator. We’re seeing the same kind of confirmation this time. Just as the price of gold followed the ratio lower, the same appears likely this time.
By the way, the ratio topped right at the apex of the triangle, which further confirms the usefulness of the apex reversal technique that we discussed yesterday.
Since we started today’s alert by discussing ratios, let’s stay with them for a while. We have recently received a subscriber’s request to provide our thoughts on the gold to silver ratio and in today’s analysis we deliver.
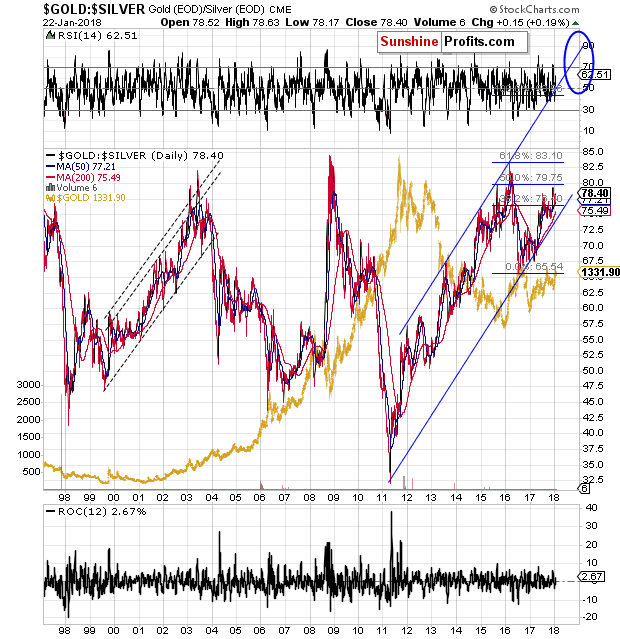
We provided our detailed take on this ratio in July and all the reasoning regarding the price target remains up-to-date. We have, however, moved the target further in time. Consequently, we’ll discuss the above chart by quoting what we wrote a few months ago and modifying the text, when necessary:
The first thing that comes to mind while looking at the above chart is that the tops in the ratio usually correspond to bottoms in the precious metals market - silver tends to underperform gold to a big extent in the final part of the decline. The mid-2003 spike in the ratio doesn’t directly confirm this rule (there was a local bottom at that time, though), but the 2008 spike, 2011 bottom and the 2016 spike certainly do. So, while it is not inevitable, it seems likely that the major bottom in the precious metals will be accompanied by a big upward spike in the gold to silver ratio i.e. silver’s extreme underperformance.
Having said the above, let’s move to the current trend. Despite the decline in 2016, the main direction in which the ratio is heading is still up. We marked the borders of the rising trend channel with blue lines and the ratio is still closer to the lower line than the upper one – meaning that the upside potential remains intact.
If the ratio is to continue to move higher (it’s likely, because an uptrend is intact as long as there is no confirmed breakdown below it), then we can expect the upper border of the trend channel to be reached (or breached – more on that in just a moment) before the top is in. If this is to be seen in the September – October timeframe, then we can expect the ratio to move to about 94 - 100. The upper border of this target area is provided by the upper border of the mentioned trend channel.
The lower border of this target area is supported by Fibonacci extensions based on the 2016 bottom, 2016 top and the 2015 top. Fibonacci extensions work similarly to Fibonacci retracements – they differ, because the latter provide targets between the levels that have already been reached, while the former are usually used to provide targets outside of the previous trading range. In this case, we get 94 as an upside target.
One might ask that if the above is the case, then why didn’t we draw the target area around the 94 level, but between 94 and 100 – actually even above 100. There are two good reasons for it.
The first reason is visible on the above chart. Namely, history tends to repeat itself to a considerable extent, and during the previous steady uptrend (the 2008 lack-of-liquidity-driven spike was far from being steady) at the beginning of this century, the gold to silver ratio moved temporarily above the upper border of the trend channel (marked with dashed lines) and formed a top above it. Consequently, the upper border of the current rising trend channel may not stop the rally in the following months. Instead, a breakout above it might indicate that the key top in the ratio and the key bottom in the precious metals market are just around the corner.
The second reason for a higher target is visible on the chart below that includes even more data than the previous one.
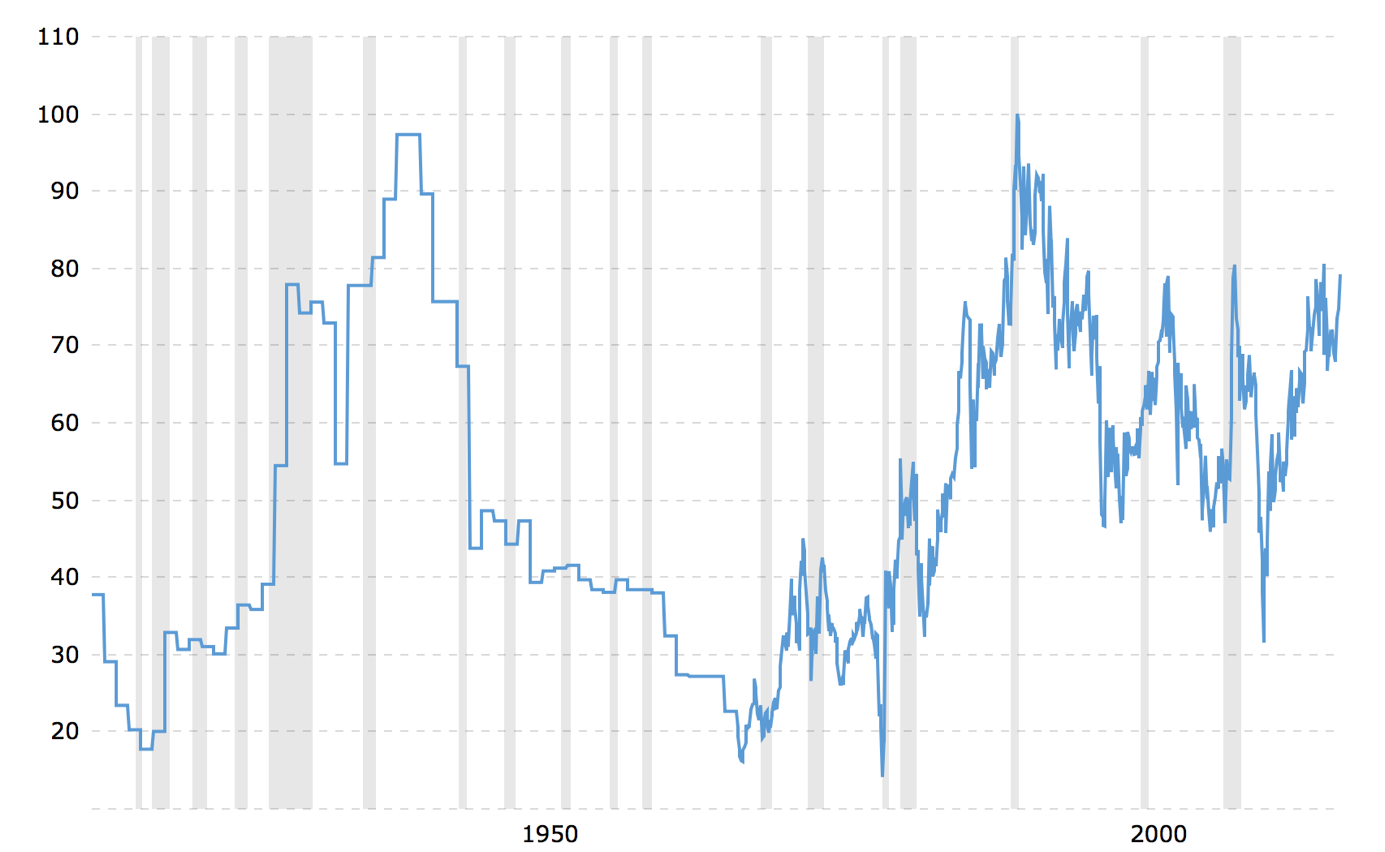
The tops that you saw on the previous chart appear to be the key long-term tops, but in reality, the key long-term tops are at / closer to the 100 level, while the ones from this century are not as important. Surely, they all are important long-term tops, however, we need to keep in mind that the strongest resistance will not be provided by the 2003 or 2008 tops, but by the 100 level.
Moreover, please note that round numbers tend to be important support and resistance levels as they tend to attract more attention (for instance, gold breaking below $1,000 will definitely get more attention than a breakdown below $1,032) – it would be difficult to find a rounder number for the ratio to reach than the 100 level.
Additionally, if the final bottom in the precious metals market was not reached in late 2015 / early 2016, because too many investors were still bullish at that time, then perhaps the extreme that the gold to silver ratio reached at that time was not extreme enough. The next resistance above the 2015 / 2016 tops is provided by the very long-term tops at or a little below 100.
So, should one ignore everything else and wait with the purchases until the gold to silver ratio spikes to 100? Of course not. That’s just one of the tools that one can use in order to determine the optimal entry prices. On a side note, please note that we wrote “optimal” instead of “final” lows. The reason is that it is not 100% certain that a bottom is in at a specified price (it can only be certain when one looks at the past prices after a longer while), so while it may be tempting to wait for the perfect target to be reached, it might be more prudent to place the buy order above the target price to greatly increase the chance of filling it at all – however, these details go beyond the topic of this essay.
When the ratio approaches its target area, all other signals will become more important – for instance gold reaching important support levels without the same action in silver or mining stocks - but with the gold to silver ratio at exactly 100 or only a bit below it and a couple other confirmations, it might be wise to invest at least partially in the entire trio (gold, silver and miners), as the confirmations would make gold’s reaching its target much more important for the entire sector than it would be without the confirmations. In other words, the gold to silver ratio serves as yet another tool in the investors’ arsenal that can help to determine whether or not the final bottom is in or at hand. It’s not a crystal ball, but one of the things one needs to keep in mind when investing capital in this promising sector. We’ll discuss other confirmations and tools in the following parts of the Preparing for THE Bottom series.
The next two charts will be more “regular”, which doesn’t make them any less important.
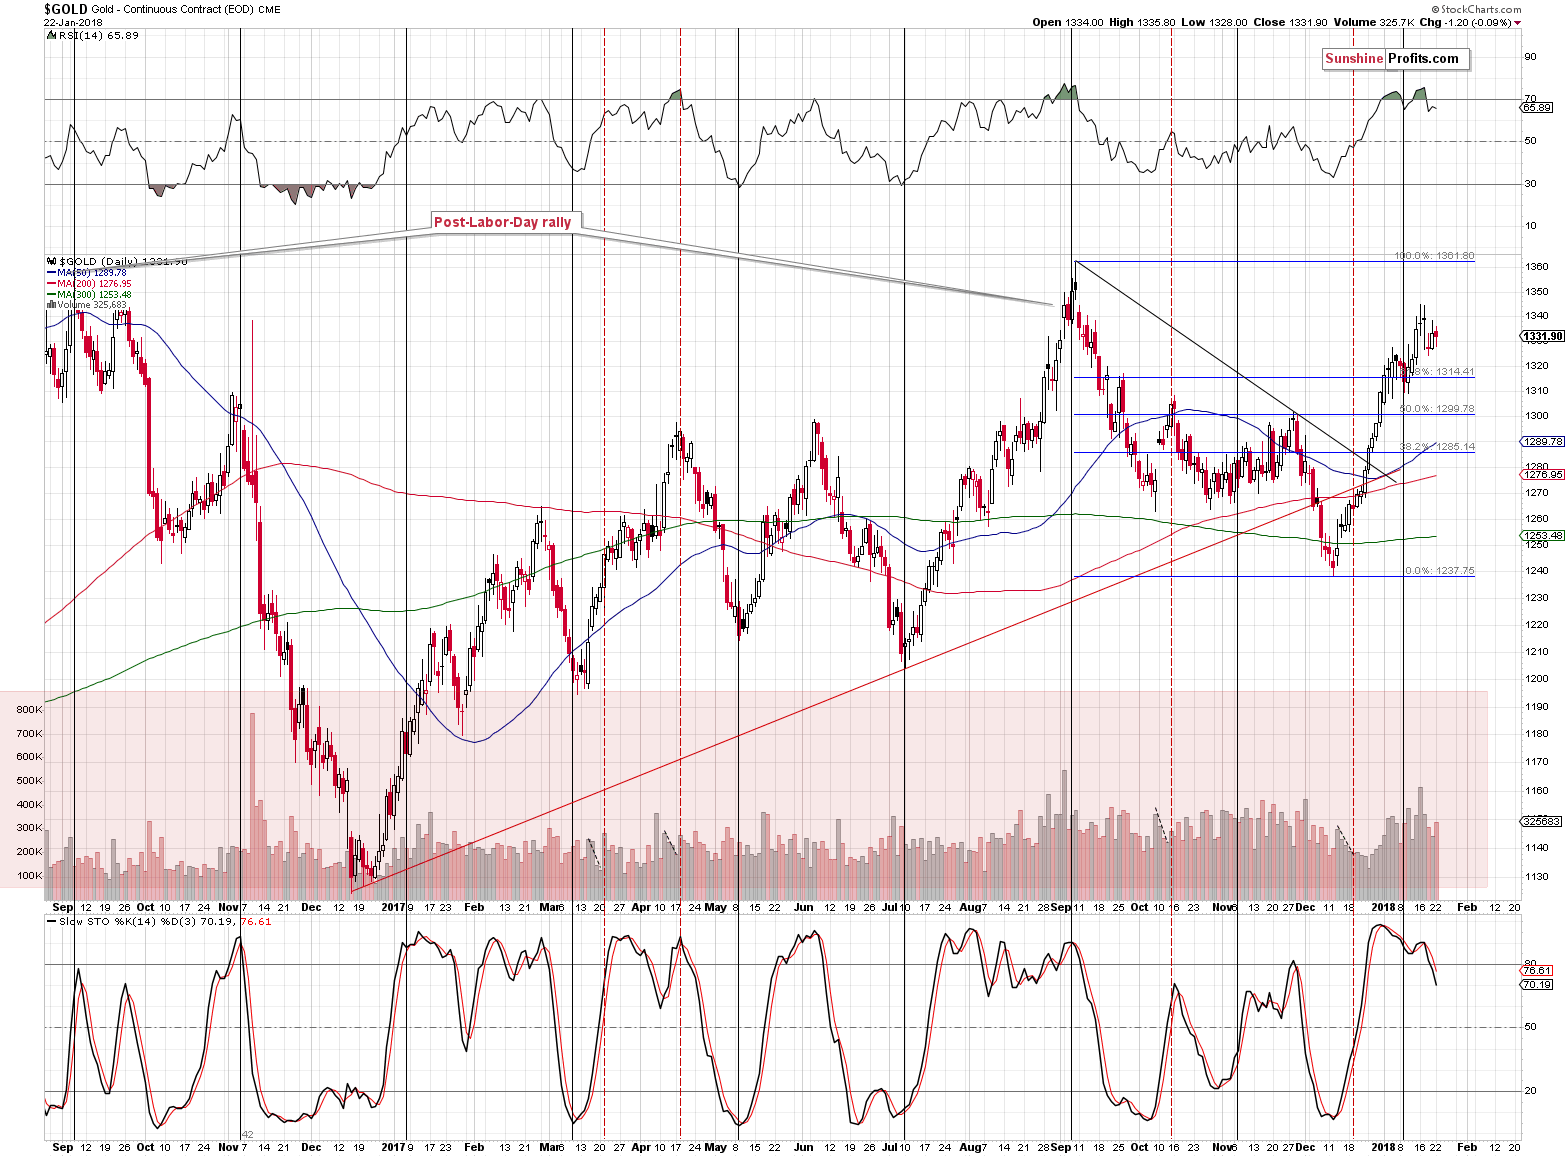
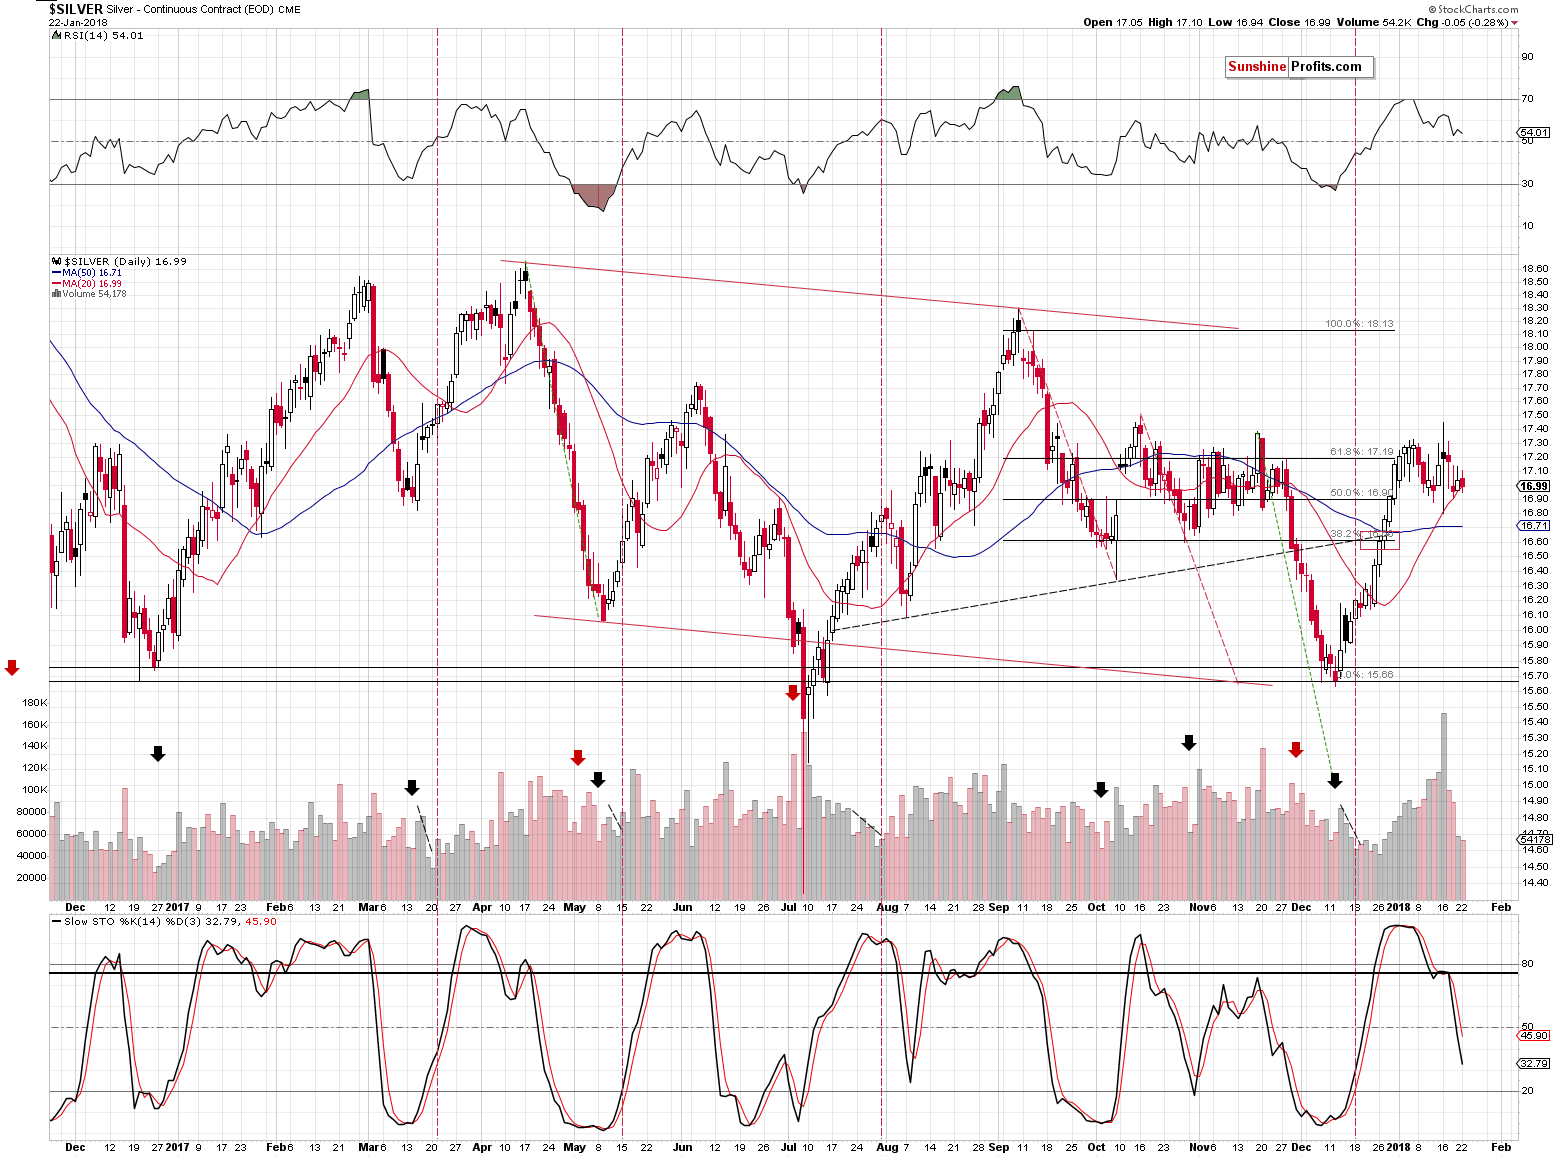
Our comments on the above charts will be short because nothing happened and we have nothing new to add to what we already discussed yesterday. The bottom line is that it still appears that we’re seeing a topping action in the precious metals market.
The bearish nature of the metals-USD link remains in place.
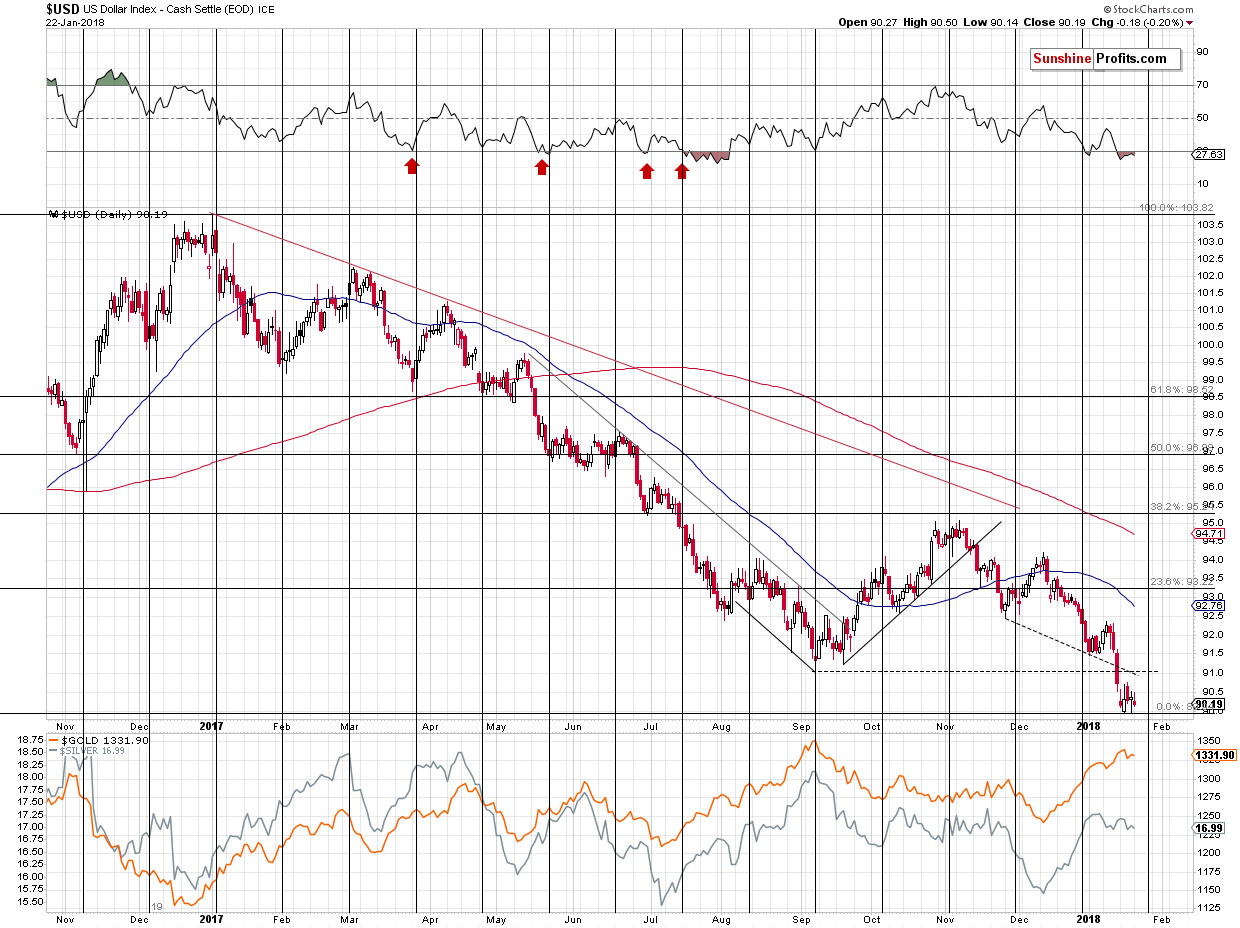
The USD Index moved lower (just a little, but still) and metals failed to move higher.
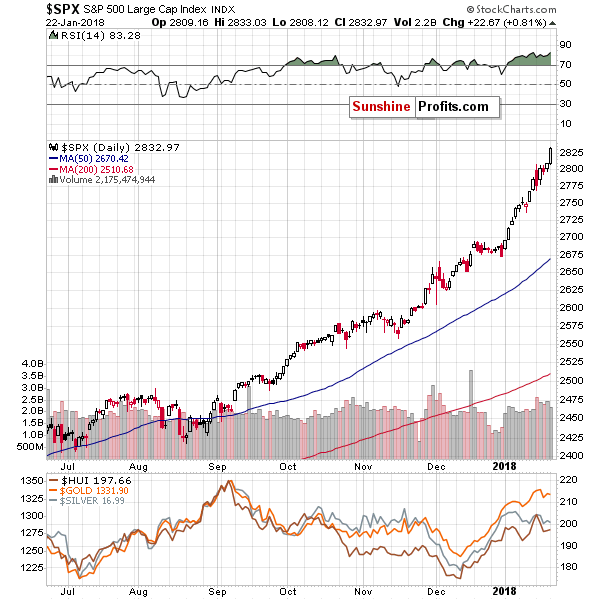
The general stock market soared again. Silver and miners should have rallied.
They didn’t.
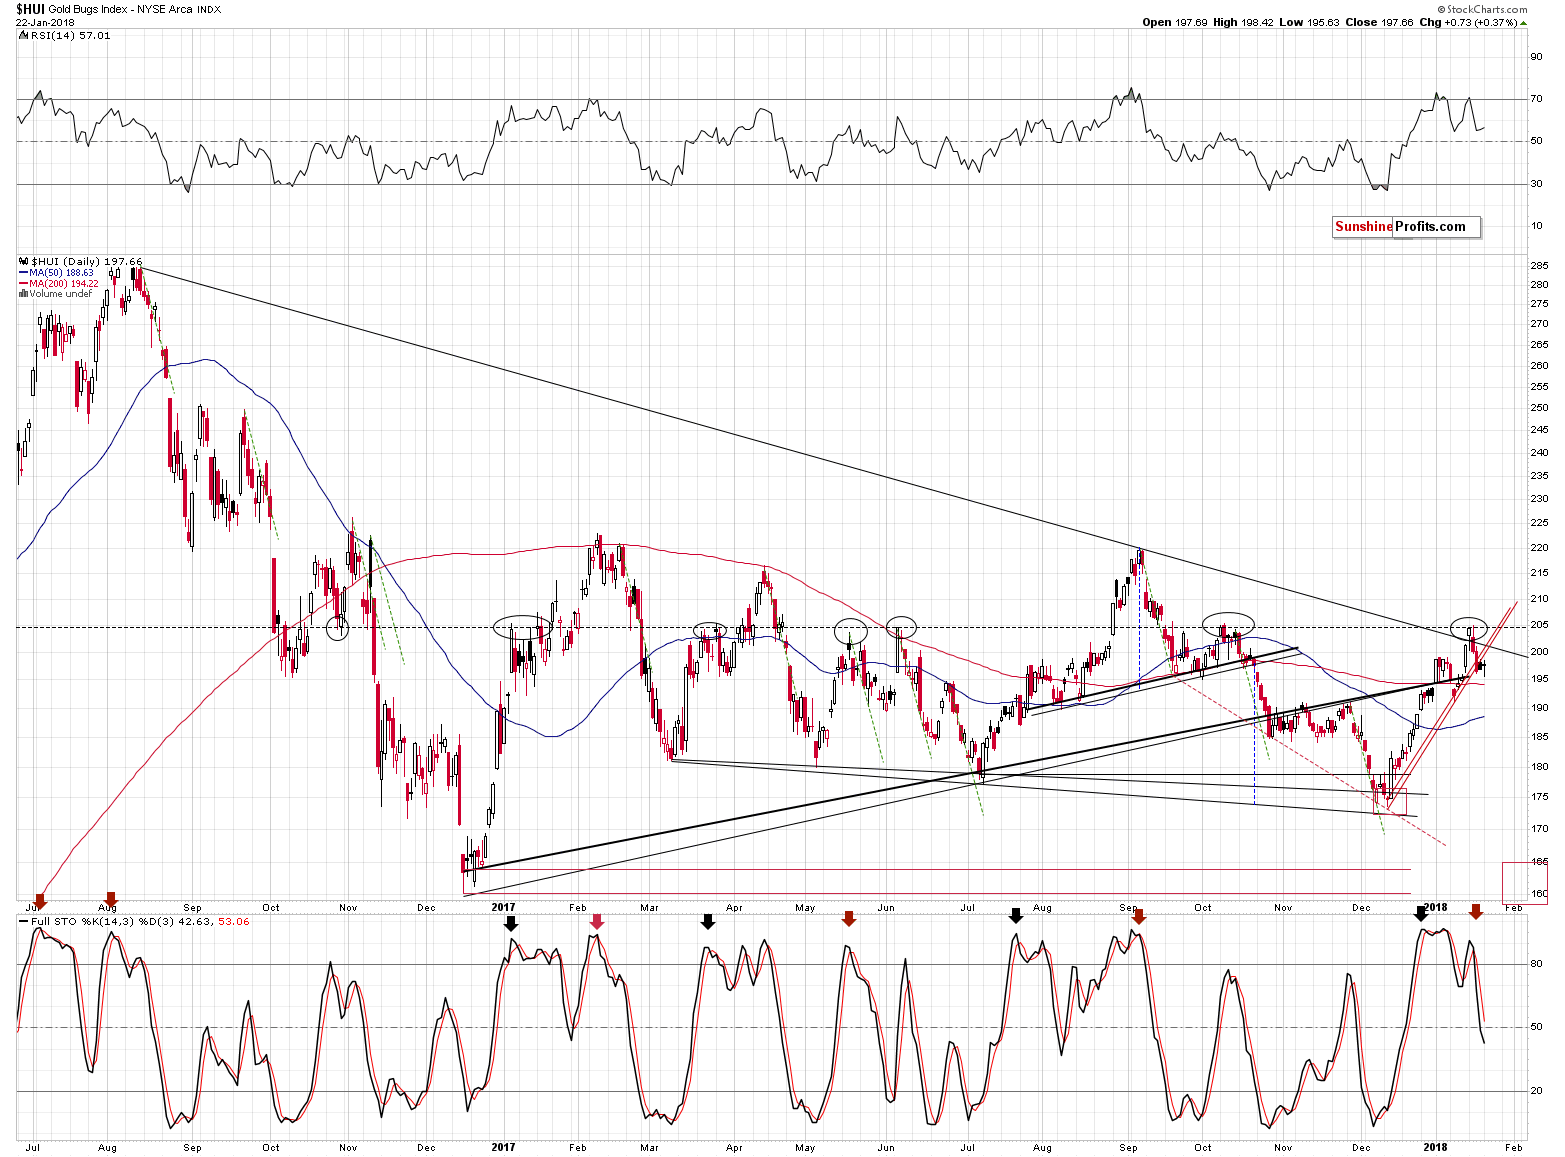
The HUI Index had excellent reason to invalidate the short-term breakdown. It didn’t. All it managed to do was to rally by 0.37%. That’s next to nothing given the S&P’s rally. The breakdown is being verified and the implications are already bearish.
Let’s stay with the mining stocks for a while and zoom out.
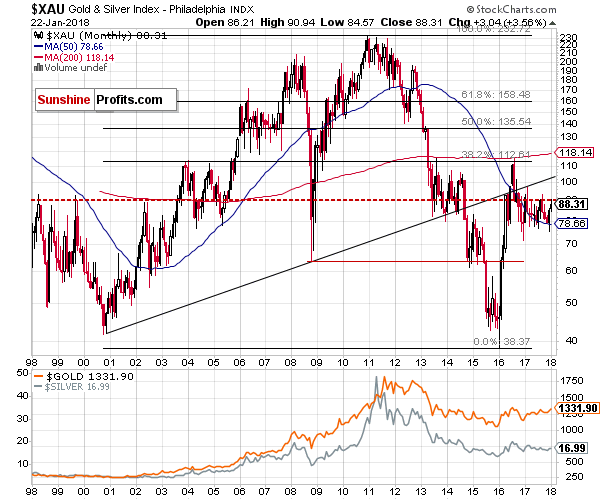
This time we’ll use the XAU Index as a proxy for the sector. It’s usually good to use the HUI Index as it includes only gold stocks and this makes it useful for comparison with gold. This time, however, we want to focus on the entire sector, so we’re using a proxy that also includes silver stocks.
The interesting thing about the ratio is that it’s just below 90.
- What’s interesting about that?
Seems irrelevant until you zoom out and see what happened when the XAU was just below or at 90 in the past. Before 2000 we saw three major tops at these levels. These tops were followed by a decline that took the XAU to the final bottom. Then, in 2002, after the final bottom was formed, it provided the first strong resistance.
We have seen a few tops close to the 90 level in the previous months, which is an indication that the slide from here could be the final one.
Summing up, it’s very probable that the big decline in the precious metals sector is already underway or about to start. The above is supported by both known and little-followed factors that only very few are aware of.
As always, we will keep you – our subscribers – informed.
To summarize:
Trading capital (supplementary part of the portfolio; our opinion): Full short positions (150% of the full position) in gold, silver and mining stocks are justified from the risk/reward perspective with the following stop-loss orders and initial target price levels:
- Gold: initial target price: $1,218; stop-loss: $1,364; initial target price for the DGLD ETN: $53.98; stop-loss for the DGLD ETN $38.28
- Silver: initial target price: $14.63; stop-loss: $17.72; initial target price for the DSLV ETN: $33.88; stop-loss for the DSLV ETN $21.28
- Mining stocks (price levels for the GDX ETF): initial target price: $19.22; stop-loss: $26.14; initial target price for the DUST ETF: $39.88; stop-loss for the DUST ETF $19.78
In case one wants to bet on junior mining stocks' prices (we do not suggest doing so – we think senior mining stocks are more predictable in the case of short-term trades – if one wants to do it anyway, we provide the details), here are the stop-loss details and initial target prices:
- GDXJ ETF: initial target price: $27.82; stop-loss: $38.22
- JDST ETF: initial target price: $94.88 stop-loss: $37.78
Long-term capital (core part of the portfolio; our opinion): No positions (in other words: cash)
Insurance capital (core part of the portfolio; our opinion): Full position
Important Details for New Subscribers
Whether you already subscribed or not, we encourage you to find out how to make the most of our alerts and read our replies to the most common alert-and-gold-trading-related-questions.
Please note that the in the trading section we describe the situation for the day that the alert is posted. In other words, it we are writing about a speculative position, it means that it is up-to-date on the day it was posted. We are also featuring the initial target prices, so that you can decide whether keeping a position on a given day is something that is in tune with your approach (some moves are too small for medium-term traders and some might appear too big for day-traders).
Plus, you might want to read why our stop-loss orders are usually relatively far from the current price.
Please note that a full position doesn’t mean using all of the capital for a given trade. You will find details on our thoughts on gold portfolio structuring in the Key Insights section on our website.
As a reminder – “initial target price” means exactly that – an “initial” one, it’s not a price level at which we suggest closing positions. If this becomes the case (like it did in the previous trade) we will refer to these levels as levels of exit orders (exactly as we’ve done previously). Stop-loss levels, however, are naturally not “initial”, but something that, in our opinion, might be entered as an order.
Since it is impossible to synchronize target prices and stop-loss levels for all the ETFs and ETNs with the main markets that we provide these levels for (gold, silver and mining stocks – the GDX ETF), the stop-loss levels and target prices for other ETNs and ETF (among other: UGLD, DGLD, USLV, DSLV, NUGT, DUST, JNUG, JDST) are provided as supplementary, and not as “final”. This means that if a stop-loss or a target level is reached for any of the “additional instruments” (DGLD for instance), but not for the “main instrument” (gold in this case), we will view positions in both gold and DGLD as still open and the stop-loss for DGLD would have to be moved lower. On the other hand, if gold moves to a stop-loss level but DGLD doesn’t, then we will view both positions (in gold and DGLD) as closed. In other words, since it’s not possible to be 100% certain that each related instrument moves to a given level when the underlying instrument does, we can’t provide levels that would be binding. The levels that we do provide are our best estimate of the levels that will correspond to the levels in the underlying assets, but it will be the underlying assets that one will need to focus on regarding the signs pointing to closing a given position or keeping it open. We might adjust the levels in the “additional instruments” without adjusting the levels in the “main instruments”, which will simply mean that we have improved our estimation of these levels, not that we changed our outlook on the markets. We are already working on a tool that would update these levels on a daily basis for the most popular ETFs, ETNs and individual mining stocks.
Our preferred ways to invest in and to trade gold along with the reasoning can be found in the how to buy gold section. Additionally, our preferred ETFs and ETNs can be found in our Gold & Silver ETF Ranking.
As a reminder, Gold & Silver Trading Alerts are posted before or on each trading day (we usually post them before the opening bell, but we don't promise doing that each day). If there's anything urgent, we will send you an additional small alert before posting the main one.
=====
Latest Free Trading Alerts:
The U.S. government partially closed at midnight on Friday. But the UK deals with a much more serious crisis. Potentially also for gold.
While Everyone Focuses on U.S. Government Shutdown, This Country Faces Crisis
S&P 500 index gained 0.8% on Monday, as it accelerated its uptrend following breakout above 2,800 mark. Will the euphoria run reach even further?
S&P 500 Up 6% Since Year End, Stocks Continue Higher Despite Warning Signs
=====
Hand-picked precious-metals-related links:
PRECIOUS-Gold rises on wobbly dollar; stocks surge after U.S. govt shutdown ends
LBMA Considers Blockchain to Underpin Gold Bar Integrity
Gold Market Mulling Blockchain for $200 Billion of Supply
Tiberius to jump into cryptocurrencies with metals-backed digital coin
Exclusive: World Gold Council investigates standard for gold kilobars
=====
In other news:
U.S. funding deal keep stocks bulls on the charge
Why is the US stock market so high – and is it justified?
Fed nominee Goodfriend, fan of negative rates, could roil debate
Oil rises on IMF world growth outlook, OPEC-led supply curbs
Bitcoin May Split 50 Times in 2018 as Forking Craze Accelerates
=====
Thank you.
Sincerely,
Przemyslaw Radomski, CFA
Founder, Editor-in-chief, Gold & Silver Fund Manager
Gold & Silver Trading Alerts
Forex Trading Alerts
Oil Investment Updates
Oil Trading Alerts

