

Briefly: in our opinion, full (300% of the regular position size) speculative short positions in junior mining stocks are justified from the risk/reward point of view at the moment of publishing this Alert.
PLEASE NOTE:
Dear Subscribers,
As the Author will be traveling this week, upcoming Gold & Silver Trading Alerts will not include regular technical analysis. Instead, they will focus on the fundamental aspects. The next regular technical analysis will be published on Monday, August 29. PR will inform you about significant changes (which are unlikely).
Stay tuned!
With oil prices rallying on the hope of output cuts by OPEC+, the PMs benefited from the enthusiasm. For example, gold rose by 0.73%, silver by 0.78%, the GDX ETF by 1.70% and the GDXJ ETF by 2.08%. Moreover, profit-taking helped push the USD Index lower by 0.39%. However, long-term Treasury yields jumped, and with quantitative tightening (QT) set to double next week, the PMs’ optimism is unlikely to last.
The Bull/Bear Narratives
While the consensus assumes that peak inflation means the Fed is closer to the end of its tightening cycle than the beginning, I’ve warned on numerous occasions that normalizing the metric to 2% will result in much more economic pain than currently expected. Therefore, while the financial markets tread water in anticipation of Fed Chairman Jerome Powell’s Jackson Hole speech, the reality is that his words don’t change the medium-term ramifications.
For example, the bears are hoping that Powell will reaffirm his commitment to reducing inflation on Aug. 26, resulting in lower asset prices as the hawkish realities resurface. In contrast, the bulls hope that Powell will strike a dovish tone and help re-ignite the risk rally that pushed the S&P 500 above 4,300 and helped uplift gold, silver and mining stocks.
However, while sentiment moves markets in the short term, nothing that Powell says will change the deteriorating U.S. economic outlook. Furthermore, Powell was profoundly dovish during his post-FOMC press conference on Jul. 27, and other than looser financial conditions, little has changed fundamentally that signals a 180 in his communication.
As such, it’s prudent to look past the daily narratives and focus on the realities that manifest when the Fed attempts to rein in unanchored inflation.
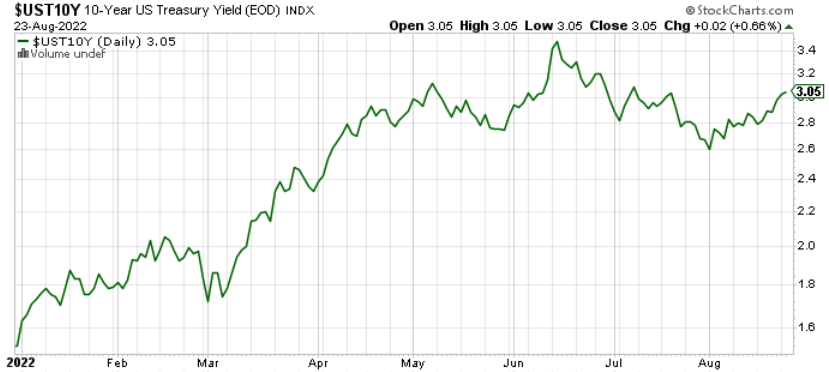
Speaking of which, the U.S. 10-Year Treasury yield closed above 3% on Aug. 23, and the recently elusive milestone helps the benchmark inch closer to its 2022 highs.
Please see below:
Furthermore, if you analyze the bottom right-hand corner of the chart below, you can see that the 10-2 spread has started to turn.
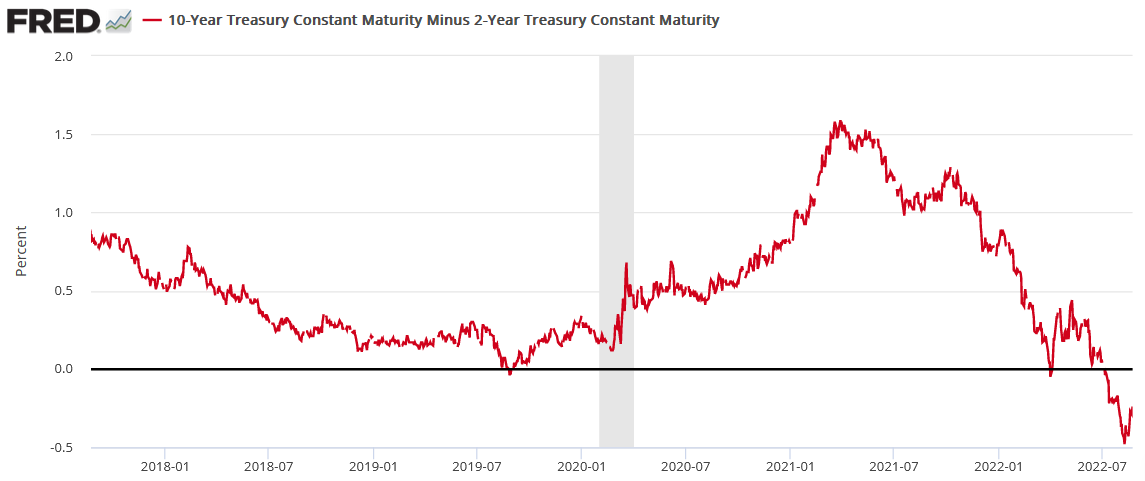
For context, the spread is calculated by subtracting the U.S. 2-Year Treasury yield from the U.S. 10-Year Treasury yield. In a nutshell: when the 2-year outperforms, the red line falls (flattening), and when the 10-year outperforms, the red line rises (steepening).
The media now highlights how a negative (inverted) 10-2 spread is the bond market’s way of signaling an impending recession. However, while this is true, the important point is that a negative 10-2 spread often steepens before recessions.
Please see below:
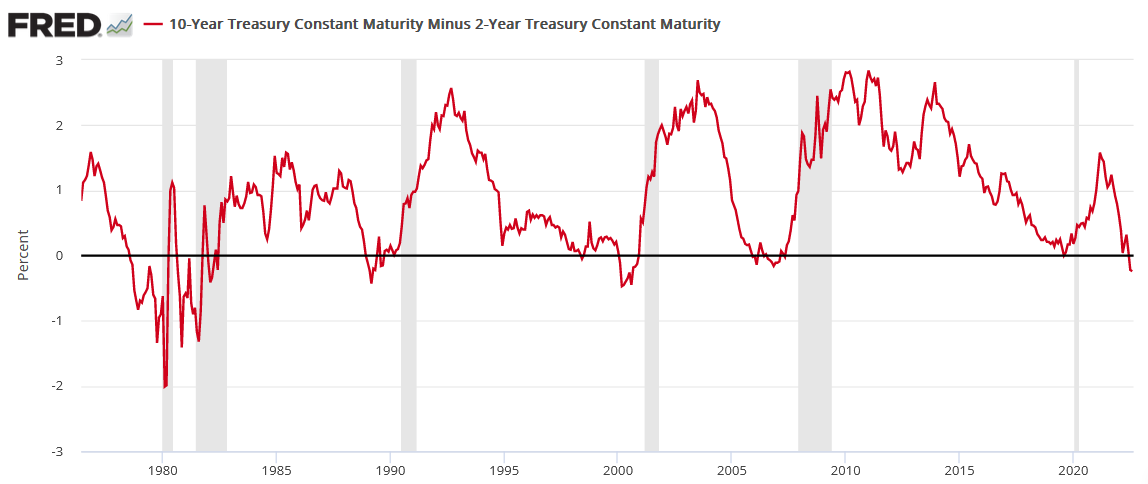
To explain, the early 1980s show a more mixed picture. However, the lead-up to the recessions in 1990, 2000 and 2010 (the vertical gray bars) shows how the 10-2 spread often steepens from a negative base before an economic climax unfolds. For context, the chart above uses monthly data, so the move on the right side doesn’t capture the small uptick shown on the daily chart that preceded it.
However, the fundamental implications are more relevant than what Powell says or doesn’t say on Aug. 26.
PMI Problems
S&P Global released its U.S. Composite PMI on Aug. 23. The headline index declined from 47.7 in July to 45.0 in August, marking the “second successive monthly decrease in total business activity.” Also, a reading below 50 signals that the U.S. manufacturing and service sectors are in contraction.
Please see below:
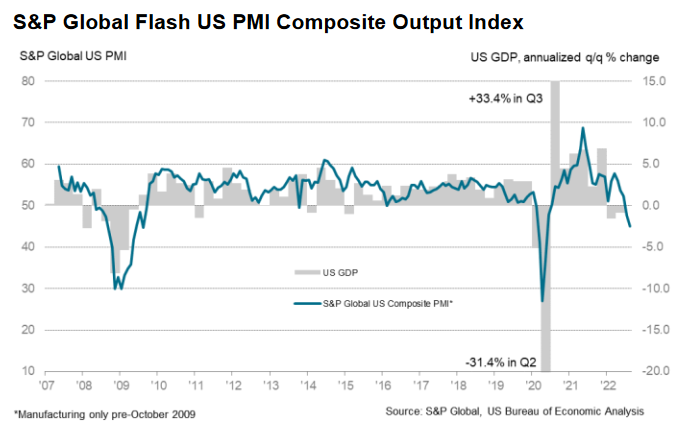
To explain, the blue line above tracks S&P Global’s U.S. Composite PMI, while the gray bars above track the annualized quarter-over-quarter (QoQ) percentage change in U.S. GDP. If you analyze the right side of the chart, you can see that the blue line has sunk to levels seen during the global financial crisis (GFC) and the COVID-19 crash.
Furthermore, the data shows how sharp declines in the blue line culminated with sharp declines in U.S. GDP in 2008 and 2020. As a result, while a small technical recession has already occurred, a continuation of the trend implies a broad-based slide in economic activity.
Conversely, while inflation and employment have softened, they’re still increasing as output falters. The report revealed:
“Weak client demand and lower new orders led firms to scale back their hiring efforts, as employment rose at the slowest pace in 2022 to date. Although some companies
continued to note challenges finding suitable replacements for voluntary leavers, a growing number of firms stated that uncertainty and rising costs led them to delay the immediate replacement of staff.”
In addition:
“In line with the trend for cost burdens, firms increased their selling prices at the softest pace in 18 months in August. The softer rise in output charges was linked to efforts to pass through any concessions to customers to encourage the placement of orders. That said, the rate of inflation was marked overall and faster than in any period before March 2021.”
Thus, while the picture is nowhere near perfect, the reality is that employment and inflation rose during the survey period from Aug. 5 to Aug. 27. As such, the results are bullish for Fed policy because the central bank’s dual mandate is maximum employment and price stability.
To that point, with the U.S. unemployment rate hitting a ~50-year low of 3.5% in July, further labor market strength is antithetical to the Fed’s 2022 projection of a 3.7% unemployment rate and its ability to reduce wage inflation.
Please see below:
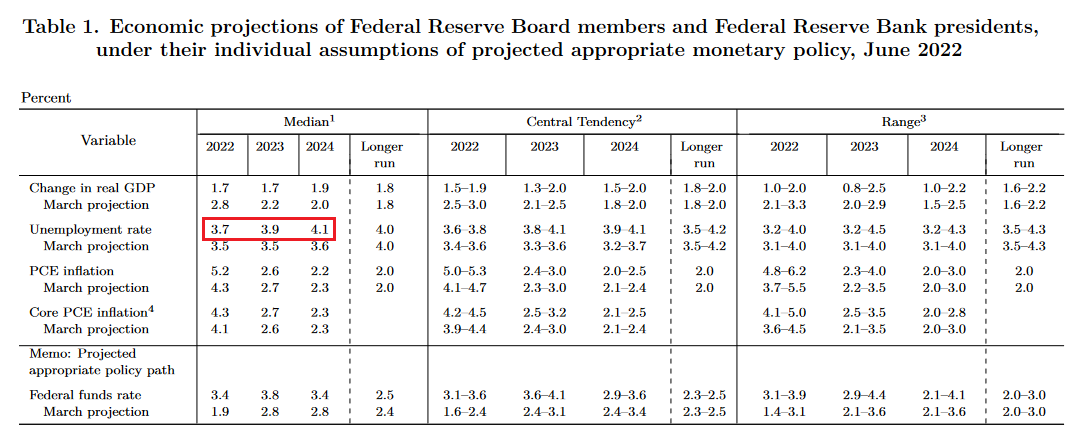 Source: U.S. Fed
Continuing the theme, the Richmond Fed released its Fifth District Survey of Manufacturing Activity on Aug. 23. Moreover, the headline index declined from 0 in July to -8 in August, as “the indexes for shipments and volume of new orders slid from 7 and −10 in July to −8 and −20 in August.”
Please see below:
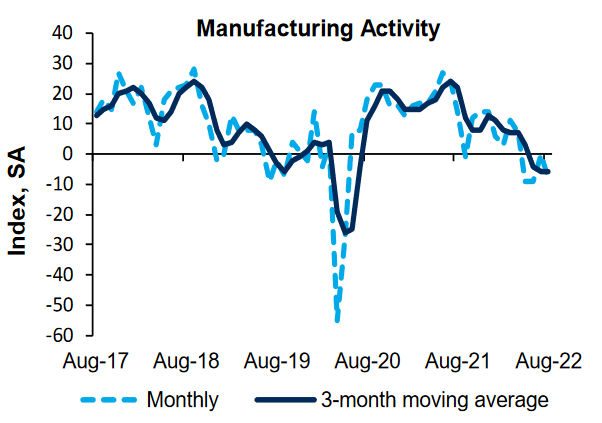
Source: Richmond Fed
In contrast, the Richmond Fed’s employment index increased from 8 in July to 11 in August. As a result, the U.S. labor market continues to showcase immense resiliency.
Please see below:
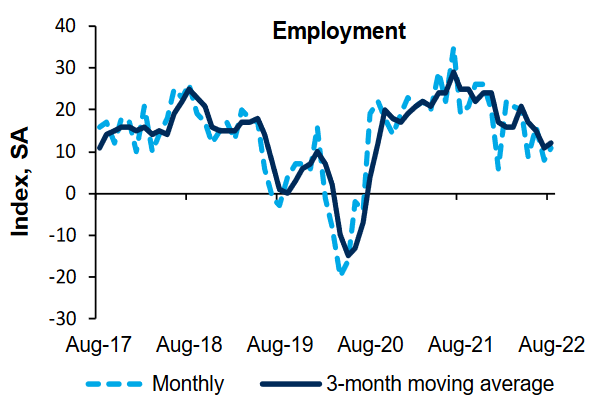 Source: Richmond Fed
In addition, the report revealed that “the average growth rate of prices paid was virtually flat in August, while the average growth rate of prices received increased somewhat.” Thus, it’s become a recurring theme that as output indices crater, employment and inflation remain highly elevated.
Please see below:
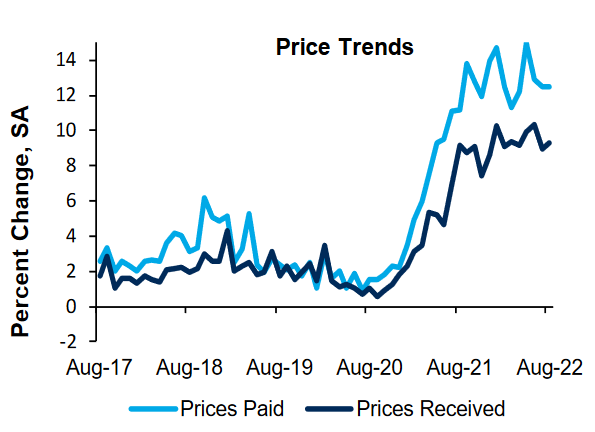 Source: Richmond Fed
Furthermore, the developments highlight the growth-inflation divergence that I’ve warned about for months. With the Fed slow-rolling toward tighter monetary policy, the central bank allowed inflation to fester while growth decelerated. Moreover, history shows that the longer inflation remains elevated, the more it pressures growth and further widens the gap. Therefore, the Fed needs to hammer inflation to avoid a 1970s-style malaise.
Likewise, while U.S. employment remains resilient for now, history reminds us that inflation upends growth first, then comes for the U.S. labor market. To explain, I wrote on Aug. 16:
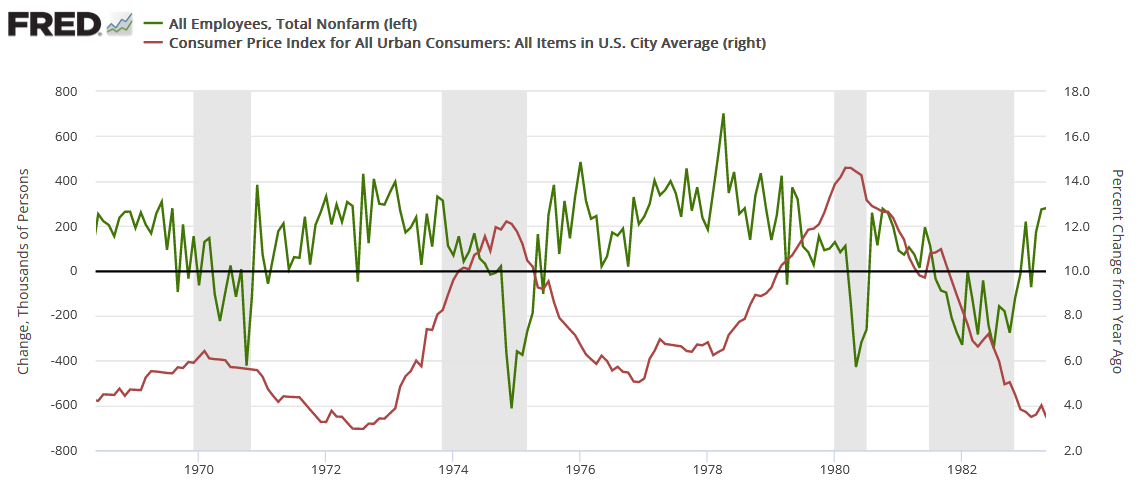
The red line above tracks the year-over-year (YoY) percentage change in the headline CPI, while the green line above tracks the monthly change in U.S. nonfarm payrolls. For context, the consensus cites near-record job openings and robust payrolls growth as evidence for why only a mild recession can occur (if one occurs at all).
However, the chart above highlights how unanchored inflation torpedoed that narrative in the 1970s. If you analyze the shaded gray areas (recessions), notice how the green line remained positive during the early stages of the recessions in 1970, 1974, and 1980? In a nutshell: monthly payrolls growth stayed positive during the outset of all three recessions.
However, if you focus your attention on the sharp drops in the green line near the end of the 1970, 1974, and 1980 recessions (negative monthly payrolls prints), you can see that reality re-emerged and the U.S. labor market suffered mightily. Moreover, negative payrolls growth was also present during the 1982 recession, but inflation was declining at that time.
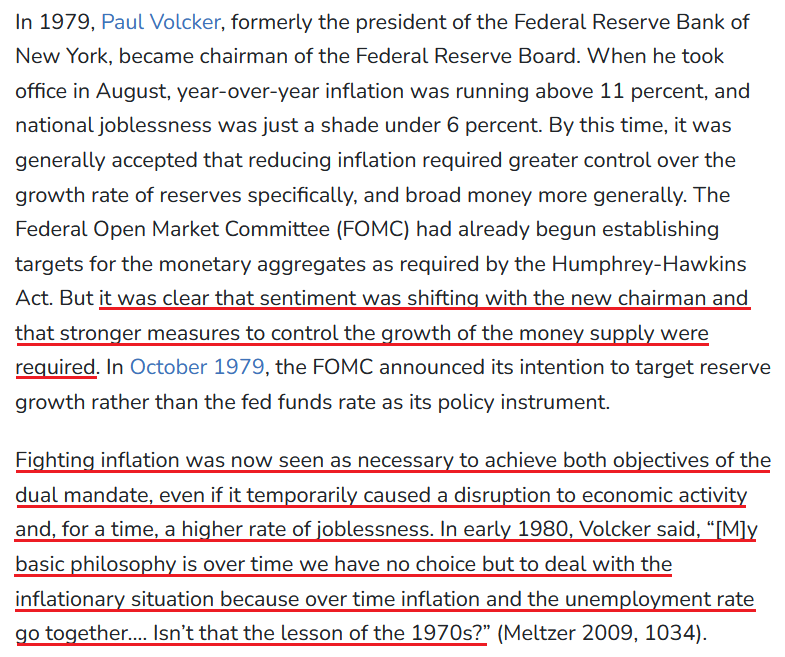
As further evidence, Paul Volcker’s inflation-fighting crusade was built on the notion that unanchored inflation would eventually derail the labor market. Thus, investors don’t realize that a patient Powell will only make a bad situation worse.
 Source: U.S. Fed
The Bottom Line
While the short-term fate of the S&P 500 and the PMs likely hinges on Powell’s rhetoric, it’s foolhardy to place too much emphasis on a largely immaterial speech. In reality, the deteriorating technical and fundamental backdrops confronting gold, silver, and mining stocks will be more impactful over the medium term. Therefore, while Powell’s message on Aug. 26 is anyone’s guess, the bearish realities that confront risk assets in the months ahead are crystal clear.
In conclusion, the PMs rallied on Aug. 23, as they benefited from the USD Index’s small pullback. However, the U.S. 10-Year real yield rose once again, and higher real yields and a stronger U.S. dollar should be on the horizon. As such, the PMs will likely head in the opposite direction as the drama unfolds.
Overview of the Upcoming Part of the Decline
- It seems to me that the corrective upswing is either over or about to be over, and that the next big move lower is about to start.
- If we see a situation where miners slide in a meaningful and volatile way while silver doesn’t (it just declines moderately), I plan to – once again – switch from short positions in miners to short positions in silver. At this time, it’s too early to say at what price levels this could take place and if we get this kind of opportunity at all – perhaps with gold prices close to $1,600.
- I plan to exit all remaining short positions once gold shows substantial strength relative to the USD Index while the latter is still rallying. This may be the case with gold prices close to $1,400. I expect silver to fall the hardest in the final part of the move. This moment (when gold performs very strongly against the rallying USD and miners are strong relative to gold after its substantial decline) is likely to be the best entry point for long-term investments, in my view. This can also happen with gold close to $1,400, but at the moment it’s too early to say with certainty.
- The above is based on the information available today, and it might change in the following days/weeks.
You will find my general overview of the outlook for gold on the chart below:
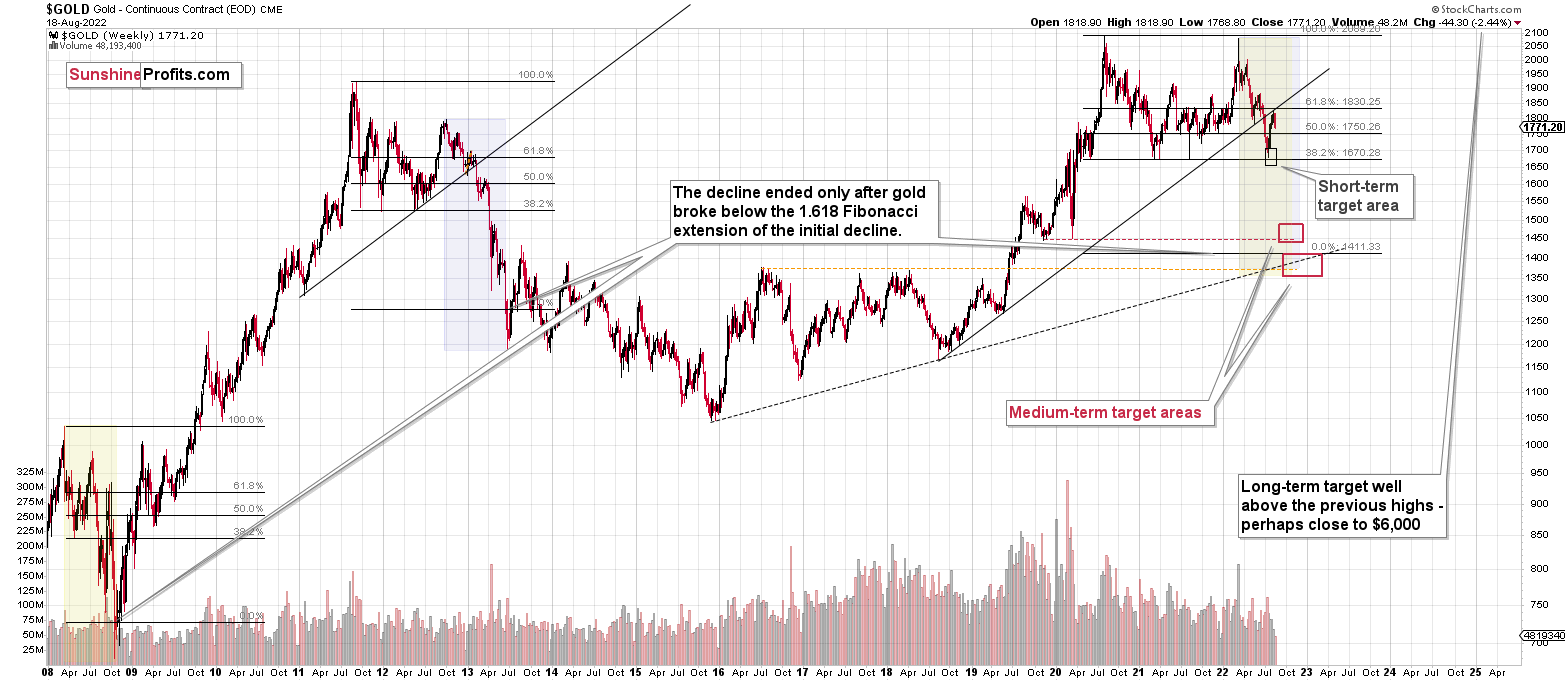
Please note that the above timing details are relatively broad and “for general overview only” – so that you know more or less what I think and how volatile I think the moves are likely to be – on an approximate basis. These time targets are not binding nor clear enough for me to think that they should be used for purchasing options, warrants, or similar instruments.
Summary
Summing up, it seems that the corrective upswing is over (or close to being over), which means that the powerful medium-term downtrend can now resume.
Two weeks ago, we closed yet another profitable trade in a row. This year’s profits are already enormous, but it seems likely to me that they will grow even more in the following weeks and months. In particular, I expect the profits on the current short positions to be really profound.
After the final sell-off (that takes gold to about $1,350-$1,500), I expect the precious metals to rally significantly. The final part of the decline might take as little as 1-5 weeks, so it's important to stay alert to any changes.
As always, we'll keep you – our subscribers – informed.
To summarize:
Trading capital (supplementary part of the portfolio; our opinion): Full speculative short positions (300% of the full position) in junior mining stocks are justified from the risk to reward point of view with the following binding exit profit-take price levels:
Mining stocks (price levels for the GDXJ ETF): binding profit-take exit price: $20.32; stop-loss: none (the volatility is too big to justify a stop-loss order in case of this particular trade)
Alternatively, if one seeks leverage, we’re providing the binding profit-take levels for the JDST (2x leveraged). The binding profit-take level for the JDST: $29.87; stop-loss for the JDST: none (the volatility is too big to justify a SL order in case of this particular trade).
For-your-information targets (our opinion; we continue to think that mining stocks are the preferred way of taking advantage of the upcoming price move, but if for whatever reason one wants / has to use silver or gold for this trade, we are providing the details anyway.):
Silver futures downside profit-take exit price: $12.32
SLV profit-take exit price: $11.32
ZSL profit-take exit price: $79.87
Gold futures downside profit-take exit price: $1,504
HGD.TO – alternative (Canadian) 2x inverse leveraged gold stocks ETF – the upside profit-take exit price: $19.87
HZD.TO – alternative (Canadian) 2x inverse leveraged silver ETF – the upside profit-take exit price: $49.87
Long-term capital (core part of the portfolio; our opinion): No positions (in other words: cash)
Insurance capital (core part of the portfolio; our opinion): Full position
Whether you’ve already subscribed or not, we encourage you to find out how to make the most of our alerts and read our replies to the most common alert-and-gold-trading-related-questions.
Please note that we describe the situation for the day that the alert is posted in the trading section. In other words, if we are writing about a speculative position, it means that it is up-to-date on the day it was posted. We are also featuring the initial target prices to decide whether keeping a position on a given day is in tune with your approach (some moves are too small for medium-term traders, and some might appear too big for day-traders).
Additionally, you might want to read why our stop-loss orders are usually relatively far from the current price.
Please note that a full position doesn't mean using all of the capital for a given trade. You will find details on our thoughts on gold portfolio structuring in the Key Insights section on our website.
As a reminder - "initial target price" means exactly that - an "initial" one. It's not a price level at which we suggest closing positions. If this becomes the case (as it did in the previous trade), we will refer to these levels as levels of exit orders (exactly as we've done previously). Stop-loss levels, however, are naturally not "initial", but something that, in our opinion, might be entered as an order.
Since it is impossible to synchronize target prices and stop-loss levels for all the ETFs and ETNs with the main markets that we provide these levels for (gold, silver and mining stocks - the GDX ETF), the stop-loss levels and target prices for other ETNs and ETF (among other: UGL, GLL, AGQ, ZSL, NUGT, DUST, JNUG, JDST) are provided as supplementary, and not as "final". This means that if a stop-loss or a target level is reached for any of the "additional instruments" (GLL for instance), but not for the "main instrument" (gold in this case), we will view positions in both gold and GLL as still open and the stop-loss for GLL would have to be moved lower. On the other hand, if gold moves to a stop-loss level but GLL doesn't, then we will view both positions (in gold and GLL) as closed. In other words, since it's not possible to be 100% certain that each related instrument moves to a given level when the underlying instrument does, we can't provide levels that would be binding. The levels that we do provide are our best estimate of the levels that will correspond to the levels in the underlying assets, but it will be the underlying assets that one will need to focus on regarding the signs pointing to closing a given position or keeping it open. We might adjust the levels in the "additional instruments" without adjusting the levels in the "main instruments", which will simply mean that we have improved our estimation of these levels, not that we changed our outlook on the markets. We are already working on a tool that would update these levels daily for the most popular ETFs, ETNs and individual mining stocks.
Our preferred ways to invest in and to trade gold along with the reasoning can be found in the how to buy gold section. Furthermore, our preferred ETFs and ETNs can be found in our Gold & Silver ETF Ranking.
As a reminder, Gold & Silver Trading Alerts are posted before or on each trading day (we usually post them before the opening bell, but we don't promise doing that each day). If there's anything urgent, we will send you an additional small alert before posting the main one.
Thank you.
Przemyslaw Radomski, CFA
Founder, Editor-in-chief

