

Briefly: in our opinion, full (300% of the regular position size) speculative short positions in junior mining stocks are justified from the risk/reward point of view at the moment of publishing this Alert.
The precious metals sector moved higher yesterday, but overall it was most likely just a blip on the radar screen and it didn’t change anything – the downtrend remains intact.
For more details, I invite you to watch today’s analysis below – today, it took a video format.
Having said that, let’s take a look at the markets from a more fundamental point of view.
Squeezing Optimism
With depressed sentiment and over-positioning helping to fuel another daily short squeeze, gold, silver, mining stocks and the S&P 500 rallied sharply on Oct. 17. However, with too many investors increasing their bearish bets in recent days, the price action is much less bullish than it seems.
To explain, Goldman Sachs flow trader John Flood told clients on Oct. 14:
“The overall Prime book saw the largest notional net selling in 4 months (-2.1 SDs), driven by short sales outpacing long buys nearly 5 to 1; this week’s notional short sales ranks in the 94th percentile vs. the past year.”
Thus, with hedge funds ramping up their short bets to one of the largest magnitudes seen in the last 12 months, a small bout of optimism can lead to a violent unwind. Therefore, the positivity was merely another iteration of the bear market squeezes we’ve witnessed throughout 2022.
To that point, it wasn’t just hedge funds pressing their shorts; retail traders also went all in on crash protection last week.
Please see below:
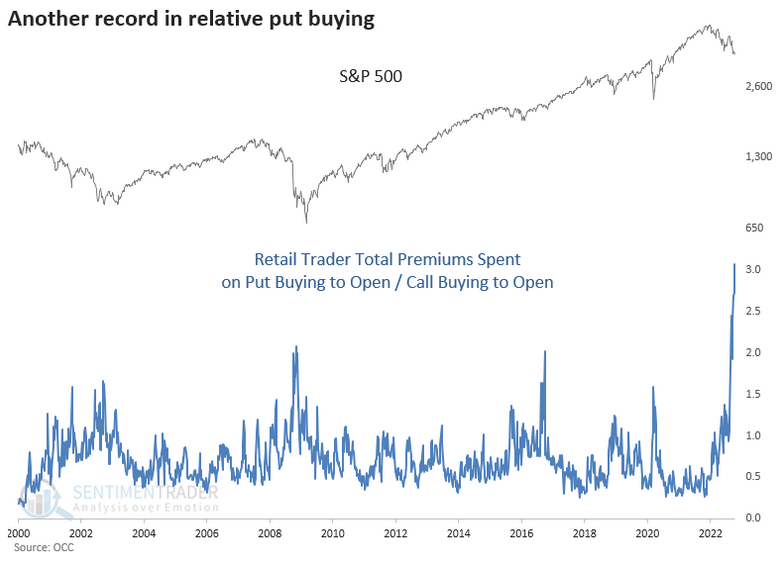
To explain, the gray line at the top of the chart above tracks the S&P 500, while the blue line at the bottom tracks the ratio of retail investors’ put option purchases versus call options. For context, put options profit when the S&P 500 falls, while call options profit when the S&P 500 rises.
Furthermore, with retail investors purchasing $19.9 billion in put options and $6.5 billion in call options, the notional put/call ratio of ~3 was the highest in more than 20 years. As such, the crowd was increasingly bearish, and one-sided positioning can help ignite countertrend rallies.
However, please remember that unwinding bearish bets is much different than investors opening bullish bets. So while the crowd liquidated to avoid further losses, prior 2022 squeezes showed that these moves could only uplift risk assets for a short period. In contrast, a material rally requires long-only investors to join the fray, and with the medium-term technicals and fundamentals still profoundly bearish, anything more than a short-term recalibration remains unlikely.
More Fuel for the Fed
While I warned throughout 2021 that demand-driven inflation would force the Fed’s hand, the supply-side enthusiasts assumed the pricing pressures would naturally abate. However, while unanchored inflation has proved problematic and the Fed has embarked on a hawkish warpath, the underlying issues still exist. To explain, I wrote on Dec. 23, 2021:
Anxiety has increased with U.S. monetary and fiscal spending stuck in reverse/neutral. For example, the Fed is tightening monetary policy and Americans are no longer receiving stimulus checks and enhanced unemployment benefits. Moreover, U.S. President Joe Biden’s $1.75 trillion stimulus package was torpedoed by Senator Joe Manchin. As a result, who knows if it will pass in 2022?
However, while “the Fed is trapped” crew cites these issues as reasons for an economic calamity, they often miss the forest through the trees. For example, while the fiscal spending spree may end, U.S. households are still flush with cash.
Please see below:
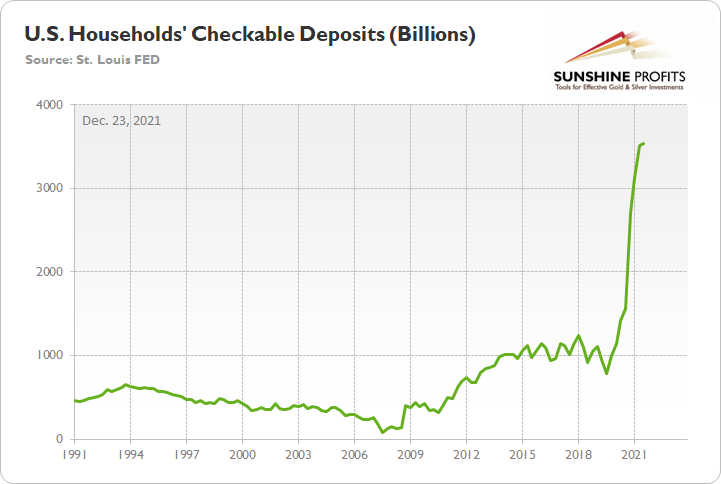
To explain, the green line above tracks U.S. households’ checkable deposits (data released on Dec. 9). In a nutshell: it’s the amount of money that U.S. households have in their checking accounts and/or demand deposit accounts.
If you analyze the vertical ascent on the right side of the chart, you can see that U.S. households have nearly $3.54 trillion in their checking accounts. For context, this is 253% more than Q4 2019 (pre-COVID-19).
Furthermore, with the metric even higher now than it was then, Americans still have plenty of spending firepower. Bank of America – the second largest bank in the U.S. – released its third-quarter earnings on Oct. 17. CEO Brian Moynihan said during the Q3 conference call:
“A perspicacious analyst might wonder whether talk of inflation, recession and other factors would fructify in a slower spending growth. We just don't see here at Bank of America. Year-to-date (YTD) spending of $3.1 trillion through September is up 12% compared to last year.
“And while still strong in September at 10%, spending growth has slowed just a bit from the 12% YTD pace, which shows you that early in the year was a faster YoY growth rate, but still strong; and the first two weeks of October show that strength is still growing at 10%.”
He added:
“It’s notable that it isn't just inflation that is driving spending as transactions are up single digits YoY pretty consistently (…).”
“Average deposit balances of our consumer customer remained at high levels relative to a year ago. These balances are still multiples of the pre-pandemic periods, and they were largely unchanged at these elevated amounts for the month of September. These deposit levels suggest continued capacity to strengthen.”
As a result, while I warned nearly 10 months ago that U.S. households were flush with cash, their ability and willingness to spend should keep inflation elevated, which is highly bullish for the U.S. federal funds rate (FFR), real yields, and the USD Index.
Please see below:
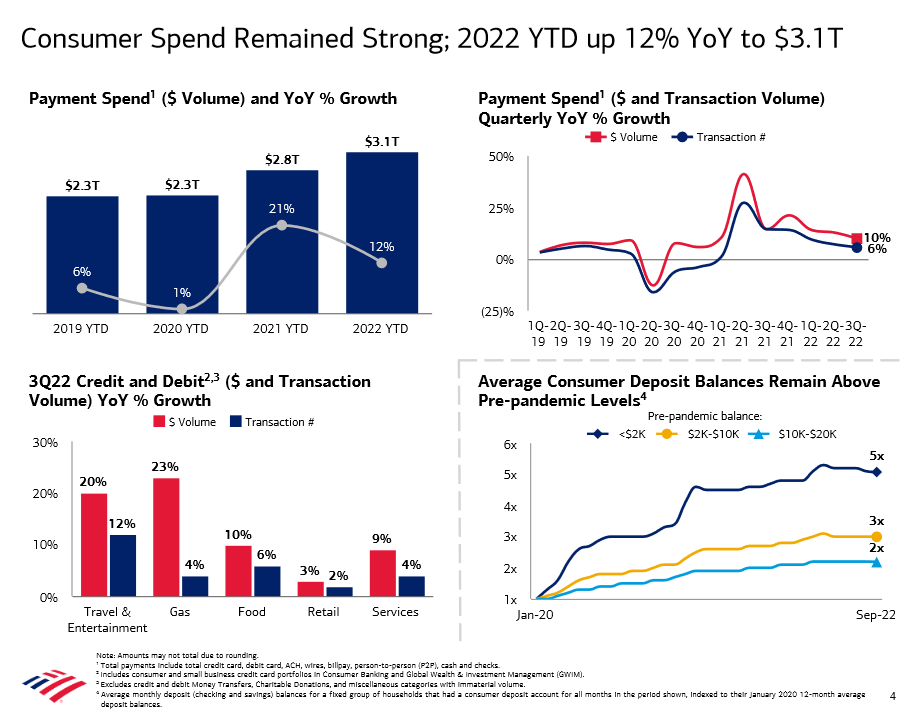
To explain, the visual above is from Bank of America’s earnings presentation. If you analyze the blue bars at the top left, you can see that YTD consumer spending is up by 12%. Moreover, while the figure is less than the 21% realized in 2021, it’s still materially above the 1% and 6% recorded in 2020 and 2019. So, despite the Fed’s 12 25 basis point rate hikes in 2022, Americans are spending more than they did pre-pandemic.
In addition, the dark blue, gold, and light blue lines on the chart at the bottom right are also critical. Supporting the data I presented in December 2021, the dark blue line highlights how Americans that had less than $2,000 in their bank accounts pre-pandemic have 5x that amount now. Likewise, those that had $2,000 to $10,000 have 3x, while those that had $10,000 to $20,000 have 2x. Thus, U.S. consumers are in a healthy position.
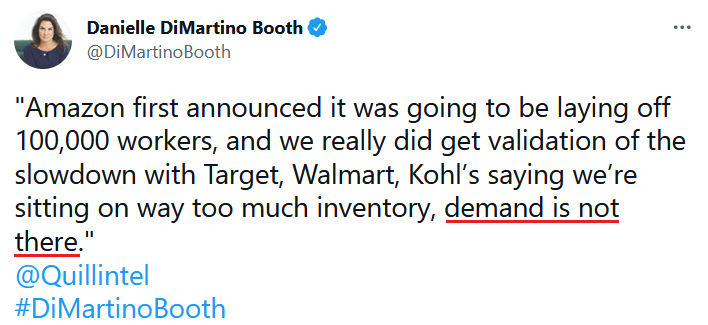
As further evidence, Target CEO Brian Cornell – who heads the seventh largest retailer in the U.S. – said on Oct. 17 that “healthy” consumer spending remains evident.
Please see below:
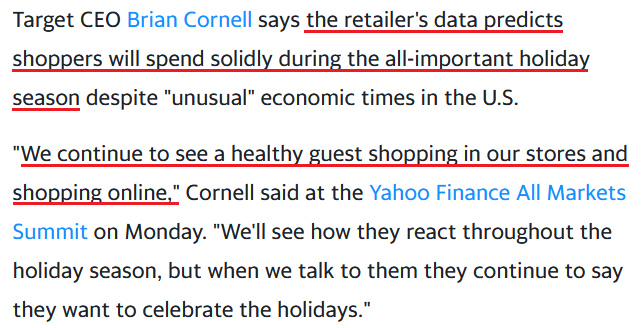 Source: Yahoo Finance
Also, while The Boy Who Cried Wolf metaphor applies to both the permabears and the permabulls, I warned on May 23 that following either is the quickest way to the poor house. I wrote:
With the new narrative on Wall Street proclaiming that a destitute U.S. consumer is all tapped out and a recession looms, investors have succumbed to the same pitfalls that led them astray in 2021.
Please see below:
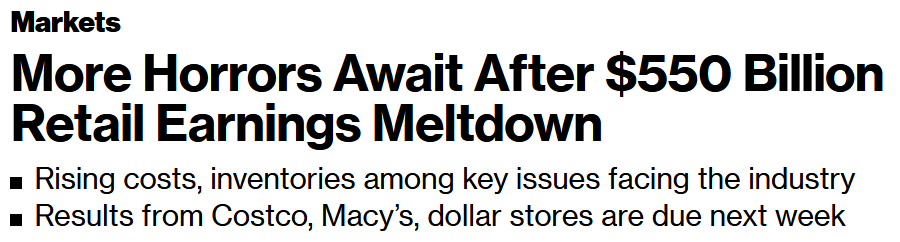
Likewise, Bloomberg published an article on May 21 that stated:
“The retailers now find themselves flush with clothes, televisions and other discretionary items that customers aren’t buying as they channel more spending into basic needs and services. As a result, the companies took markdowns that eroded profits.”
Please see below:
 Source: Bloomberg
Again, please remember that I don’t have a horse in this race. I expect the U.S. to fall into a recession as the prospect of a “soft landing” is highly unrealistic. However, the recession should come as the Fed’s rate hike cycle intensifies, not now.
Moreover, those that cry wolf until one finally arises lack objectivity, and therefore, stray investors in the wrong directions. Thus, the bond bulls that saluted “transitory” died a slow death in 2021/2022, and the investors that cried wolf about a recession for the last two years are louder than ever. However, objective analysis suggests otherwise.
So while that was roughly five months ago, Americans continue to spend, and the Fed’s rate hike cycle has continued uninterrupted. As such, it’s important to focus on the data to avoid falling victim to perma-narratives.
In addition, while the GDXJ ETFs rally on Oct. 17 was not ideal, the reality is that recent data only strengthens the Fed's case for more hawkish policy; and while demand destruction has not materialized yet, a recession is likely needed to slow wage inflation and normalize the Consumer Price Index (CPI). Furthermore, every inflation fight since 1954 has ended with a recession, so this cycle should include a similar ending.
However, narratives don't create recessions, and the important point is that the longer consumer spending remains elevated, the higher the FFR will need to rise; and while investor sentiment was boosted by short-covering and resilient corporate earnings, the latter's strength is bearish because it means the Fed has much more work to do.
The Bottom Line
With too many bulls turning into bears, the unwinding of their short bets helped fuel risk assets on Oct. 17; and as usual, the USD Index and the U.S. 10-Year real yield declined, which often happens during risk-on days. However, the moves were driven by sentiment and not medium-term technicals or fundamentals, so the optimism should fizzle like all the other bear market rallies in 2022. Thus, while the positivity may persist in the short term, the medium-term implications remain unchanged.
In conclusion, the PMs rallied on Oct. 17, as risk assets caught a bid. However, the GDXJ ETF and the S&P 500 are still down substantially in 2022, and the dip buyers have paid a hefty price for their misguided optimism. As a result, this time should be no different.
Overview of the Upcoming Part of the Decline
- It seems to me that the corrective upswing is over, and that the next big move lower is already underway.
- If we see a situation where miners slide in a meaningful and volatile way while silver doesn’t (it just declines moderately), I plan to – once again – switch from short positions in miners to short positions in silver. At this time, it’s too early to say at what price levels this could take place and if we get this kind of opportunity at all – perhaps with gold prices close to $1,600.
- I plan to switch from the short positions in junior mining stocks or silver (whichever I’ll have at that moment) to long positions in junior mining stocks when gold / mining stocks move to their 2020 lows (approximately). While I’m probably not going to write about it at this stage yet, this is when some investors might consider getting back in with their long-term investing capital (or perhaps 1/3 or 1/2 thereof).
- I plan to return to short positions in junior mining stocks after a rebound – and the rebound could take gold from about $1,450 to about $1,550, and it could take the GDXJ from about $20 to about $24.
- I plan to exit all remaining short positions once gold shows substantial strength relative to the USD Index while the latter is still rallying. This may be the case with gold prices close to $1,400 and GDXJ close to $15 . This moment (when gold performs very strongly against the rallying USD and miners are strong relative to gold after its substantial decline) is likely to be the best entry point for long-term investments, in my view. This can also happen with gold close to $1,400, but at the moment it’s too early to say with certainty.
- The above is based on the information available today, and it might change in the following days/weeks.
You will find my general overview of the outlook for gold on the chart below:
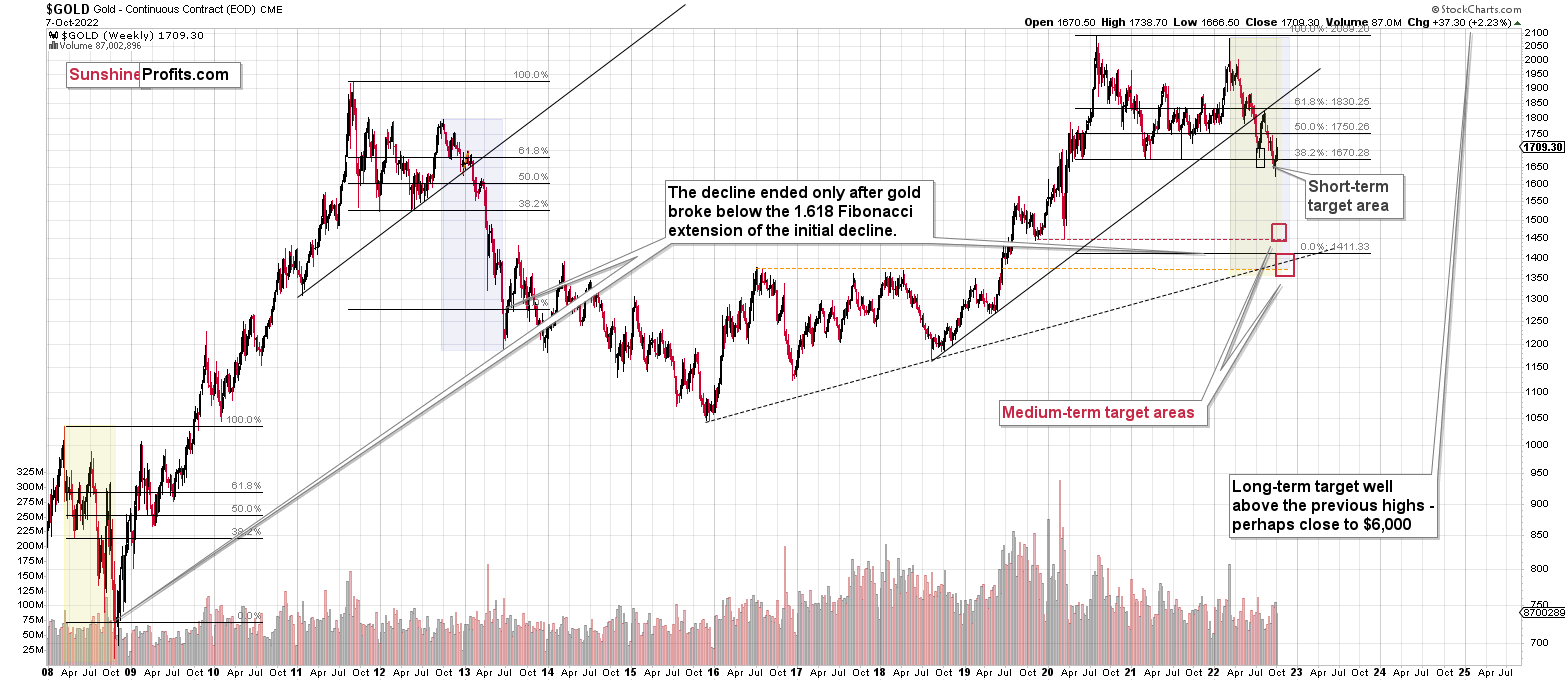
Please note that the above timing details are relatively broad and “for general overview only” – so that you know more or less what I think and how volatile I think the moves are likely to be – on an approximate basis. These time targets are not binding nor clear enough for me to think that they should be used for purchasing options, warrants, or similar instruments.
Letters to the Editor
Q: I believe in your historical look back in time for trading similarities. I also look back and have compared the 1920’s and ’39 to the current Federal Reserve actions. The Fed pumped billions into the economy during WWI, and the money supply was rolled over into the 1920’s and ’39. The 1929 Wall Street crash and then the depression were no accident. The same massive money supply increase since COVID should cause similar depression effects in the economy (hope not).
The current stock market decline is no surprise. My question is, in your opinion, will today's markets repeat/rhyme the 1929 crash?
Your thoughts?
A: In my view, that’s quite likely. I’d put emphasis on “rhyme” instead of putting it on “repeat”, as it’s about 100 years later, we have new kinds of investors (algorithmic trading + markets are much more globalized now), so the overall shape of the moves might be different, or more sharp / less sharp. Another thing that’s different now is the risk of cryptocurrencies and overall technical advancements, which shorten product cycles.
Consequently, it’s very difficult to predict exactly what’s going to happen, but in my view, it’s not going to be pleasant for the average investor.
In the long run, I see turmoil ahead, and during those times, precious metals tend to shine. Will cryptos shine, too? I have serious doubts because it’s too easy for governments and monetary authorities to step in with their own “official” crypto. They are extremely unlikely to just “give up” on money control.
Q: In your lifetime, is the coming bet on the markets the biggest opportunity you’ve ever encountered in your life? Or will there always be other bets we can hedge in order to produce income?
A: Great question.
I’ll reply with a picture that I saw some time ago on the Internet and I saved it for future reference.
I’d put “coming bet on the markets” between “stocks” and “learning” on the below chart.
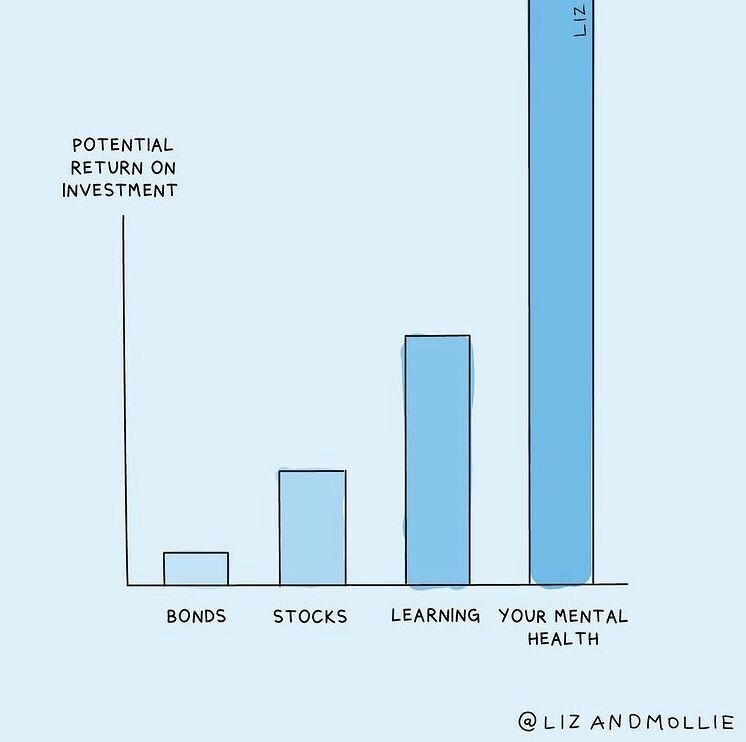
If I was to narrow my reply to the markets and investments only, then I do think that what we’re experiencing right now (the decline) and the upcoming rebound are probably two of the best opportunities that I’ve encountered in my life – so far.
The emphasis here goes on “so far”. There will be more opportunities in the future as well. However, I don’t see any similarly good opportunities right now. This doesn’t mean that they don’t exist. Conversely, I’m sure they do, but as my time / focus are finite, I won’t be able to explore most sectors out there, nor will I attempt to do so.
If I stumble upon something superb in the future, I’ll let my subscribers know. However, what seems even more likely is that I’ll invite other professionals to this platform that can provide expertise in markets / approaches that I’m not covering. Stay tuned.
Also, since we’re speaking of other authors, I would like to ask you a favor (you, the person reading this). Could you please let me know what authors/analysts outside of Sunshine Profits do you think highly of? I don’t mean just the gold and silver markets, but also in stocks, commodities, forex, and other markets. Another way of asking this question would be – with whom do you think it would be good to collaborate? Please let me know – I’d be very grateful.
Summary
Summing up, it seems that the biggest part of the 2013-like decline is taking place right now, and – while I can’t make any promises regarding performance - it seems likely to me that our big profits are about to become huge, and then ridiculously big in the relatively near future.
As far as this quick corrective upswing is concerned, it seems that it might already be over.
The current quick upswing most likely doesn’t change anything. Fundamentals and technicals continue to point to lower precious metals values in the coming weeks / months. The current geopolitical news-based rally is likely to serve as nothing more than just a verification of the breakdown below the previous lows in gold.
Things might happen very fast in the coming days, and if I plan to make any adjustments, I’ll keep you informed. Still, if the targets that I’m mentioning in the “Trading” part of the summary are reached, I think that profits should be taken off the table without an additional confirmation from me. I will probably get on the long side of the market at that time, but I’ll send a confirmation if I decide to do so.
After the final sell-off (that takes gold to about $1,350-$1,500), I expect the precious metals to rally significantly. The final part of the decline might take as little as 1-5 weeks, so it's important to stay alert to any changes.
As always, we'll keep you – our subscribers – informed.
To summarize:
Trading capital (supplementary part of the portfolio; our opinion): Full speculative short positions (300% of the full position) in junior mining stocks are justified from the risk to reward point of view with the following binding exit profit-take price levels:
Mining stocks (price levels for the GDXJ ETF): binding profit-take exit price: $20.32; stop-loss: none (the volatility is too big to justify a stop-loss order in case of this particular trade)
Alternatively, if one seeks leverage, we’re providing the binding profit-take levels for the JDST (2x leveraged). The binding profit-take level for the JDST: $27.87; stop-loss for the JDST: none (the volatility is too big to justify a SL order in case of this particular trade).
For-your-information targets (our opinion; we continue to think that mining stocks are the preferred way of taking advantage of the upcoming price move, but if for whatever reason one wants / has to use silver or gold for this trade, we are providing the details anyway.):
Silver futures downside profit-take exit price: $12.32
SLV profit-take exit price: $11.32
ZSL profit-take exit price: $74.87
Gold futures downside profit-take exit price: $1,504
HGD.TO – alternative (Canadian) 2x inverse leveraged gold stocks ETF – the upside profit-take exit price: $18.47
HZD.TO – alternative (Canadian) 2x inverse leveraged silver ETF – the upside profit-take exit price: $46.87
Long-term capital (core part of the portfolio; our opinion): No positions (in other words: cash)
Insurance capital (core part of the portfolio; our opinion): Full position
Whether you’ve already subscribed or not, we encourage you to find out how to make the most of our alerts and read our replies to the most common alert-and-gold-trading-related-questions.
Please note that we describe the situation for the day that the alert is posted in the trading section. In other words, if we are writing about a speculative position, it means that it is up-to-date on the day it was posted. We are also featuring the initial target prices to decide whether keeping a position on a given day is in tune with your approach (some moves are too small for medium-term traders, and some might appear too big for day-traders).
Additionally, you might want to read why our stop-loss orders are usually relatively far from the current price.
Please note that a full position doesn't mean using all of the capital for a given trade. You will find details on our thoughts on gold portfolio structuring in the Key Insights section on our website.
As a reminder - "initial target price" means exactly that - an "initial" one. It's not a price level at which we suggest closing positions. If this becomes the case (as it did in the previous trade), we will refer to these levels as levels of exit orders (exactly as we've done previously). Stop-loss levels, however, are naturally not "initial", but something that, in our opinion, might be entered as an order.
Since it is impossible to synchronize target prices and stop-loss levels for all the ETFs and ETNs with the main markets that we provide these levels for (gold, silver and mining stocks - the GDX ETF), the stop-loss levels and target prices for other ETNs and ETF (among other: UGL, GLL, AGQ, ZSL, NUGT, DUST, JNUG, JDST) are provided as supplementary, and not as "final". This means that if a stop-loss or a target level is reached for any of the "additional instruments" (GLL for instance), but not for the "main instrument" (gold in this case), we will view positions in both gold and GLL as still open and the stop-loss for GLL would have to be moved lower. On the other hand, if gold moves to a stop-loss level but GLL doesn't, then we will view both positions (in gold and GLL) as closed. In other words, since it's not possible to be 100% certain that each related instrument moves to a given level when the underlying instrument does, we can't provide levels that would be binding. The levels that we do provide are our best estimate of the levels that will correspond to the levels in the underlying assets, but it will be the underlying assets that one will need to focus on regarding the signs pointing to closing a given position or keeping it open. We might adjust the levels in the "additional instruments" without adjusting the levels in the "main instruments", which will simply mean that we have improved our estimation of these levels, not that we changed our outlook on the markets. We are already working on a tool that would update these levels daily for the most popular ETFs, ETNs and individual mining stocks.
Our preferred ways to invest in and to trade gold along with the reasoning can be found in the how to buy gold section. Furthermore, our preferred ETFs and ETNs can be found in our Gold & Silver ETF Ranking.
As a reminder, Gold & Silver Trading Alerts are posted before or on each trading day (we usually post them before the opening bell, but we don't promise doing that each day). If there's anything urgent, we will send you an additional small alert before posting the main one.
Thank you.
Przemyslaw K. Radomski, CFA
Founder, Editor-in-chief

