

Briefly: In our opinion, full (200% of the regular size of the position) speculative short positions in gold, silver and mining stocks is justified from the risk/reward perspective at the moment of publishing this alert.
Gold, silver and mining stocks have been moving back and forth in the past few days and the overall volatility declined significantly. This may be viewed as an indication that the big price moves are nowhere close and that it’s pointless to be watching this market at all. The reality is exactly the opposite.
The periods of low volatility are something that often precedes the big moves and the chart below provides the details (chart courtesy of http://stockcharts.com).
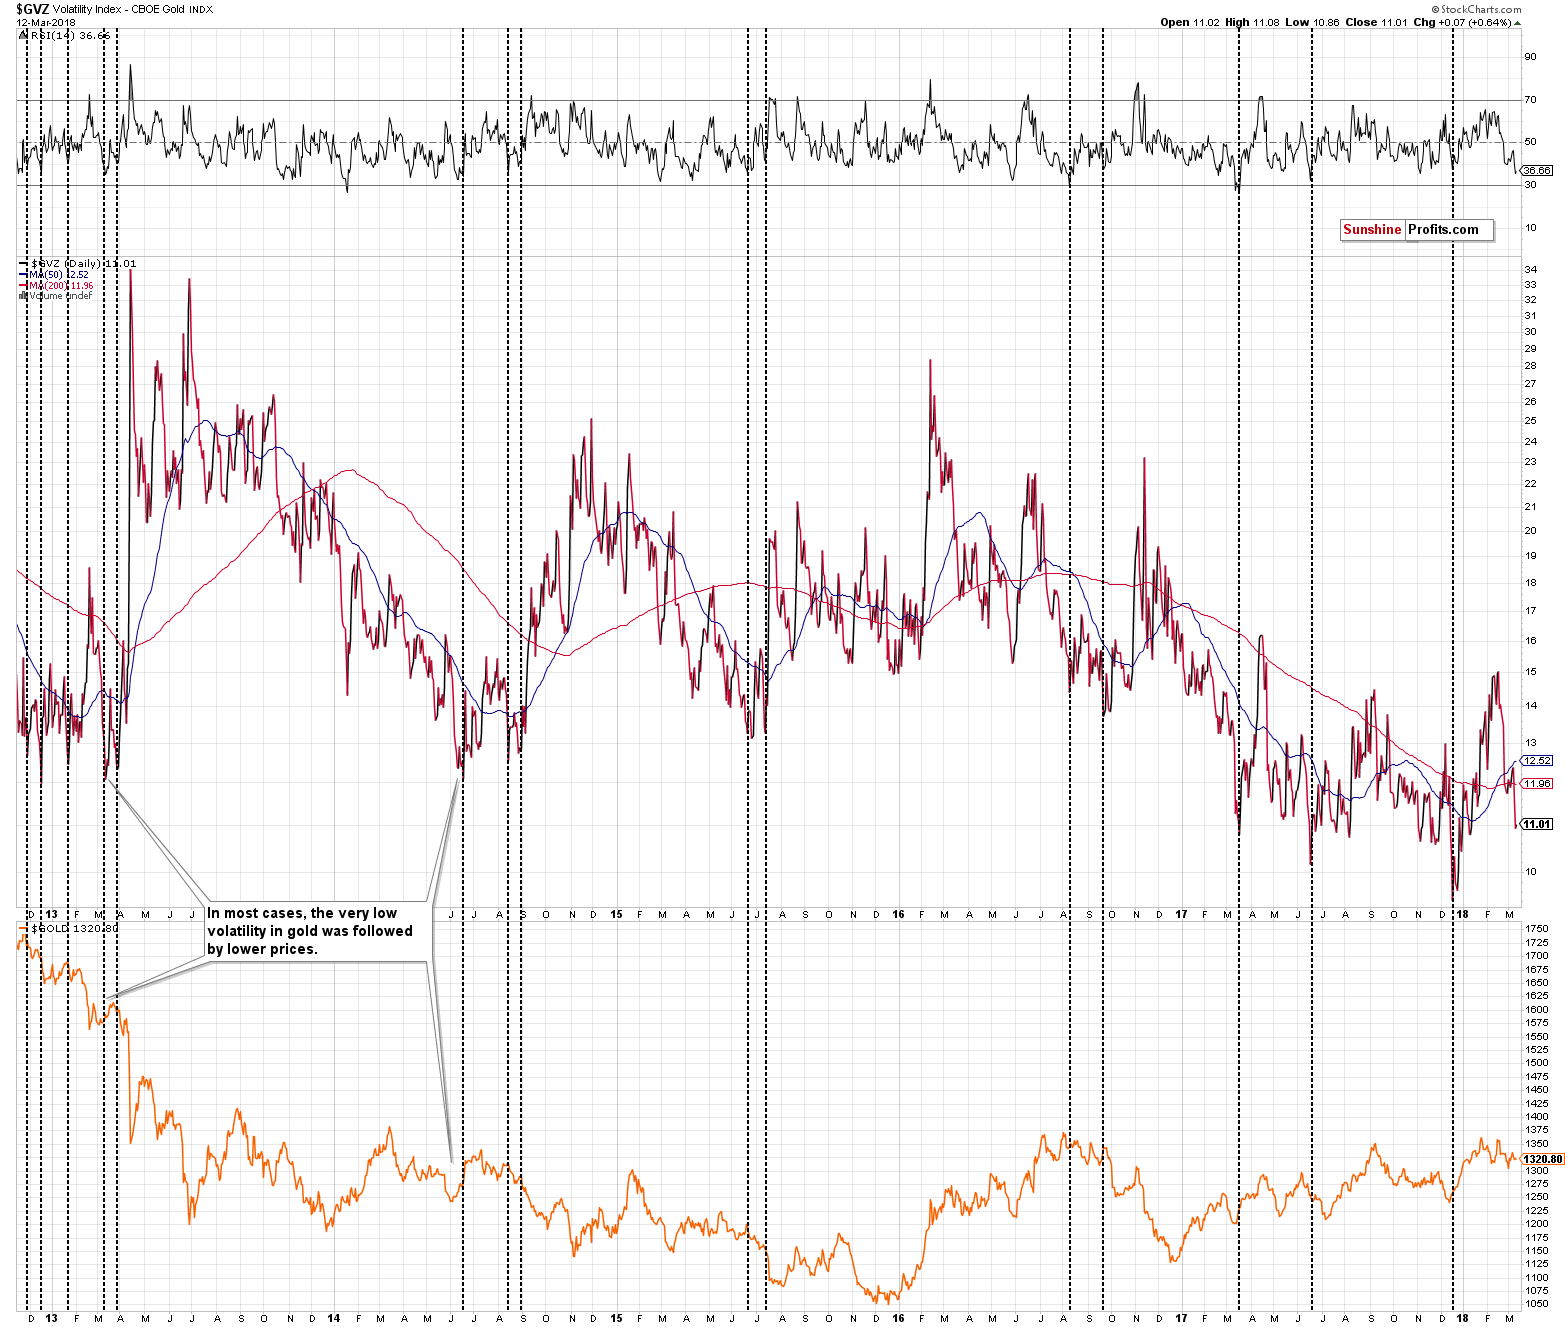
It wasn’t the case in early 2017 and late 2017, but in most cases, the implications of low volatility also meant that a bigger decline was about to follow. This is definitely not the time when one wants to give up on this market, thinking that nothing happens in it.
There are at least two very good reasons to view the recent lack of volatility as something profoundly bearish.
The gold stocks to gold ratio and the gold stocks to the general stock market ratio.
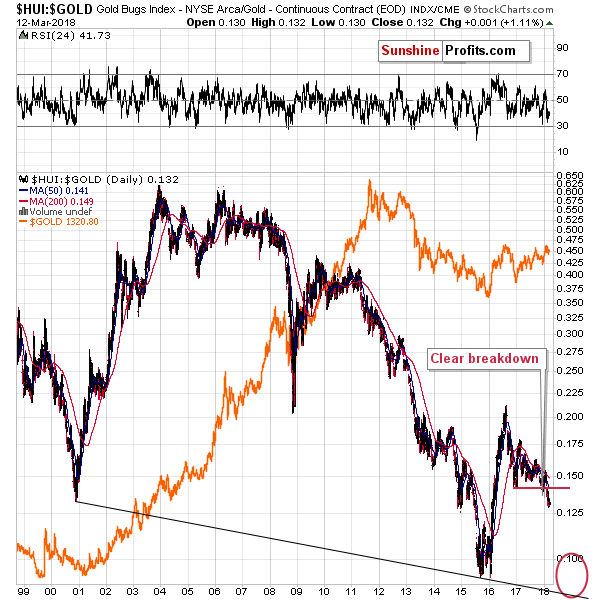
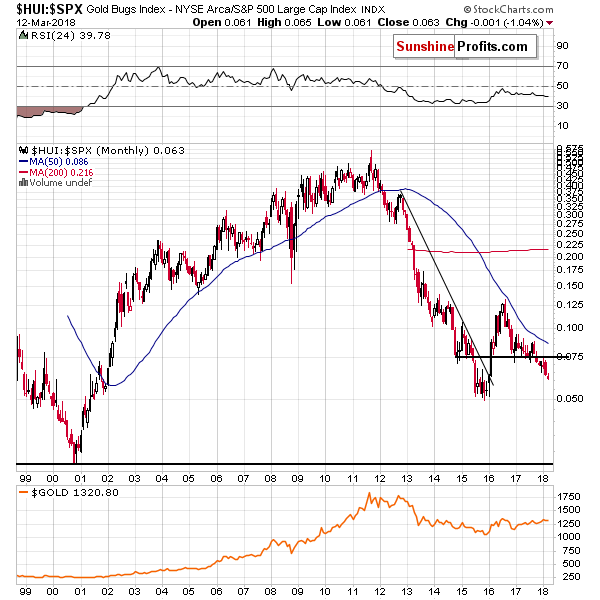
Both ratios are after major breakdowns and the entire back and forth movement in the PM sector means that these breakdowns were definitely verified.
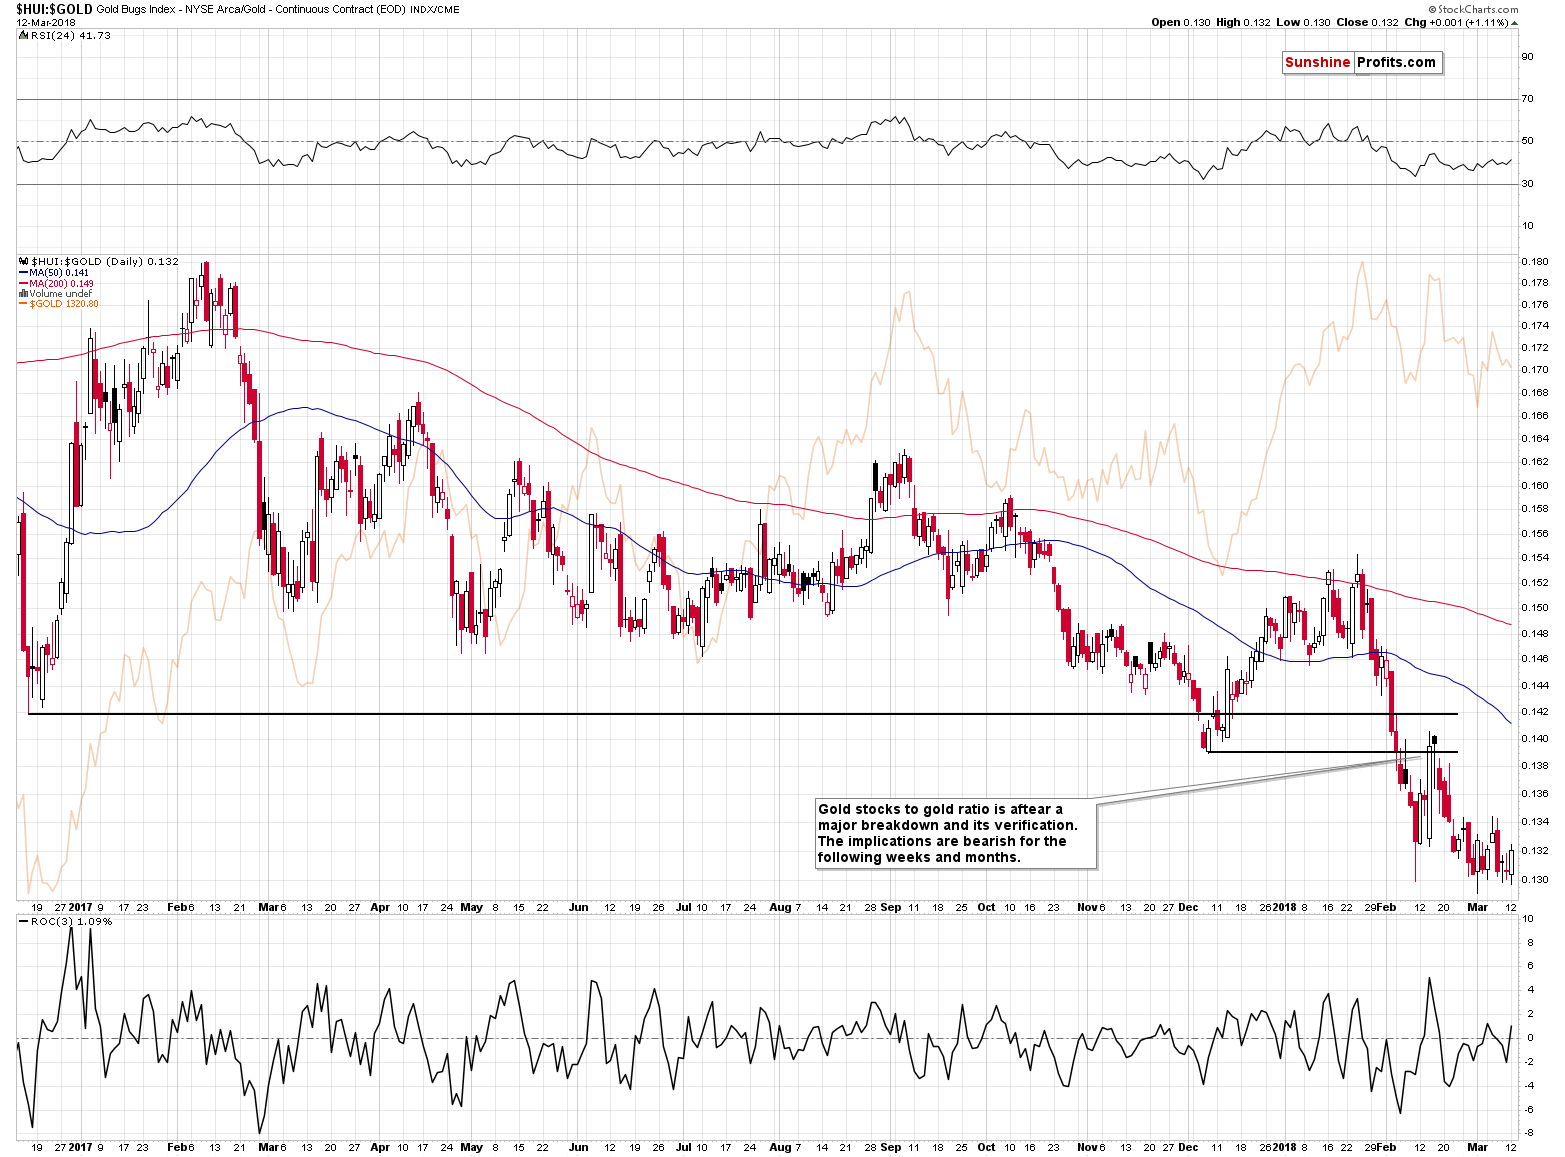
On a short-term basis, the back and forth movement seems rather boring, especially this month, but keeping the previous long-term charts in mind we know that the implications are actually bearish, and one should be preparing for a big decline. We are already more than prepared as we took the extra-large short position close to the recent short-term tops.
Silver’s Striking Similarity Continues
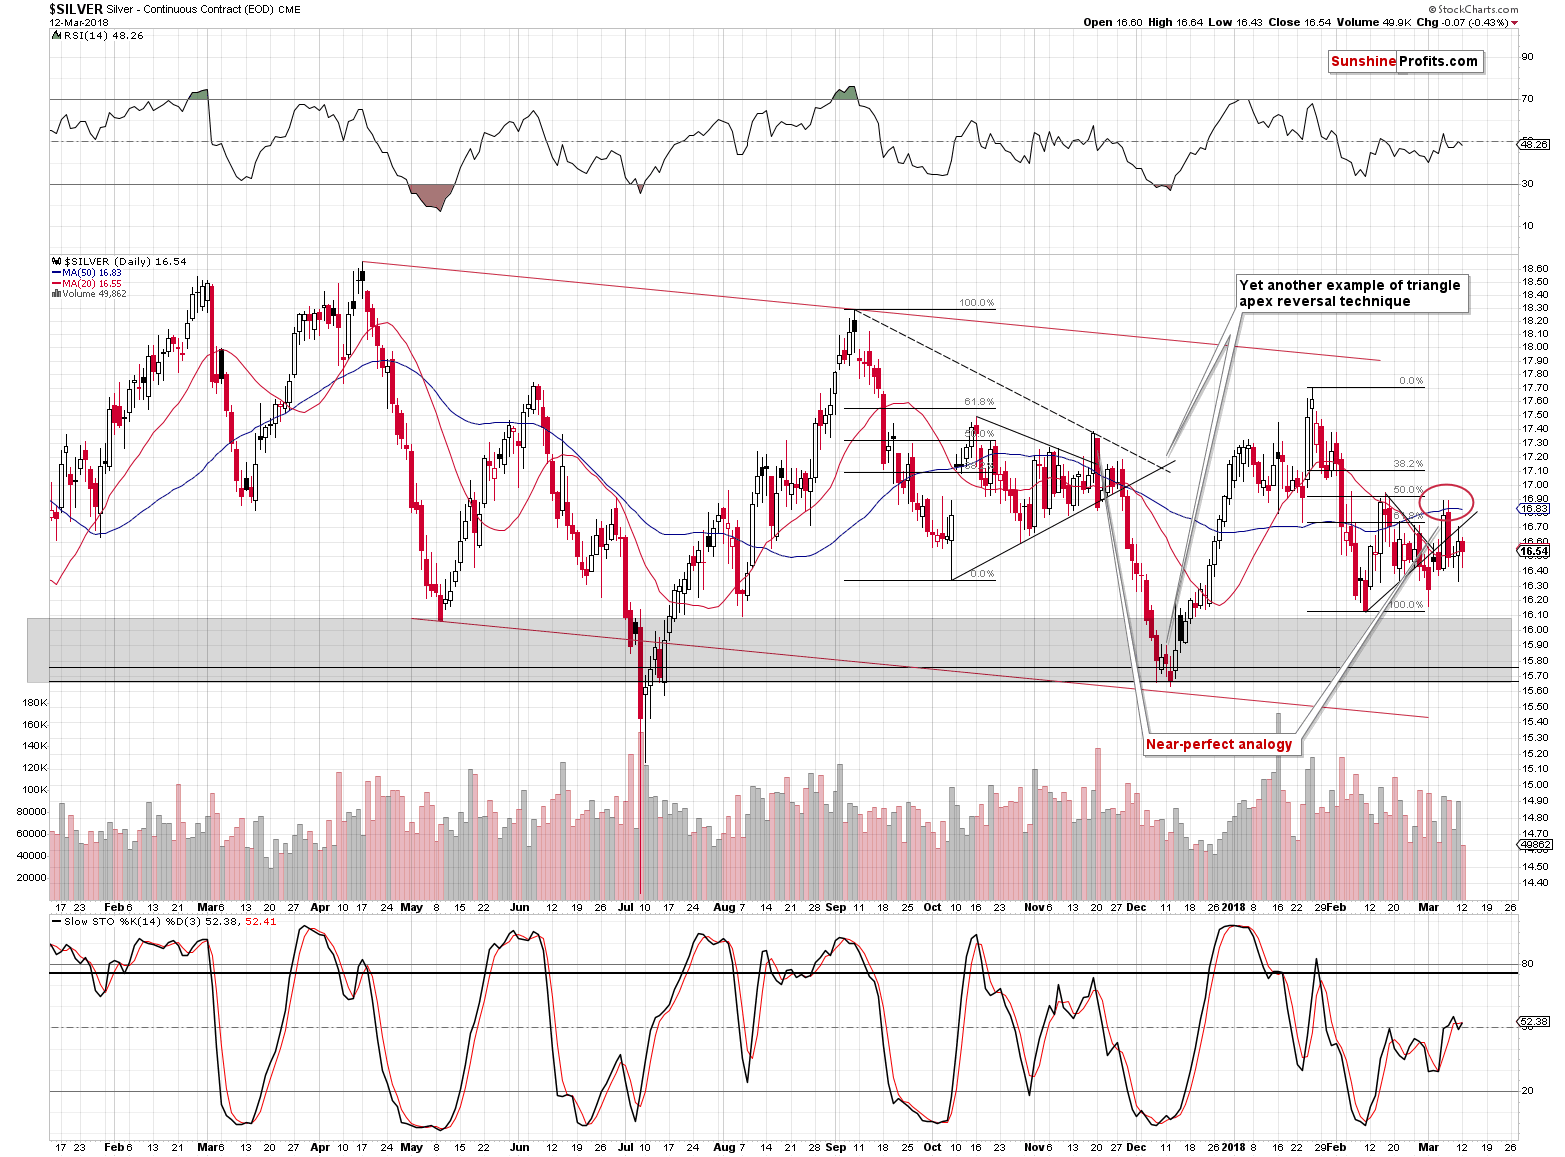
In the previous alerts, we wrote that we could see some sideways trading before silver took a dive, because that’s what happened in late November 2017 and the similarity between both price patters is striking.
As we emphasized previously, we were and still are in a situation when the white metal could either decline sharply right away and move significantly lower or it could move up just a little and then decline sharply anyway. Waiting for even better prices seems to be a gamble in a game in which the odds are really against us. If we’re about to profit from the $1+ slide in silver, then the possibility of seeing another 10-20 cent upswing while risking missing a 50-cent initial (or so) decline just doesn’t seem to be worth it.
Back in November, silver started the big slide 5 trading days after the initial big daily decline. Since the current pattern is shorter than the previous one (similarly big moves are compressed to a smaller time frame), we can expect the big slide to start 3 or 4 trading days after the big daily decline. Today is the fourth trading day, so it could be the case that the pre-market move lower is already the beginning of the big decline.
Gold’s Pause and Confirmation
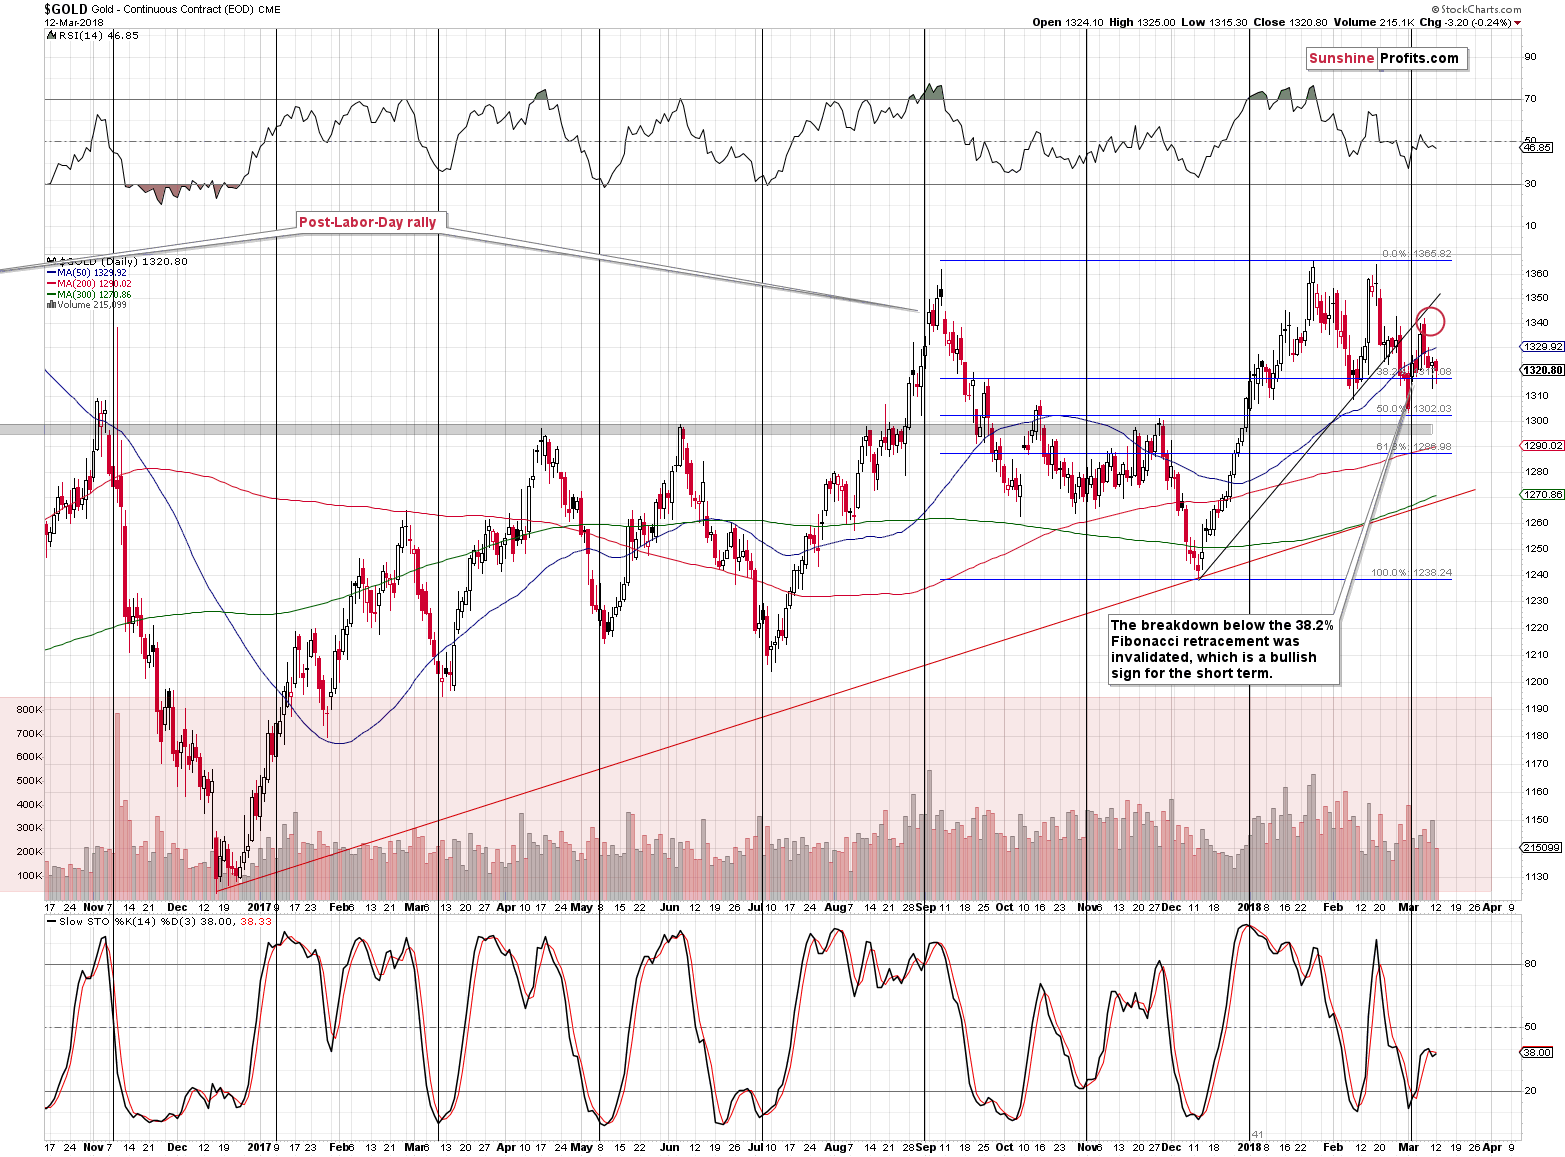
Gold didn’t do anything new during yesterday’s trading, so our previous comments on its price movement remain up-to-date:
What’s particularly interesting is that gold formed a bullish reversal after breaking below the 50-day moving average. In Friday’s regular alert, we wrote the following:
The thing that we would like to add today is the comparison to the December 1st, 2017 session. That was the session that followed the breakdown below the 50-day moving average after the final top. Today is also the session that follows the breakdown below the 50-day moving average after (what’s likely to have been) the final top.
Single-day analogies are generally not very reliable (more similar cases with a certain outcome are generally needed for the implications to become important), but it’s something worth keeping in mind anyway. Especially that it fits the performance that we often see close to the release of important economic data.
Back on December 1st, gold moved higher, erasing most of its recent short-term downswing, but ended the session only a bit higher, forming a major reversal. If we see something similar today, gold could move to approximately $1,335 before declining.
As a reminder, we expect to see a turnaround not only based on the U.S. jobs report, but based on the very important triangle reversal pattern. We described it in detail on February 26th. To be precise: the turnaround based on the above is likely to happen today or in the next few trading days. Let’s say that the reversal is highly likely to be seen before the end of Wednesday’s session.
As we emphasized in Friday’s intraday follow-up, the fact that silver moved a few cents above its target level and gold didn’t even move close to it served as a strong bearish sign, as it was a clear proof of silver’s very short-term outperformance – something that often precedes big declines.
Still, we have seen a move back up in gold and a close below the 50-day MA, which makes the session similar to the mentioned December 1st, 2017 session. The implications thereof are bearish and they seem to cancel any bullish implications that could result from the reversal itself.
Please note that on December 4th, 2017 (the next session after December 1) gold didn’t do much and we can say pretty much the same thing about yesterday’s session. This makes the analogy to the previous breakdown below 50-day MA more important. The implications are bearish.
Gold Stocks’ Breakdown Below 2017 Low
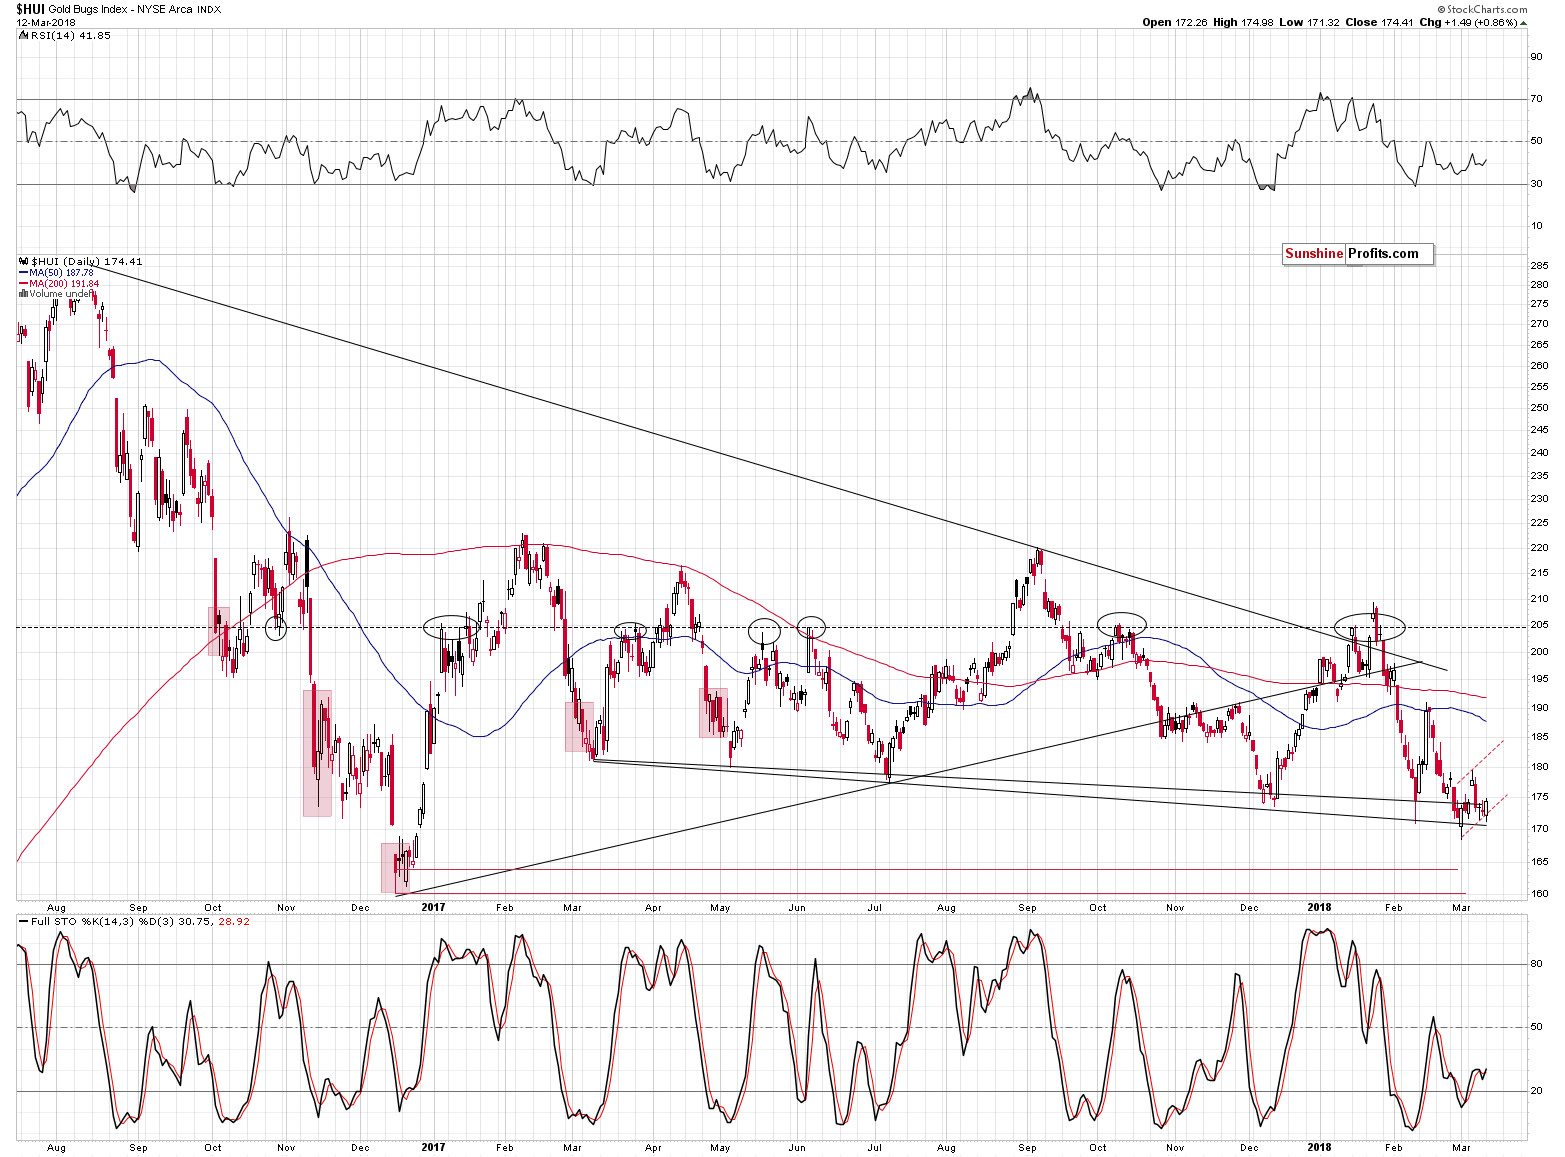
In our previous alerts, we added a red ellipse on the above chart as that was the maximum target that seemed likely for any counter-trend rallies. Today, we decided to remove it from the chart as the odds of another move higher declined.
Based on the analogy present in silver, the one in gold and due to gold’s triangle apex reversal, it seems that the chance of another upswing is very low. Even if it is seen, gold miners would be likely to underperform, so a move to a new March 2018 high doesn’t seem to be in the cards.
Please note that except for the March 6th session, all other sessions after the February 27th breakdown were characterized by closes below the 2017 low – including yesterday’s one.
It seems that the breakdown below the last year’s low is now more than verified and thus much lower prices are likely to follow.
Summary
Summing up, a major top in gold, silver and mining stocks is probably in, and based on the way silver and gold stocks performed on Friday, it seems that the big decline is just around the corner. We already saw the key short-term signs: silver’s outperformance and miners’ underperformance on Tuesday, and the fact that they were repeated on Friday makes the bearish outlook even more bearish, especially that our last week’s upside targets for gold and silver were already reached. Consequently, it seems that an extra-large short position is currently justified from the risk to reward point of view, even though it’s still somewhat possible that we will see slightly higher PM prices later today or tomorrow.
As always, we will keep you – our subscribers – informed.
To summarize:
Trading capital (supplementary part of the portfolio; our opinion): Full short positions (200% of the full position) in gold, silver and mining stocks are justified from the risk/reward perspective with the following stop-loss orders and initial target price levels:
- Gold: initial target price: $1,218; stop-loss: $1,382; initial target price for the DGLD ETN: $53.98; stop-loss for the DGLD ETN $37.68
- Silver: initial target price: $14.63; stop-loss: $17.33; initial target price for the DSLV ETN: $33.88; stop-loss for the DSLV ETN $21.48
- Mining stocks (price levels for the GDX ETF): initial target price: $19.22; stop-loss: $23.54; initial target price for the DUST ETF: $39.88; stop-loss for the DUST ETF $21.46
In case one wants to bet on junior mining stocks' prices (we do not suggest doing so – we think senior mining stocks are more predictable in the case of short-term trades – if one wants to do it anyway, we provide the details), here are the stop-loss details and initial target prices:
- GDXJ ETF: initial target price: $27.82; stop-loss: $36.14
- JDST ETF: initial target price: $94.88 stop-loss: $41.86
Long-term capital (core part of the portfolio; our opinion): No positions (in other words: cash)
Insurance capital (core part of the portfolio; our opinion): Full position
Important Details for New Subscribers
Whether you already subscribed or not, we encourage you to find out how to make the most of our alerts and read our replies to the most common alert-and-gold-trading-related-questions.
Please note that the in the trading section we describe the situation for the day that the alert is posted. In other words, it we are writing about a speculative position, it means that it is up-to-date on the day it was posted. We are also featuring the initial target prices, so that you can decide whether keeping a position on a given day is something that is in tune with your approach (some moves are too small for medium-term traders and some might appear too big for day-traders).
Plus, you might want to read why our stop-loss orders are usually relatively far from the current price.
Please note that a full position doesn’t mean using all of the capital for a given trade. You will find details on our thoughts on gold portfolio structuring in the Key Insights section on our website.
As a reminder – “initial target price” means exactly that – an “initial” one, it’s not a price level at which we suggest closing positions. If this becomes the case (like it did in the previous trade) we will refer to these levels as levels of exit orders (exactly as we’ve done previously). Stop-loss levels, however, are naturally not “initial”, but something that, in our opinion, might be entered as an order.
Since it is impossible to synchronize target prices and stop-loss levels for all the ETFs and ETNs with the main markets that we provide these levels for (gold, silver and mining stocks – the GDX ETF), the stop-loss levels and target prices for other ETNs and ETF (among other: UGLD, DGLD, USLV, DSLV, NUGT, DUST, JNUG, JDST) are provided as supplementary, and not as “final”. This means that if a stop-loss or a target level is reached for any of the “additional instruments” (DGLD for instance), but not for the “main instrument” (gold in this case), we will view positions in both gold and DGLD as still open and the stop-loss for DGLD would have to be moved lower. On the other hand, if gold moves to a stop-loss level but DGLD doesn’t, then we will view both positions (in gold and DGLD) as closed. In other words, since it’s not possible to be 100% certain that each related instrument moves to a given level when the underlying instrument does, we can’t provide levels that would be binding. The levels that we do provide are our best estimate of the levels that will correspond to the levels in the underlying assets, but it will be the underlying assets that one will need to focus on regarding the signs pointing to closing a given position or keeping it open. We might adjust the levels in the “additional instruments” without adjusting the levels in the “main instruments”, which will simply mean that we have improved our estimation of these levels, not that we changed our outlook on the markets. We are already working on a tool that would update these levels on a daily basis for the most popular ETFs, ETNs and individual mining stocks.
Our preferred ways to invest in and to trade gold along with the reasoning can be found in the how to buy gold section. Additionally, our preferred ETFs and ETNs can be found in our Gold & Silver ETF Ranking.
As a reminder, Gold & Silver Trading Alerts are posted before or on each trading day (we usually post them before the opening bell, but we don't promise doing that each day). If there's anything urgent, we will send you an additional small alert before posting the main one.
=====
Latest Free Trading Alerts:
The ECB dropped its easing bias on Thursday. Monetary hawks are pleased. But doves are holding tight. And what does gold do?
Unbiased Gold Analysis of Draghi Dropping the Bias
=====
Hand-picked precious-metals-related links:
PRECIOUS-Gold claws way back into the black after Trump sacks Tillerson
LAWRIE WILLIAMS: Chinese CB officially adds zero to gold reserves in February
Havens Just Aren’t Safe Anymore, Goldman Says
=====
In other news:
Dollar surges past 107 yen before U.S. price data
World stocks inch higher ahead of U.S. inflation data
So Much for That Financial Early-Warning System
Russia Rejects U.K. Ultimatum Over Former Double Agent’s Poisoning
Trade war could derail global economic recovery, warns OECD
It Looks Like South Korea Is Planning to Allow ICOs And Regulate Crypto Trading After All
=====
Thank you.
Sincerely,
Przemyslaw Radomski, CFA
Founder, Editor-in-chief, Gold & Silver Fund Manager
Gold & Silver Trading Alerts
Forex Trading Alerts
Oil Investment Updates
Oil Trading Alerts

