

Briefly: in our opinion, a full (300% of the regular position size) speculative short position in silver is justified from the risk/reward point of view at the moment of publishing this Alert.
Before moving to the technical part of today’s analysis, I would like to emphasize that everything I said in yesterday’s premium video about the debt ceiling issues remains up-to-date.
Having said that, let’s move to what happened on the charts and what didn’t.
Miners
The most notable – and interesting – action took place in the mining stocks.
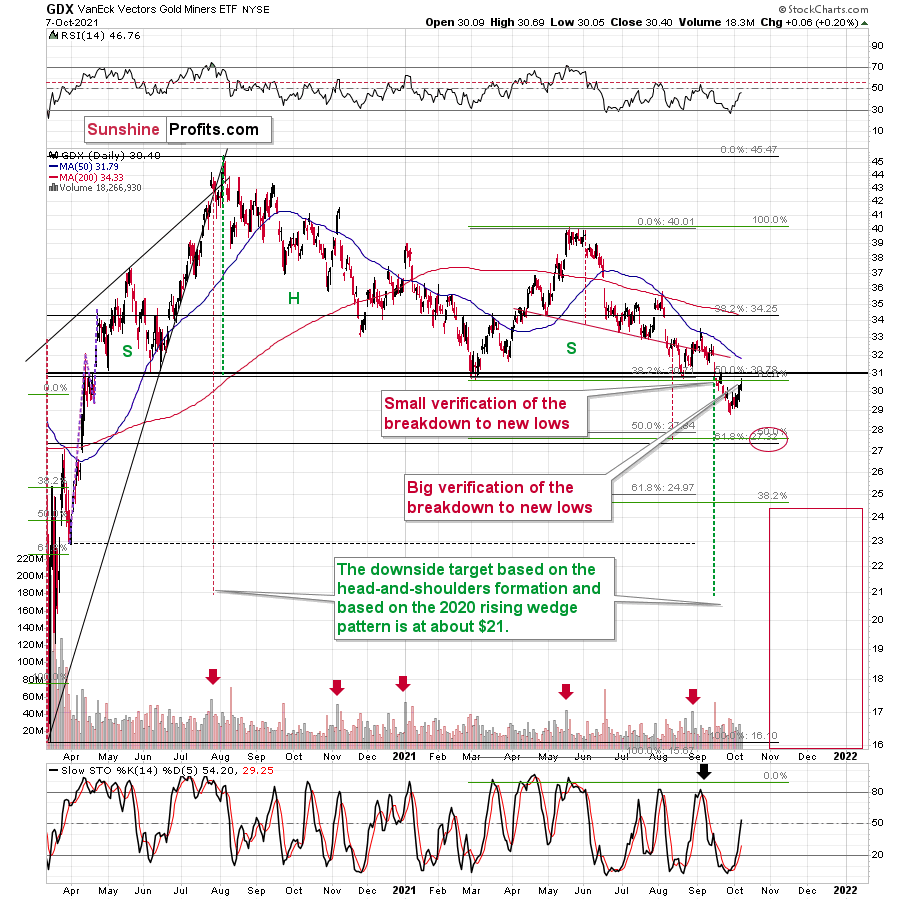
The GDX ETF rallied on an intraday basis, but erased almost all of its previous gains before the end of the session, closing only 6 cents higher. This tells us two things:
- That was an intraday reversal (it was not accompanied by huge volume, but still)
- Gold miners failed to rally back above their previous lows – they just touched the previous support and verified it as resistance.
Consequently, yesterday’s price action was nothing bullish – it was probably the final part of a corrective upswing.
In mid-September, we saw a tiny verification of the breakdown, and this time, the verification took a form that’s clearly visible even from the medium-term point of view. Does it change anything? Actually, yes, it does. Breakdown’s verification tells us that miners are even more ready to decline to new lows in a powerful manner.
The GDX ETF ended the day above the $30 level, but this level is not the key support / resistance level – the previous lows are. If the $30 level was critical, previous bottoms would have formed at it, and they didn’t.
But miners outperformed gold! Isn’t that a bullish sign?
If this persists, it might indeed become a bullish sign, but for now, it seems to have just been a necessary technical development (verification of the breakdown) that was likely influenced by what’s happening in the general stock market.
Every now and then miners follow stocks closely, but this link is usually short-lived. And so, as the general stock market rallied (and reversed), so did miners. I don’t think that stocks would be able to trigger a bigger rally in the miners, even if they rallied significantly from here.
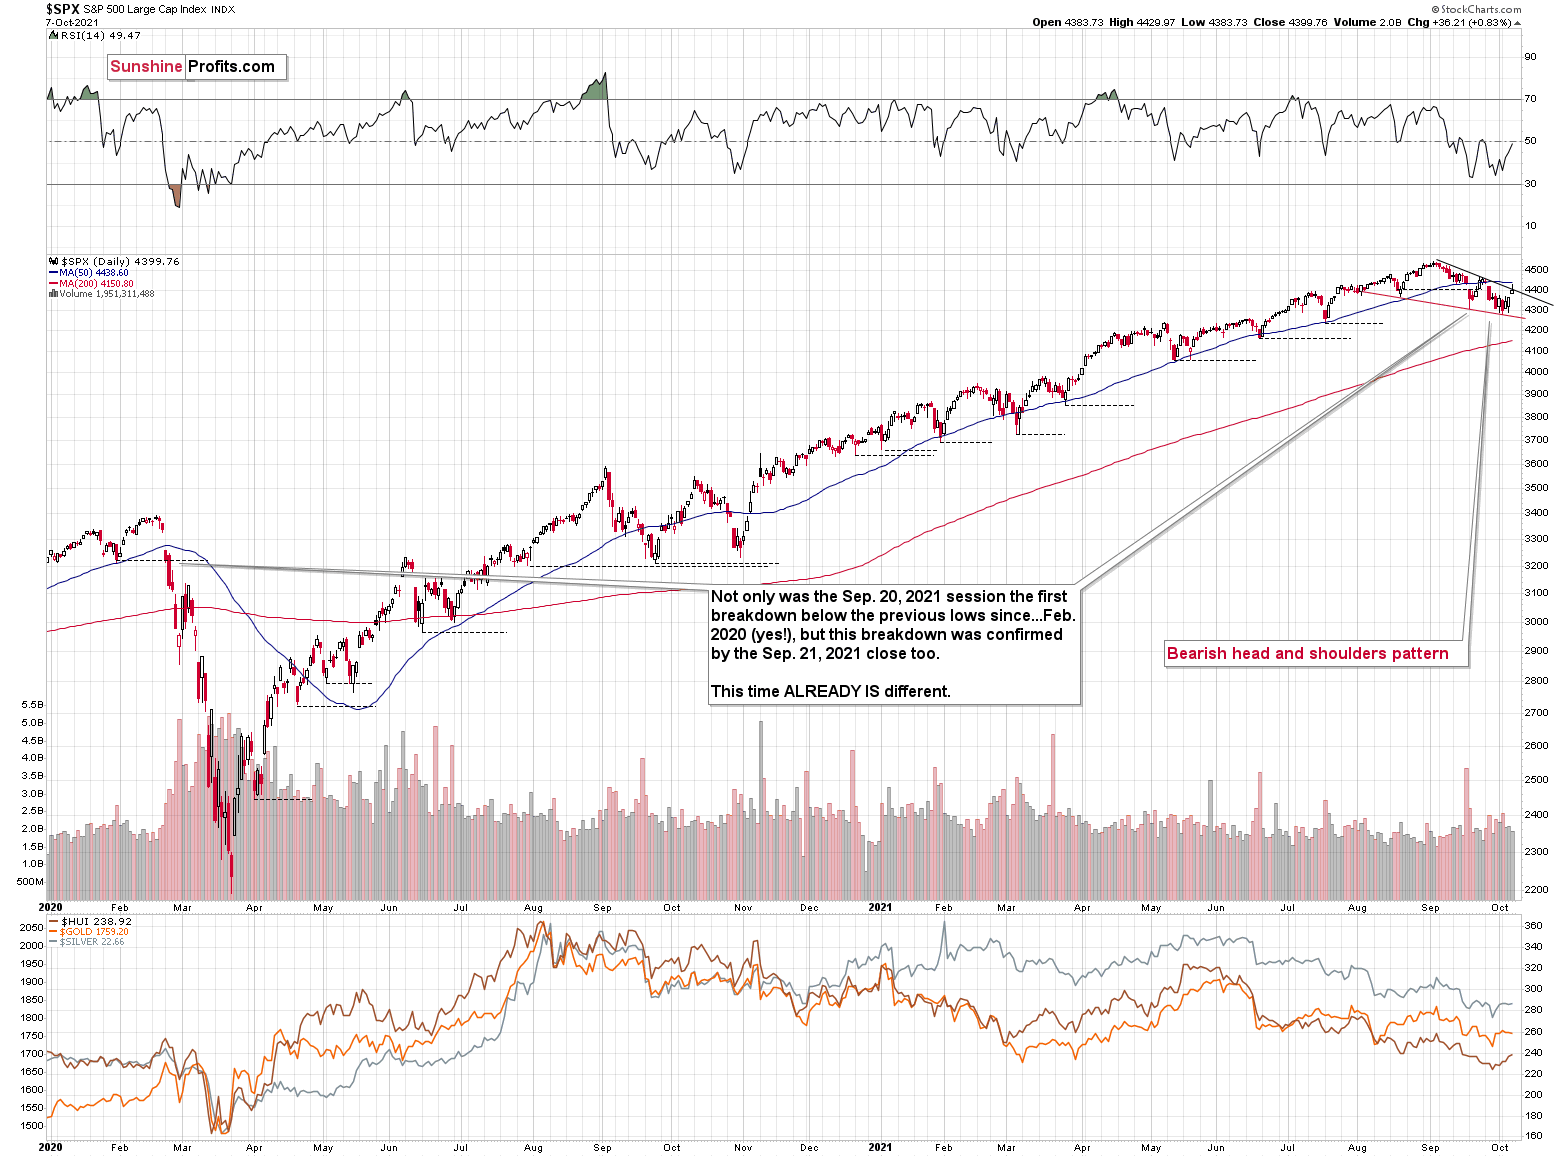
And based on stocks’ yesterday’s inability to rally above their declining black resistance line based on previous lows, it seems that they are ready to head south any day or hour now.
Silver
And while mining stocks have moved back to their previous (also August) lows, silver hasn’t even managed to do that.
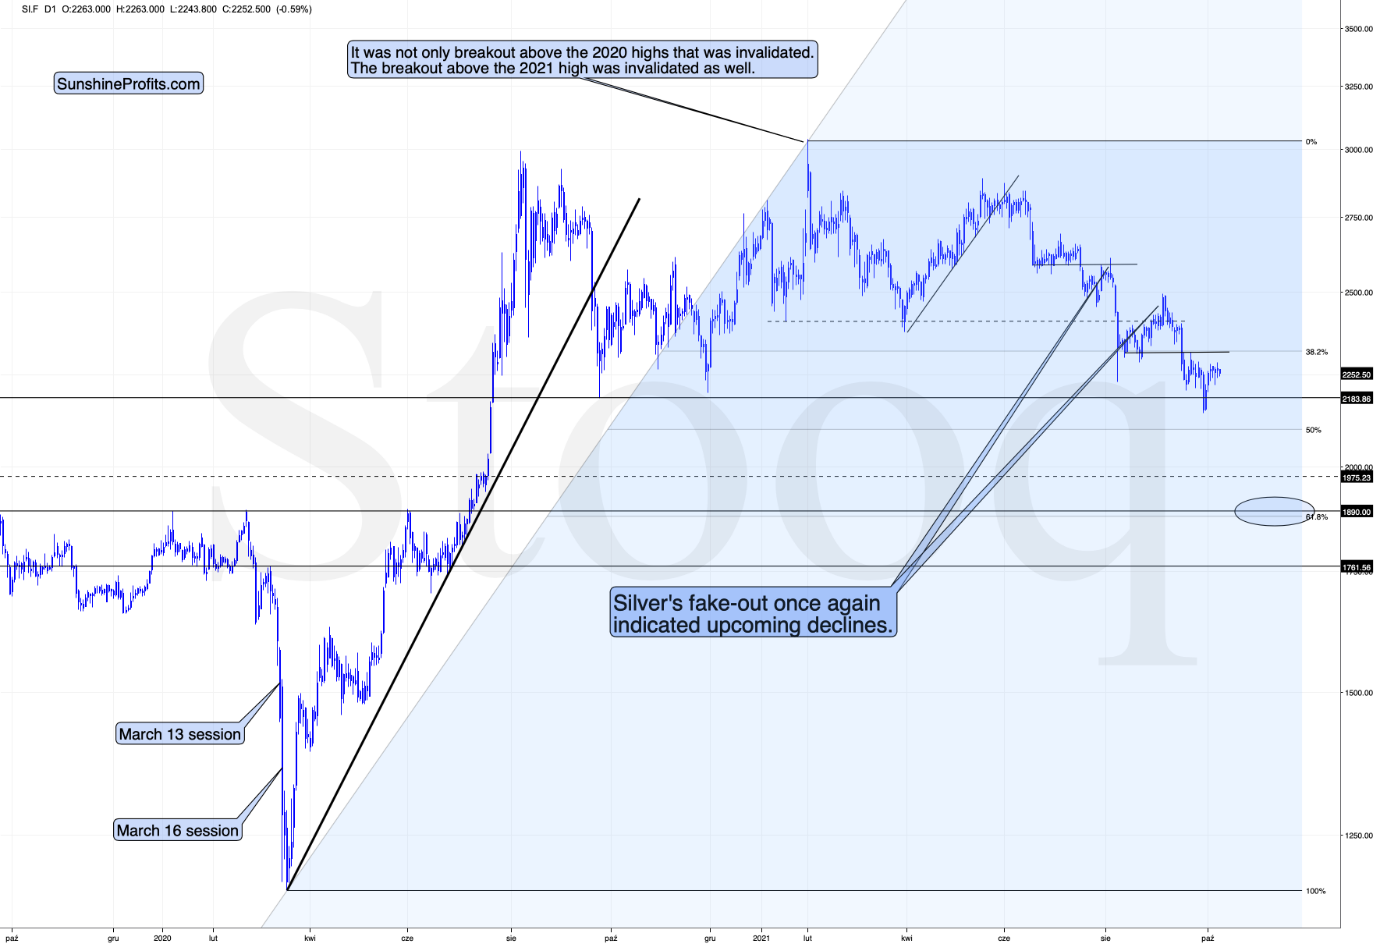
In terms of the daily closing prices, silver is visibly below its previous 2021 lows. Silver is already underperforming mining stocks, which seems to confirm that we made a good choice switching from a short position in mining stocks to a short position in silver.
The downside potential for the white metal remains bigger (in the short term!) than for the mining stocks, so I’m keeping my short position in silver intact.
I was asked how high I expect silver to move in the very near term before moving lower, and I don’t have a price expectation for that. Silver is unpredictable when it comes to such moves. Please note what happened right before the biggest declines in the recent past – in August and September. Silver popped up higher as if it was really about to soar. The problem with silver is that it can even break above the previous resistance just to fool traders and make them go long / exit short positions right before the big slide. Consequently, it seems to me that it's not even worth trying to come up with the upside price. It could even be above $23, but – obviously – it doesn’t have to rally at all.
Gold and the USDX
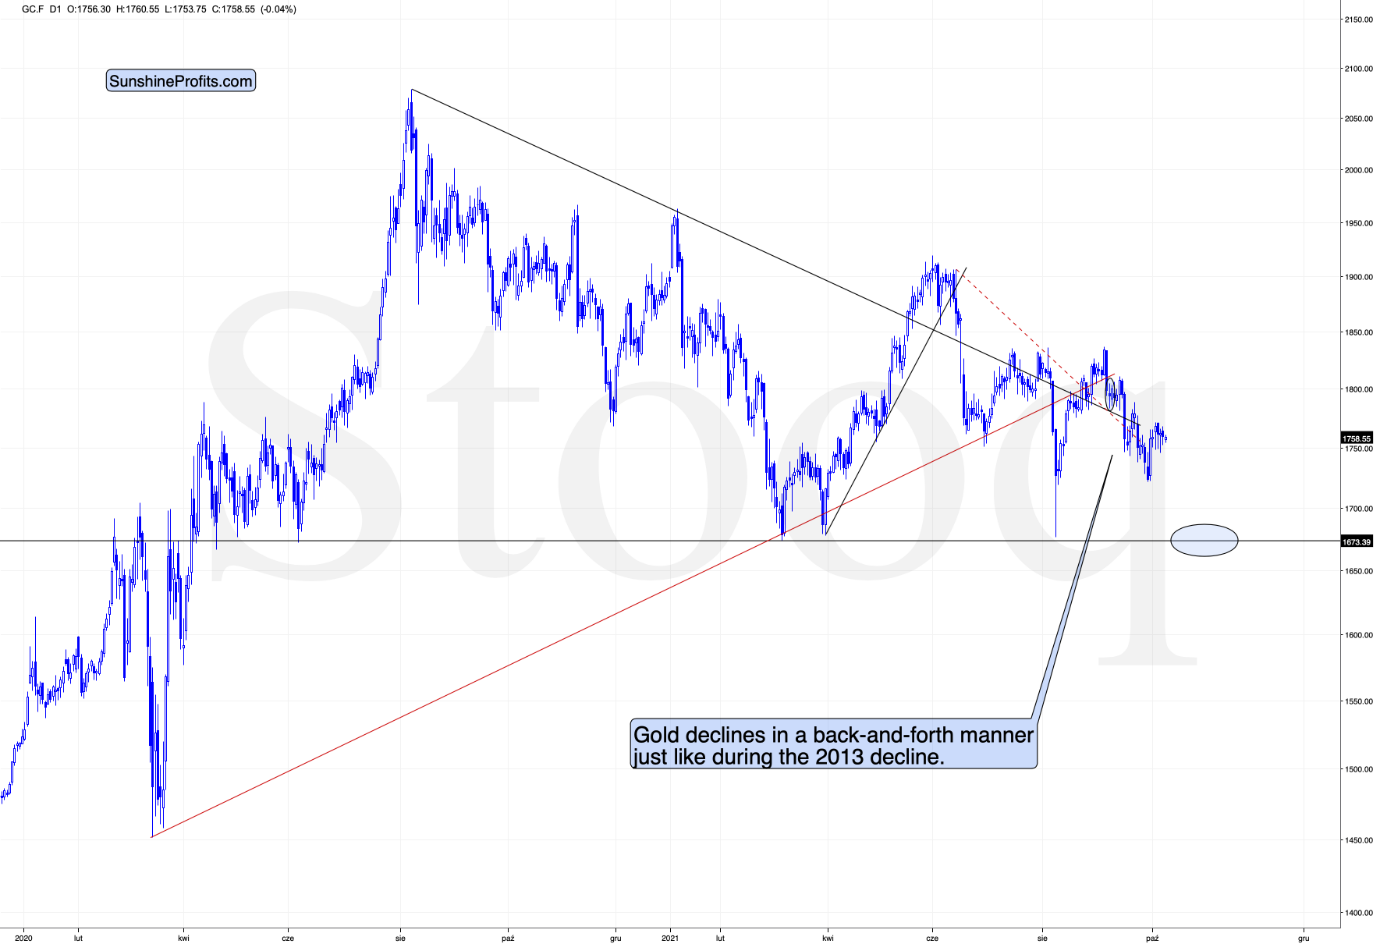
Gold is moving back and forth, and it’s doing so in tune with what happened in early 2013.
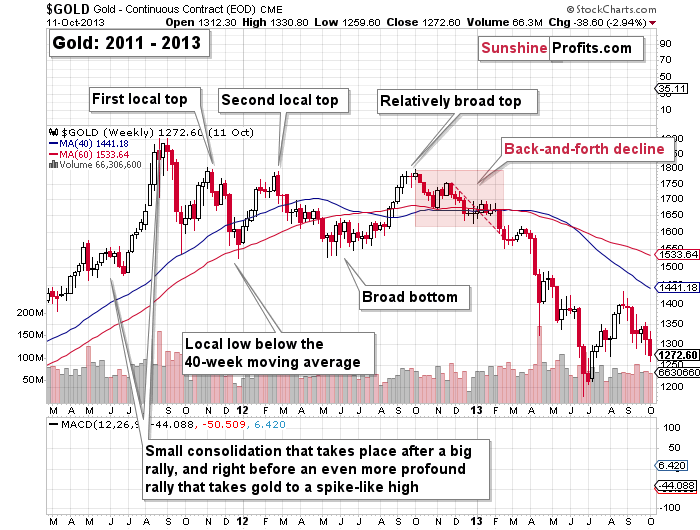
The implications of this analogy remain bearish.
Gold moved higher along with the USD Index recently, but that’s likely just a temporary effect of the debt-ceiling discussion, nothing more. Besides, the size of gold’s “strength” is not significant. So, all in all, I don’t view it as a true bullish sign.
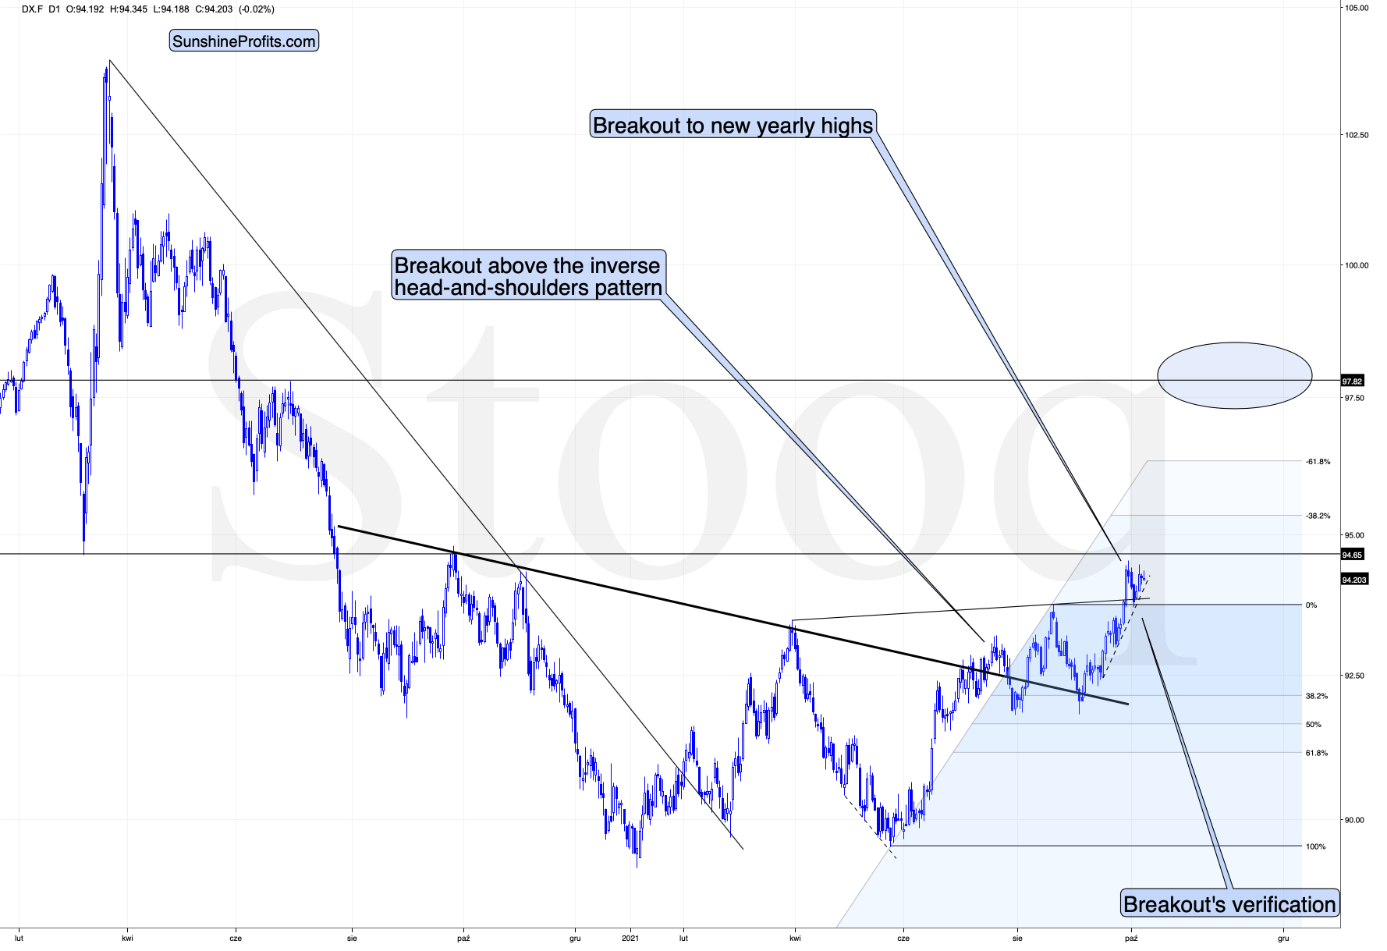
And speaking of the USD Index, please note how well it managed to verify the breakout to new highs and above the rising support/resistance line. It’s also above the rising dashed support line, so even the very short-term trend remains up.
Once the USD Index soars once again, PMs are likely to respond with much lower prices, and it seems that we won’t have to wait too long for it.
On a final note, before we move to more fundamental discussions, please note that the politicians might provide some more smoke and mirrors about the debt ceiling so that it looks like they hadn’t decided to keep raising it a long time ago. That’s just pretending to really care about fiscal responsibility and not about the S&P’s returns and votes. It might look like a “real, fierce fight” after which the politicians will be “forced” to raise the debt ceiling for “the good of the people”. The real reason will likely be that nobody wants to be directly responsible for the short-term economic turmoil that would follow otherwise. I don’t mean to be cynical here, and I’m not saying that all politicians are like that, but assuming that politicians and semi-politicians (monetary authorities, etc.) want votes and S&P returns while avoiding the personal blame usually allowed me to make quite accurate forecasts…
The implication for us is that whatever bullish happens in the near term (before the debt ceiling is raised in one way or another) is likely to be reversed, and the bearish outlook remains intact.
Having said that, let’s take a look at the details from an even more fundamental point of view.
More Than Meets the Eye
After U.S. lawmakers agreed to raise the debt ceiling through early December, U.S. equities basked in the glory. However, with the USD Index unfazed by the risk-on optimism, the greenback’s resiliency highlights how all is not well on Wall Street. For example, with inflation still surging, growth still sputtering, the Fed still hawkish and earnings season (which begins in mid-October) liable to disappoint, the S&P 500 remains on shaky ground.
For one, with the Delta variant stifling economic growth, the Atlanta Fed reduced its third-quarter GDPNow estimate to 1.3% on Oct. 5. For context, the estimate was north of 5% in early September.
Please see below:
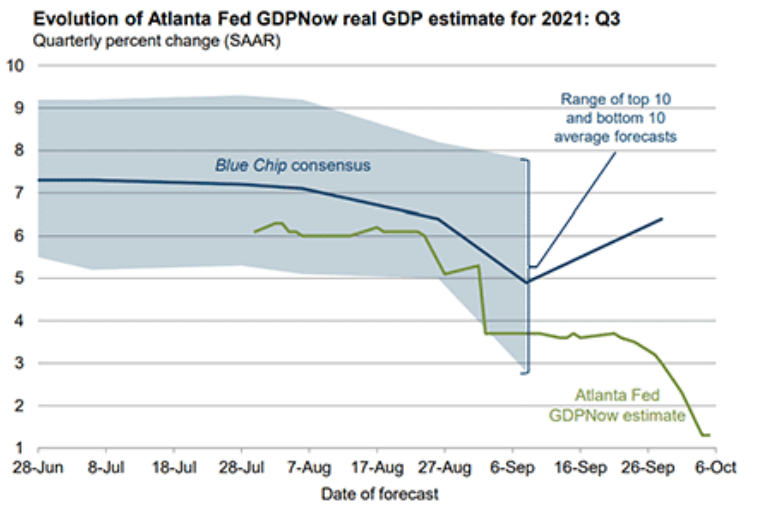
To explain, the blue line above tracks the Blue Chip consensus GDP growth estimate for the third quarter, and the shaded blue area represents the range of economists’ estimates. If you analyze the depth, you can see that economists expect a print in the ~3% to ~8% range. In stark contrast, the green line above tracks the Atlanta Fed’s GDPNow estimate – which has sunk like a stone and now implies 1.3% GDP growth in the third quarter.
Second, with Q3 earnings season likely to light some fireworks, I warned on Sep. 28 that downward earnings revisions could be a major thorn in the S&P 500’s side.
I wrote:
With the S&P 500’s earnings revision breadth (ERB) – which compares the number of earnings upgrades to the number of earnings downgrades – already two standard deviations above its historical average, a reversion to the mean implies a sharp correction of the S&P 500.
Please see below:
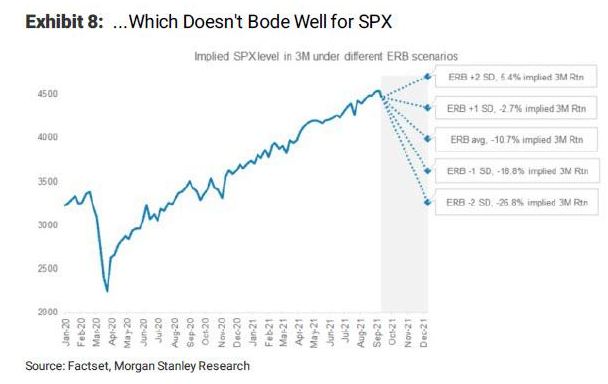
To explain, the solid blue line above tracks the trajectory of the S&P 500’s ERB. If you analyze the dotted blue lines on the right side of the chart, you can see that a return to the historical average ERB implies a 10.7% drawdown of the S&P 500. Likewise, a decline in the ERB to one standard deviation below its historical average implies an 18.8% drawdown of the S&P 500. As a result, unless a slew of earnings upgrades commence, the S&P 500’s risk-reward is severely tilted to the downside.
To that point, with recent earnings revisions following the ominous path of the Atlanta Fed’s GDPNow estimate, investors’ misguided optimism doesn’t reflect the current economic realities.
Please see below:
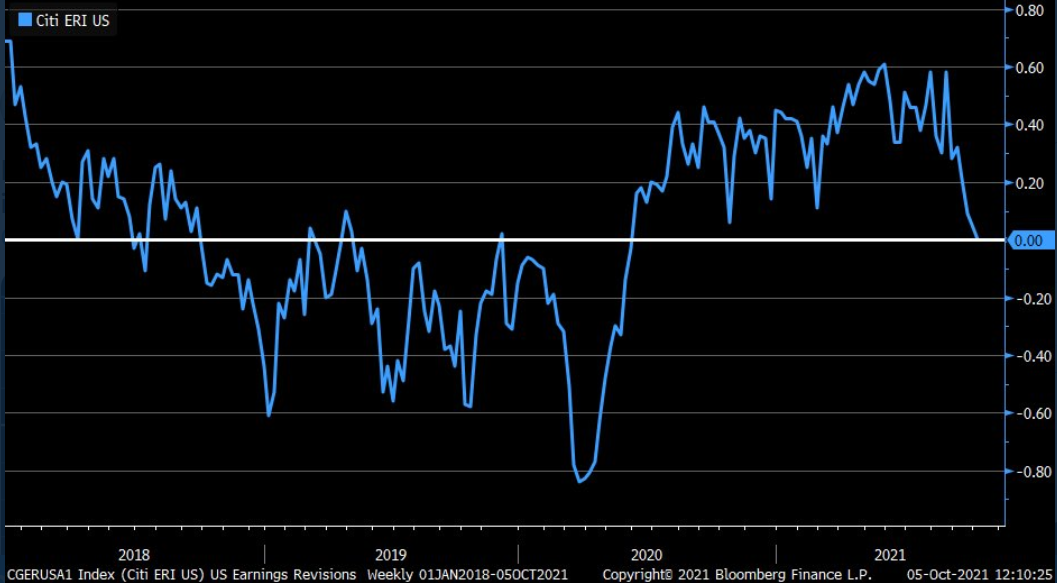
To explain, the blue line above tracks Citigroup’s index of weekly earnings revisions. If you analyze the right side of the chart, you can see that analysts’ third-quarter estimates declined sharply last week. Likewise, if Q3 earnings calls are riddled with mentions of “supply chain disruptions” and “inflation,” a material re-rating of U.S. equities could be in store.
Third, the relief rally that we witnessed on Oct. 7 also flies in the face of seasonal weakness.
Please see below:
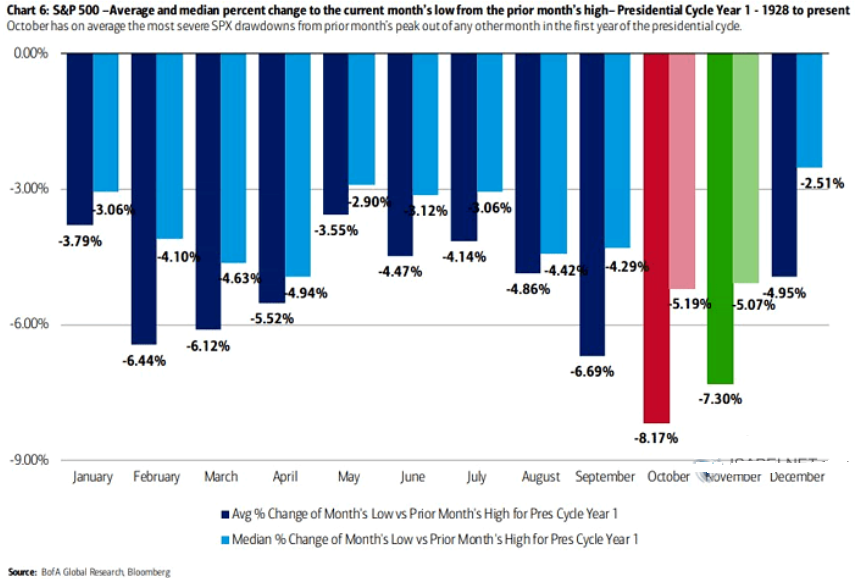
To explain, the various bars above track the magnitude of the average and median monthly peak-to-trough drawdowns of the S&P 500 after a new U.S. President takes office. If you analyze the columns labeled “October” and “November,” you can see that the autumn months often coincide with the S&P 500’s largest average and median peak-to-trough declines. As a result, the S&P 500 is far from out of the woods.
Fourth, Bank of America’s “US Regime Indicator” has dipped recently, and the drop signals that a “Late Cycle” U.S. economy could morph into a downturn in the coming months.
Please see below:
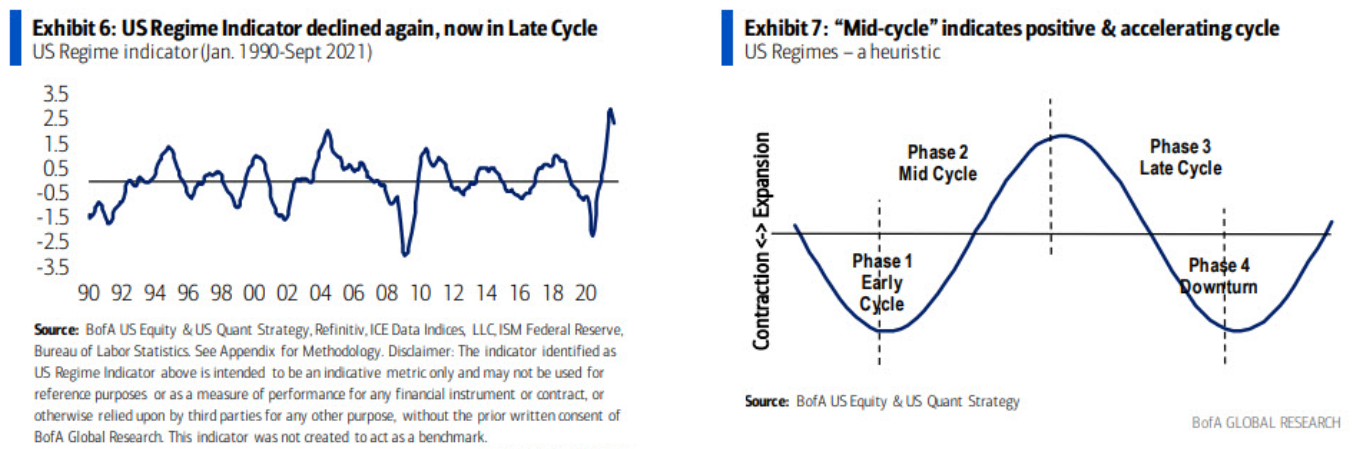
To explain, the chart on the left depicts how Bank of America’s “US Regime Indicator” has declined from its all-time high set in early summer. More importantly, though, if you turn to the chart on the right, you can see that a “Phase 3 Late Cycle” is proceeded by a “Phase 4 Downturn.” And with S&P 500 valuations near/at record highs, margin debt near/at record highs and surging inflation poised to accelerate the death of QE, a “Phase 4 Downturn” is far from priced in.
Equally ominous, the S&P 500 ended its 227-day streak of avoiding a 5% drawdown from its all-time high on Sep. 30. For context, it was the longest streak since February 2018 and the fourth-longest streak in the last 50 years.
Please see below:
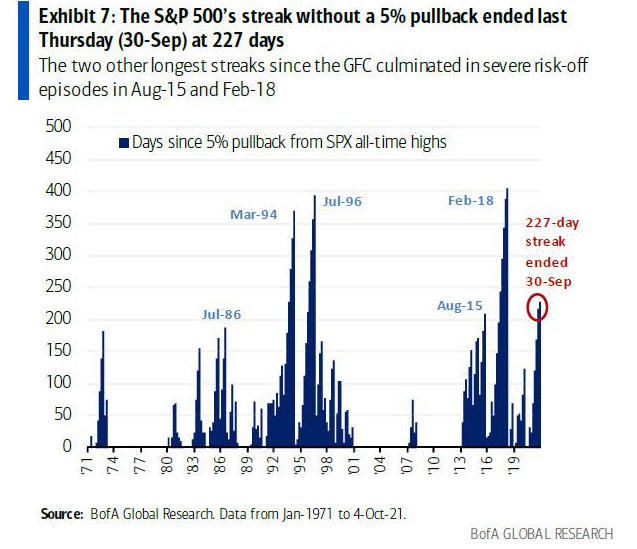
More importantly, though, the end of the two prior streaks that occurred in February 2018 and August 2015 culminated with further weakness in the following month. Or, as Bank of America’s derivatives strategist Nitin Saksena told clients, investors that buy “after clustered shocks” often regret the decision soon after.
Please see below:
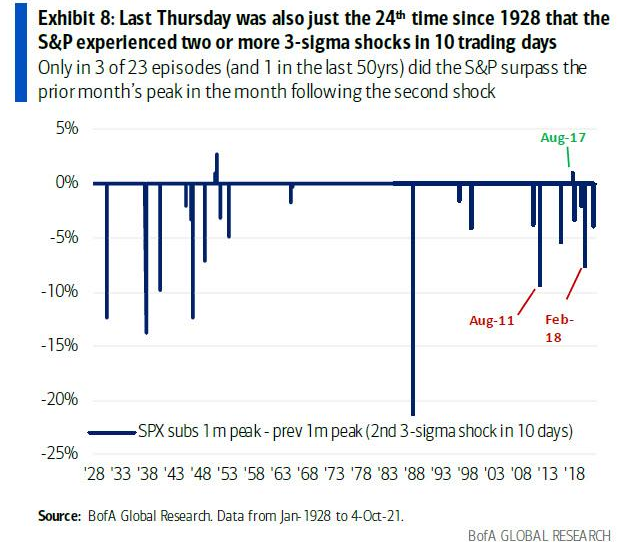
To explain, the blue bars above track the S&P 500’s historical “3-sigma” (three standard deviations from the average) daily drawdowns throughout 10-day trading periods. For context, two or more three-sigma daily drawdowns have only occurred 24 times throughout a 10-day trading period since 1928. Furthermore, on only three of the previous 23 occasions (and only once in the last 50 years) has the S&P 500 surpassed the previous month’s high in the following month. As a result, with the S&P 500 capping off its second three-sigma daily drawdown on Sep. 30, history implies that chasing new highs in the short term will likely end in disappointment.
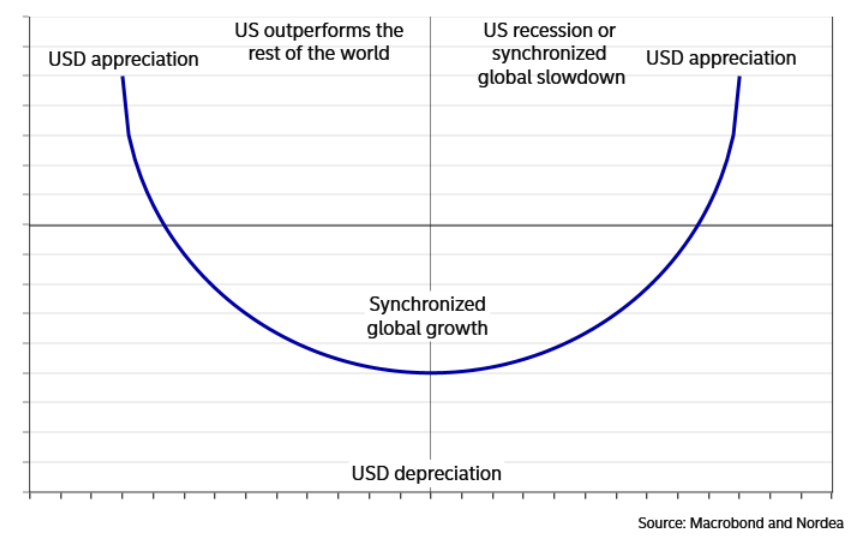
The Smile of the USD Index
However, why is all of this so important? Well, with the USD Index already verifying the breakout above the neckline of its inverse (bullish) head & shoulders pattern, a profound correction of U.S. equities could be a catalyst for the next move higher.
To explain, I wrote on Oct. 6:
The USD Index’s fundamental strength is underwritten by the ‘dollar smile.’ When the U.S. economy is trudging along, the U.S. dollar tends to underperform. However, when the U.S. economy craters and a safe-haven bid emerges, the U.S. dollar often outperforms. Conversely (and similarly), when the U.S. economy is booming and higher interest rates materialize, the U.S. dollar also outperforms.
Please see below:
On top of that, with the EUR/USD accounting for nearly 58% of the movement of the USD Index, I’ve been warning for months that lower-for-longer ECB policy supports a much stronger U.S. dollar.
For context, I wrote on Jul. 20:
Not only is the U.S. economy outperforming the Eurozone, but the Fed and the ECB are worlds apart.
Please see below:
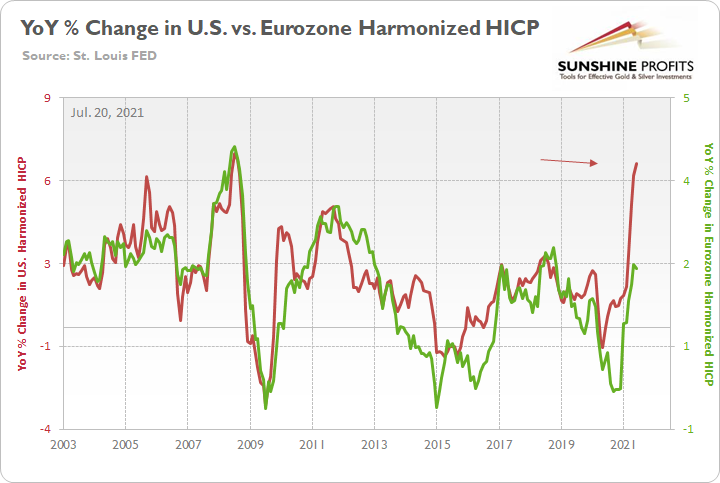
To explain, the green line above tracks the year-over-year (YoY) percentage change in the Eurozone Harmonized Index of Consumer Prices (HICP), while the red line above tracks the YoY percentage change in the U.S. HICP. If you analyze the right side of the chart, it’s not even close. And with the U.S. HICP rising by 6.41% YoY in June and the Eurozone HICP rising by 1.90%, the Fed is likely to taper well in advance of the ECB.
Supporting that thesis and admitting that the Eurozone is nowhere near “the red zone,” ECB Chief Economist Philip Lane made the point for me on Oct. 7. He said:
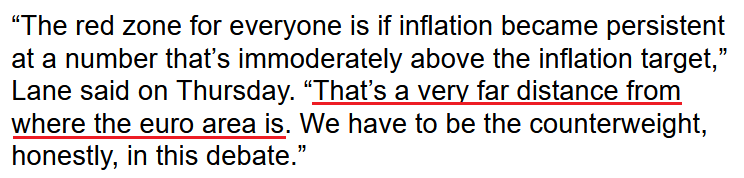 Source: Bloomberg
The bottom line? With the dollar smile alive and well, the PMs could be frowning in the coming months. On one side of the dollar’s grin, the U.S. 10-Year Treasury yield rose by 3.27% on Oct. 7, and the U.S. 5-Year Treasury yield closed at a new 2021 high. On the other side of the dollar’s grin, a profound correction of U.S. equities could accelerate the safe-haven bid. Either way, with the PMs exhibiting strong negative correlations with the U.S. dollar, the latter’s robust fundamentals are extremely problematic for the former. As a result, a further weakness for gold, silver and mining stocks should materialize over the medium term.
In conclusion, the PMs were mixed once again on Oct. 7, and gold was the primary laggard. However, with rising interest rates and U.S. dollar strength poised to continue throughout the remainder of 2021, the PMs could suffer materially during the autumn months. Moreover, while outperformance by today’s U.S. nonfarm payrolls could uplift U.S. Treasury yields, uplift the USD Index and upend the PMs, the trio’s likely paths remain the same over the medium term. As a result, any enthusiasm felt during the PMs’ corrective upswings should be kept at a minimum.
Overview of the Upcoming Part of the Decline
- It seems to me that the corrective upswing in gold is over, and the big decline seems to be already underway. We are very likely in the final part of this short-term decline, which is why I expect silver to catch up with mining stocks and decline quite substantially.
- It seems that the first stop for gold will be close to its previous 2021 lows, slightly below $1,700. Then it will likely correct a bit, but it’s unclear if I want to exit or reverse the current short position based on that – it depends on the number and the nature of the bullish indications that we get at that time. Before the next big slide, I will likely prefer to get back to the short position in the junior mining stocks.
- After the above-mentioned correction, we’re likely to see a powerful slide, perhaps close to the 2020 low ($1,450 - $1,500).
- If we see a situation where miners slide in a meaningful and volatile way while silver doesn’t (it just declines moderately), I plan to – once again – switch from short positions in miners to short positions in silver. At this time, it’s too early to say at what price levels this could take place, and if we get this kind of opportunity at all – perhaps with gold close to $1,600.
- I plan to exit all remaining short positions when gold shows substantial strength relative to the USD Index while the latter is still rallying. This might take place with gold close to $1,350 - $1,400. I expect silver to fall the hardest in the final part of the move. This moment (when gold performs very strongly against the rallying USD and miners are strong relative to gold after its substantial decline) is likely to be the best entry point for long-term investments, in my view. This might also happen with gold close to $1,375, but it’s too early to say with certainty at this time. I expect the final bottom to take place near the end of the year, perhaps in mid-December.
- As a confirmation for the above, I will use the (upcoming or perhaps we have already seen it?) top in the general stock market as the starting point for the three-month countdown. The reason is that after the 1929 top, gold miners declined for about three months after the general stock market started to slide. We also saw some confirmations of this theory based on the analogy to 2008. All in all, the precious metals sector is likely to bottom about three months after the general stock market tops.
- The above is based on the information available today, and it might change in the following days/weeks.
You will find my general overview of the outlook for gold on the chart below:
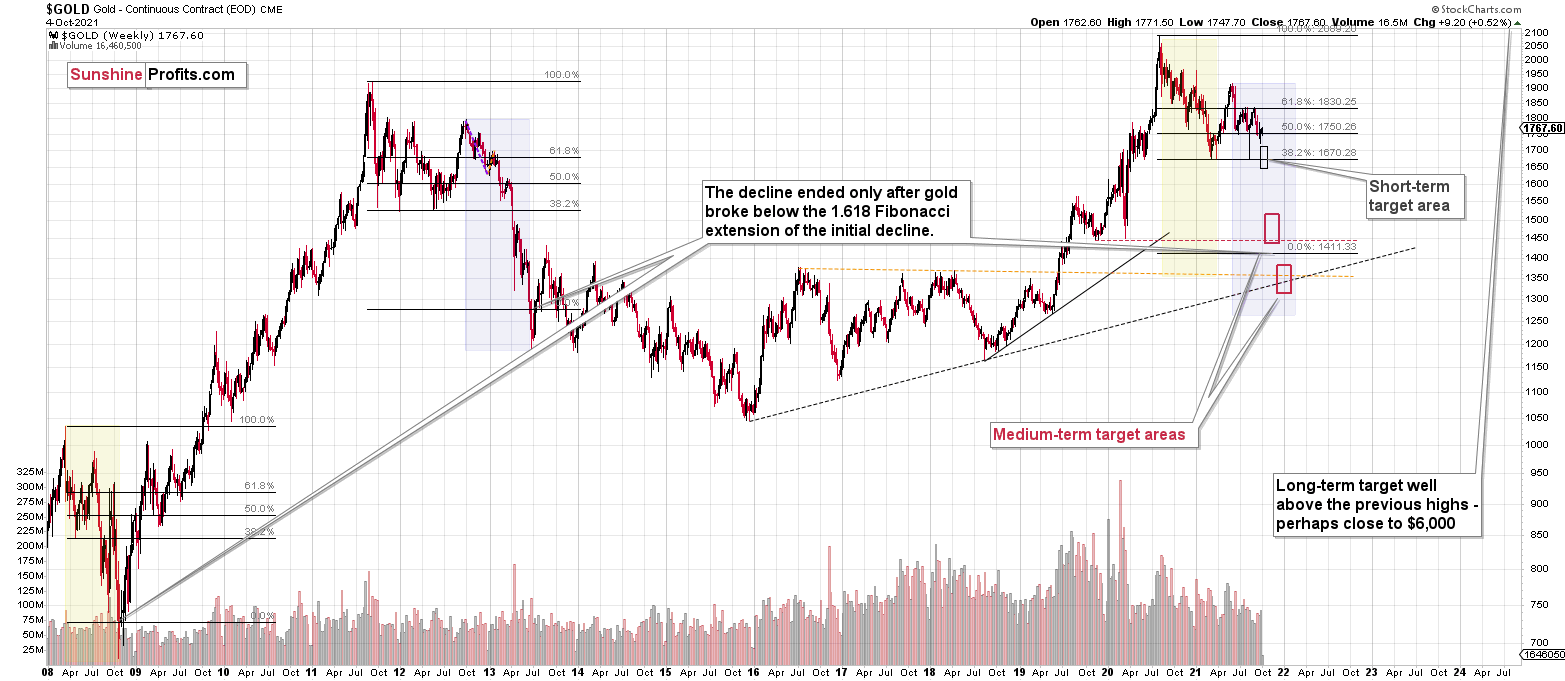
Please note that the above timing details are relatively broad and “for general overview only” – so that you know more or less what I think and how volatile I think the moves are likely to be – on an approximate basis. These time targets are not binding or clear enough for me to think that they should be used for purchasing options, warrants or similar instruments.
Summary
To summarize, the outlook for the precious metals sector remains extremely bearish for the next few months. It seems that we are in the final part of this short-term decline, which is why I expect silver to catch up with mining stocks and decline quite substantially.
Congratulations on reaping great profits from the previous short position in the junior mining stocks! While juniors are likely to decline more, it seems to me that the profits that one could get from shorting silver right now are likely to be even bigger.
From the medium-term point of view, the key two long-term factors remain the analogy to 2013 in gold and the broad head and shoulders pattern in the HUI Index. They both suggest much lower prices ahead.
It seems that our profits from the short positions are going to become truly epic in the following months.
After the sell-off (that takes gold to about $1,350 - $1,500), I expect the precious metals to rally significantly. The final part of the decline might take as little as 1-5 weeks, so it's important to stay alert to any changes.
Most importantly, please stay healthy and safe. We made a lot of money last March and this March, and it seems that we’re about to make much more on the upcoming decline, but you have to be healthy to enjoy the results.
As always, we'll keep you - our subscribers - informed.
By the way, we’re currently providing you with the possibility to extend your subscription by a year, two years or even three years with a special 20% discount. This discount can be applied right away, without the need to wait for your next renewal – if you choose to secure your premium access and complete the payment upfront. The boring time in the PMs is definitely over, and the time to pay close attention to the market is here. Naturally, it’s your capital, and the choice is up to you, but it seems that it might be a good idea to secure more premium access now while saving 20% at the same time. Our support team will be happy to assist you in the above-described upgrade at preferential terms – if you’d like to proceed, please contact us.
To summarize:
Trading capital (supplementary part of the portfolio; our opinion): Full speculative short position (300% of the full position) in silver is justified from the risk to reward point of view with the following binding exit profit-take price levels:
Silver futures profit-take exit price: $19.12
SLV profit-take exit price: $17.72
ZSL profit-take exit price: $41.38
HZD.TO profit-take exit price: $31.98
OR if gold reaches $1,683 – in this case, I think that taking profits and closing the short position in silver (and related instruments) will be justified from the risk to reward point of view, regardless of silver’s price.
I don’t have a stop-loss level for this trade.
For-your-information targets (our opinion; we continue to think that mining stocks are the preferred way of taking advantage of the upcoming price move, but if for whatever reason one wants / has to use silver or gold for this trade, we are providing the details anyway.):
Gold futures downside profit-take exit price: $1,683
GDXJ: $35.73
JDST: $16.28
GDXD: $33.48
All mining-stock-related instruments: if gold reaches $1,683 or the GDXJ reaches $35.73 (whichever is reached first), I would exit all remaining short positions in any mining stock trading vehicles aimed at profiting from the declines in the mining stocks.
Long-term capital (core part of the portfolio; our opinion): No positions (in other words: cash
Insurance capital (core part of the portfolio; our opinion): Full position
Whether you already subscribed or not, we encourage you to find out how to make the most of our alerts and read our replies to the most common alert-and-gold-trading-related-questions.
Please note that we describe the situation for the day that the alert is posted in the trading section. In other words, if we are writing about a speculative position, it means that it is up-to-date on the day it was posted. We are also featuring the initial target prices to decide whether keeping a position on a given day is in tune with your approach (some moves are too small for medium-term traders, and some might appear too big for day-traders).
Additionally, you might want to read why our stop-loss orders are usually relatively far from the current price.
Please note that a full position doesn't mean using all of the capital for a given trade. You will find details on our thoughts on gold portfolio structuring in the Key Insights section on our website.
As a reminder - "initial target price" means exactly that - an "initial" one. It's not a price level at which we suggest closing positions. If this becomes the case (like it did in the previous trade), we will refer to these levels as levels of exit orders (exactly as we've done previously). Stop-loss levels, however, are naturally not "initial", but something that, in our opinion, might be entered as an order.
Since it is impossible to synchronize target prices and stop-loss levels for all the ETFs and ETNs with the main markets that we provide these levels for (gold, silver and mining stocks - the GDX ETF), the stop-loss levels and target prices for other ETNs and ETF (among other: UGL, GLL, AGQ, ZSL, NUGT, DUST, JNUG, JDST) are provided as supplementary, and not as "final". This means that if a stop-loss or a target level is reached for any of the "additional instruments" (GLL for instance), but not for the "main instrument" (gold in this case), we will view positions in both gold and GLL as still open and the stop-loss for GLL would have to be moved lower. On the other hand, if gold moves to a stop-loss level but GLL doesn't, then we will view both positions (in gold and GLL) as closed. In other words, since it's not possible to be 100% certain that each related instrument moves to a given level when the underlying instrument does, we can't provide levels that would be binding. The levels that we do provide are our best estimate of the levels that will correspond to the levels in the underlying assets, but it will be the underlying assets that one will need to focus on regarding the signs pointing to closing a given position or keeping it open. We might adjust the levels in the "additional instruments" without adjusting the levels in the "main instruments", which will simply mean that we have improved our estimation of these levels, not that we changed our outlook on the markets. We are already working on a tool that would update these levels daily for the most popular ETFs, ETNs and individual mining stocks.
Our preferred ways to invest in and to trade gold along with the reasoning can be found in the how to buy gold section. Furthermore, our preferred ETFs and ETNs can be found in our Gold & Silver ETF Ranking.
As a reminder, Gold & Silver Trading Alerts are posted before or on each trading day (we usually post them before the opening bell, but we don't promise doing that each day). If there's anything urgent, we will send you an additional small alert before posting the main one.
Thank you.
Przemyslaw Radomski, CFA
Founder, Editor-in-chief

