

Briefly: in our opinion, full (200% of the regular size of the position) speculative short positions in gold, silver and mining stocks are justified from the risk/reward perspective at the moment of publishing this alert.
The USD Index declined yesterday, and it even moved to new weekly lows in terms of both intraday and closing price terms. Gold, silver and mining stocks responded with a rally. In particular, the latter ended the session higher despite the intraday pullback and the HUI Index moved back above its 61.8% Fibonacci retracement level, invalidating the previous breakdown. These signs, along with what we see on the gold charts in terms of the euro and the yen make it quite clear what’s likely to happen next.
The big decline is coming and the corrective upswing could already be over, or we could have 1-2 days of strength at most. And if that happens, it’s not likely that the PMs and miners will move significantly. The risk to reward ratio continues to favor big short positions at this time. Let’s take a look at the details (chart courtesy of http://stockcharts.com).
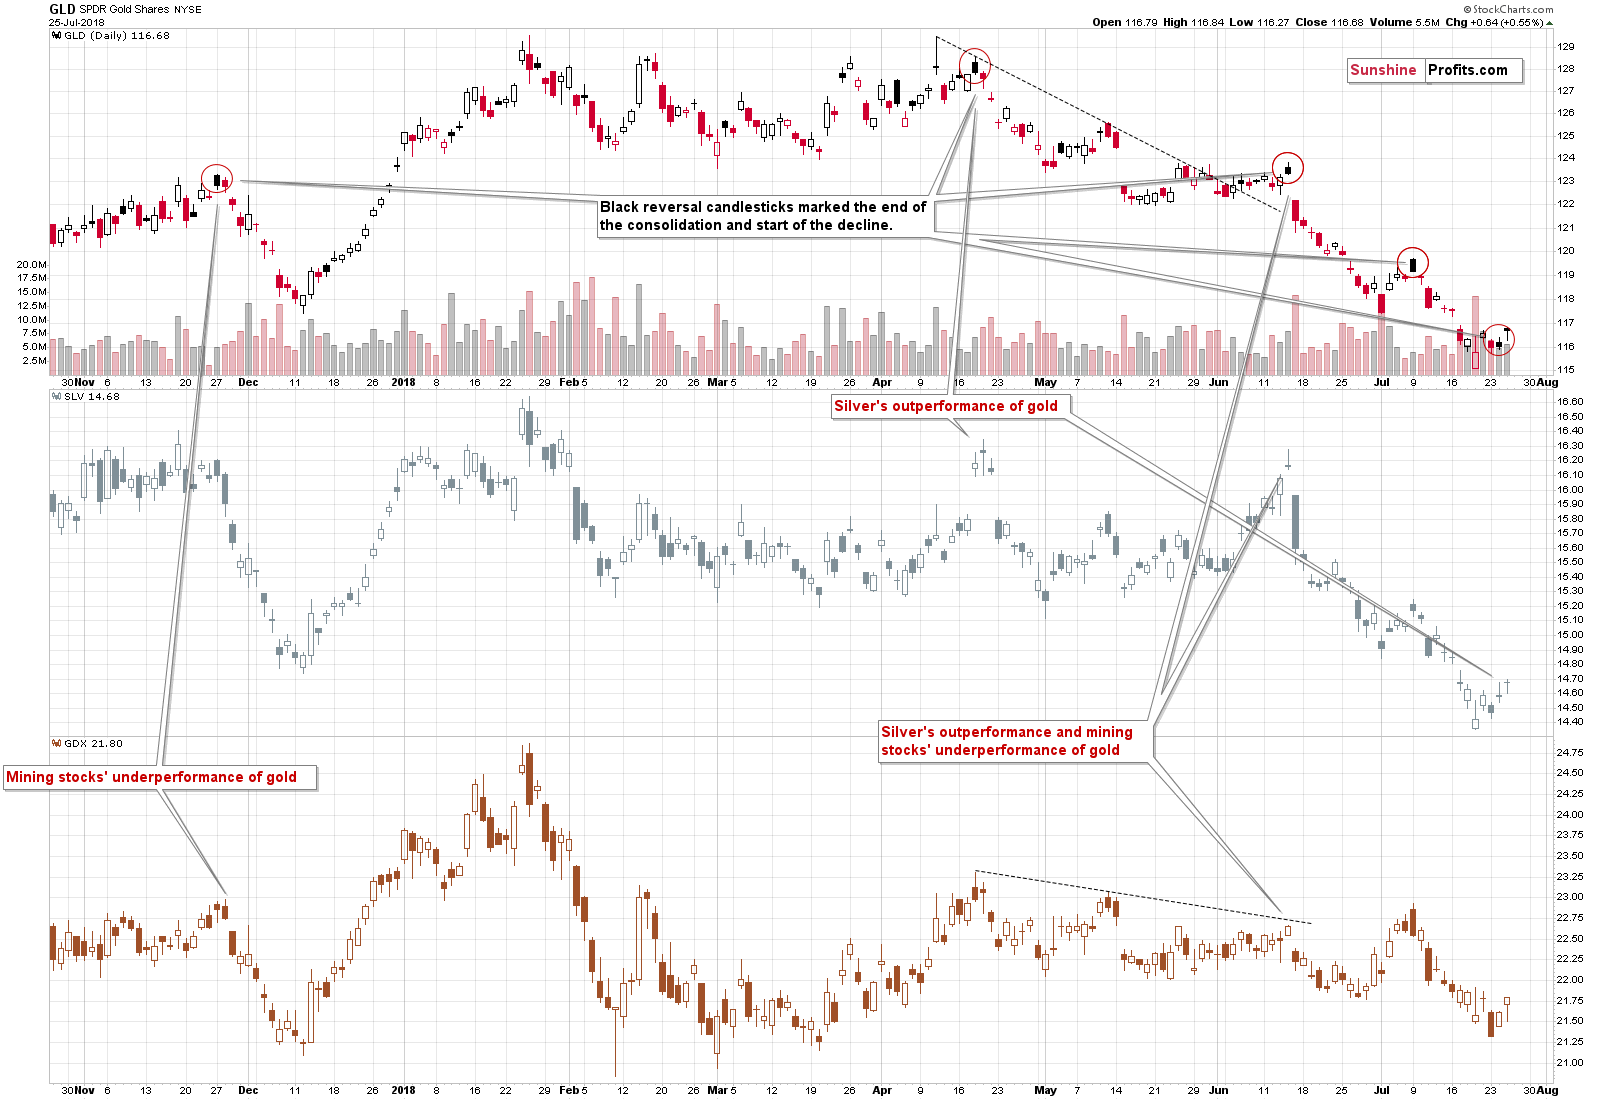
Gold’s Intraday Reversal and Silver’s Strength
In yesterday’s Alert, we wrote the following:
Silver (SLV) outperformed gold (GLD) once again by moving to a new very short-term high, while gold didn’t. There was no new intraday high in the GDX ETF so, silver’s outperformance is quite clear even though it happened on an intraday basis. This is something that indicated local tops several times in the past and it seems quite likely that this is the case right now as well.
The intraday reversal that’s marked with black candlestick in the case of the GLD ETF definitely confirms this scenario. These candlesticks were seen right before the short-term downswings in the recent and more distant past. The implications are definitely bearish.
On a side note, if you were wondering why they are black, not red – it’s how Stockcharts marks the days that are declines in intraday terms (i.e. the closing price is below the opening price), but at the same time are rallies in terms of closing prices (i.e. the daily closing price is above the previous day’s closing price). In other words, it’s a specific kind of a reversal.
During yesterday’s session, we saw more or less a repeat of what we had seen on Tuesday, so the above remains up-to-date. This time, GLD moved to a new short-term high along with SLV, but overall, taking this week into account, GLD is 0.10% higher, SLV is 0.62% higher and GDX is only 0.02% higher. Gold moved a bit higher, silver outperformed, while miners are lagging. That’s still a bearish combination.
Regarding Tuesday’s black candlestick – we saw it once again yesterday, so the bearish implications from this signal were simply repeated.
The implication of the overall relative performance of the precious metals sector remains bearish.
Gold Stocks’ Breakdown
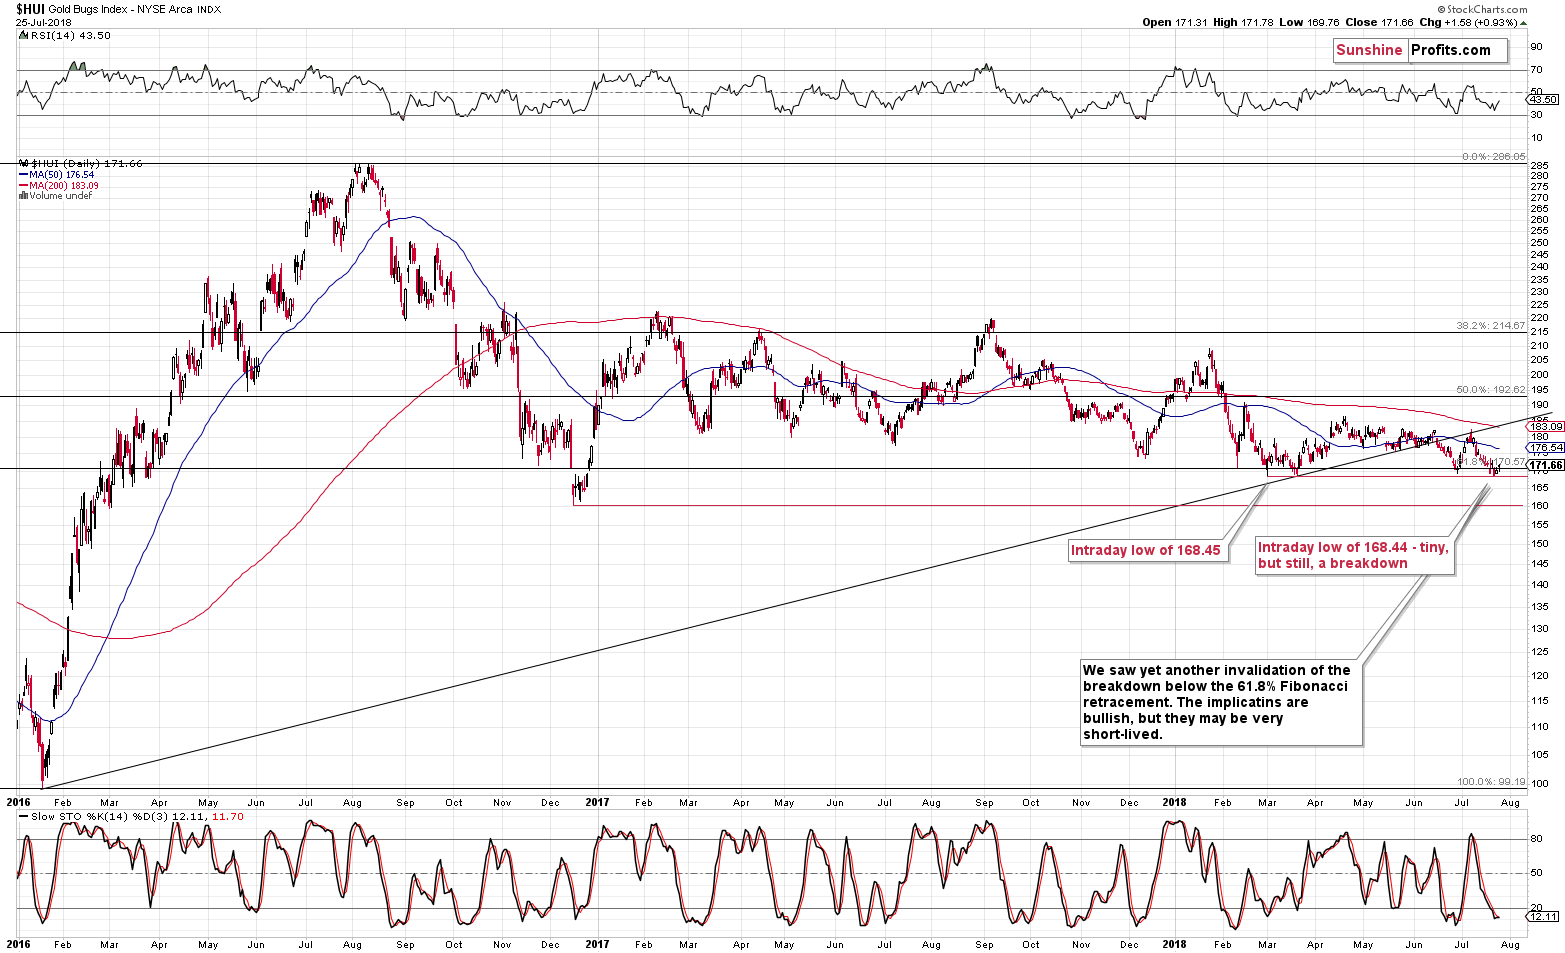
Gold stocks invalidated their breakdown below the 61.8% Fibonacci retracement level, which is a bullish sign. But, let’s keep in mind that the rallies that followed previous invalidations of breakdowns below this level were smaller in each case. Consequently, based on the above chart alone, we could see a rally, but even if we do, it’s not likely that this rally would be bigger than what we saw in early July. Moreover, since the mining stocks to gold ratio is unlikely to move much higher, the potential size of the rally is very limited. We may not even get a move above 175, and it could just as well be the case that gold miners decline right away. There are many other factors in play that favor lower prices, and the invalidation in the HUI alone may not be able to trigger an upswing in this environment.
The next important target is the December 2016 low of 160, but once this level is broken, the real fireworks are likely to start. Just as the HUI soared sharply in early 2016 without a bigger correction, it could dive without bigger corrections in the following months. But, for now, let’s focus on the nearest target – the 160 level.
The GDX ETF chart shows a good reason why one should be focusing on the downside, not upside targets here.
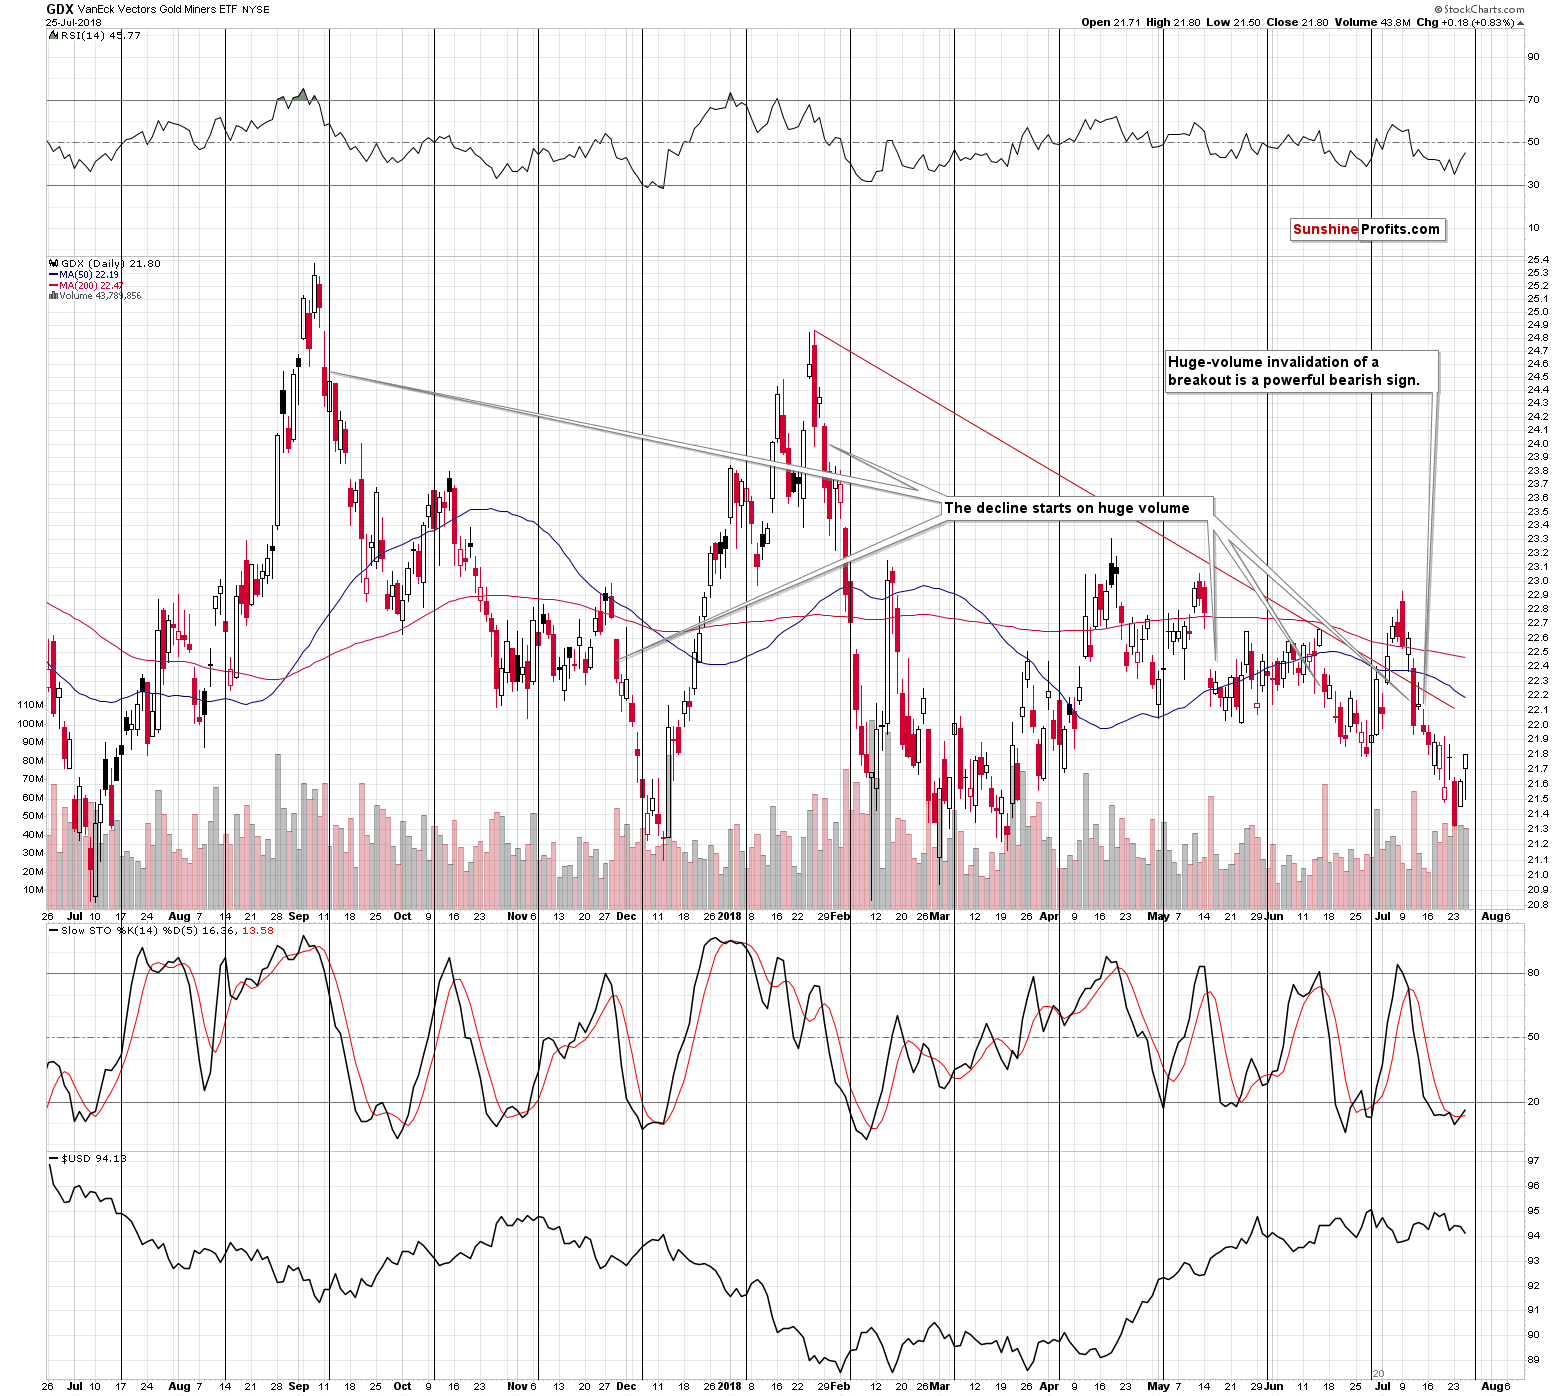
The cyclical turning point for mining stocks is almost here, which means that we can see a turnaround any day now. The most recent very short-term move was up, so the turning point is likely to mark a local top. In a way, the current upswing is bearish, because it makes the turning point have bearish implications. If we saw a decline this week, we would likely have an upswing next week, because of the turning point. But, things being what they are, the implications are bearish for the next week.
Having said that, let’s take a look at gold.
Gold’s Small Correction
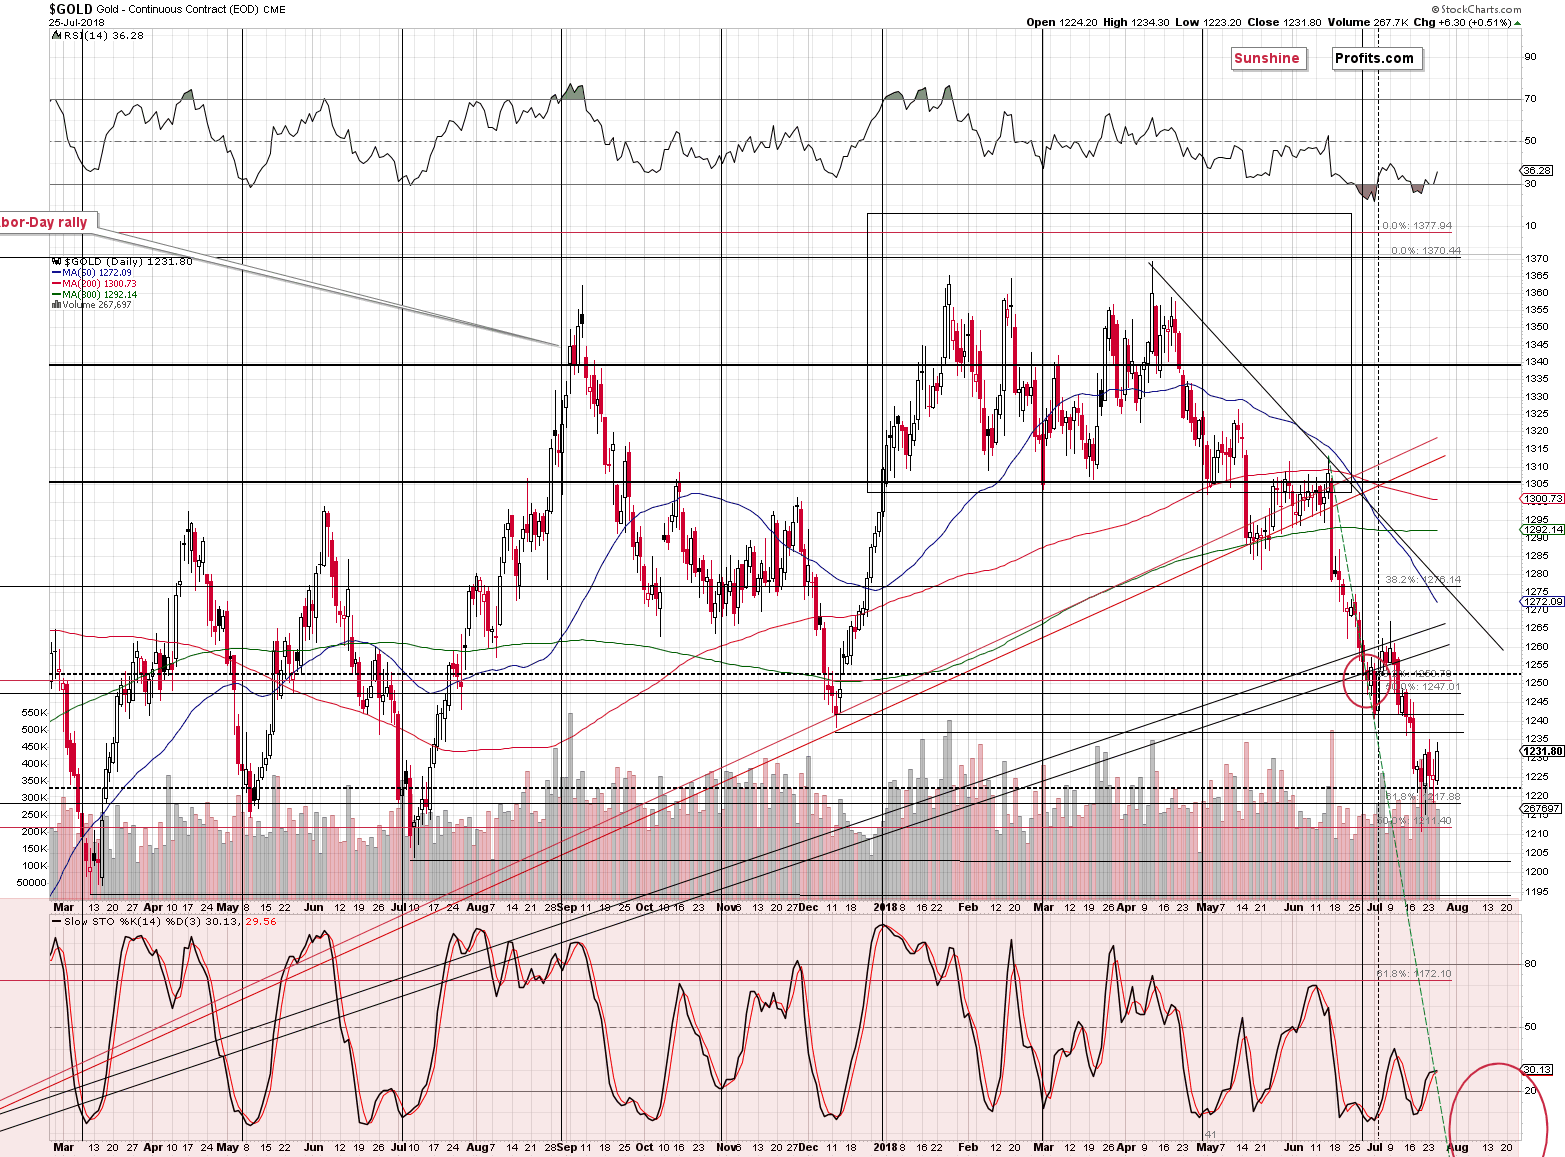
Gold moved higher once again, but the size of the rally was nothing to call home about. The volume was not particularly big either. In fact, it was low on a relative basis. There was no new intraday high, even though the USD Index did move to a new intraday low. It seems that what we’re seeing is a pause before the next slide, not the beginning of another big upswing.
The situation is much more interesting on the chart featuring the price of gold in terms of the euro.
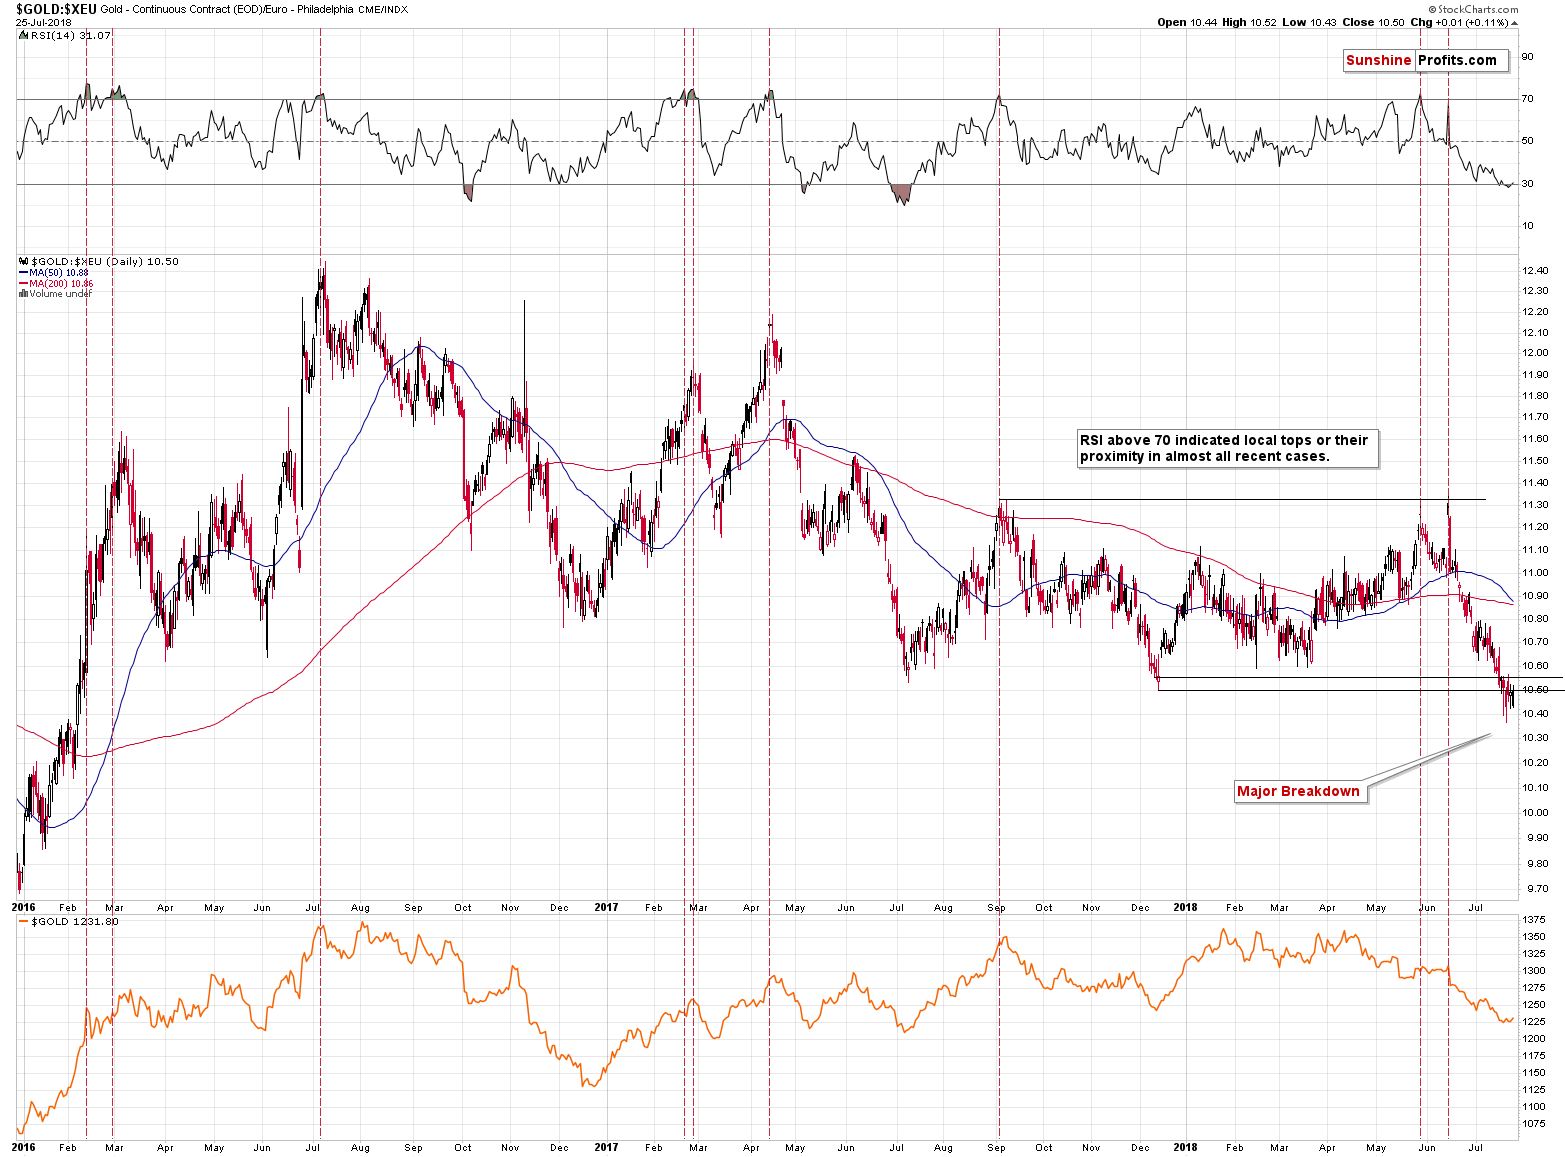
The yellow metal in terms of the European currency moved below the previous 2017 and 2018 lows and it’s consolidating. The two horizontal black lines on the above chart represent the lowest of the above – the December 2017 low in terms of both intraday lows and closing prices. The breakdown is already confirmed in terms of the closing prices and while it’s somewhat unclear if the one in intraday terms is already confirmed or not, it’s clear that it hasn’t been invalidated.
The implications are very bearish for the next several weeks as they mean that gold is very likely to decline in terms of the euro. Big declines in the euro are usually connected with big declines in other currencies, so the strong bearish implications extend also to the price of gold in our regular USD perspective.
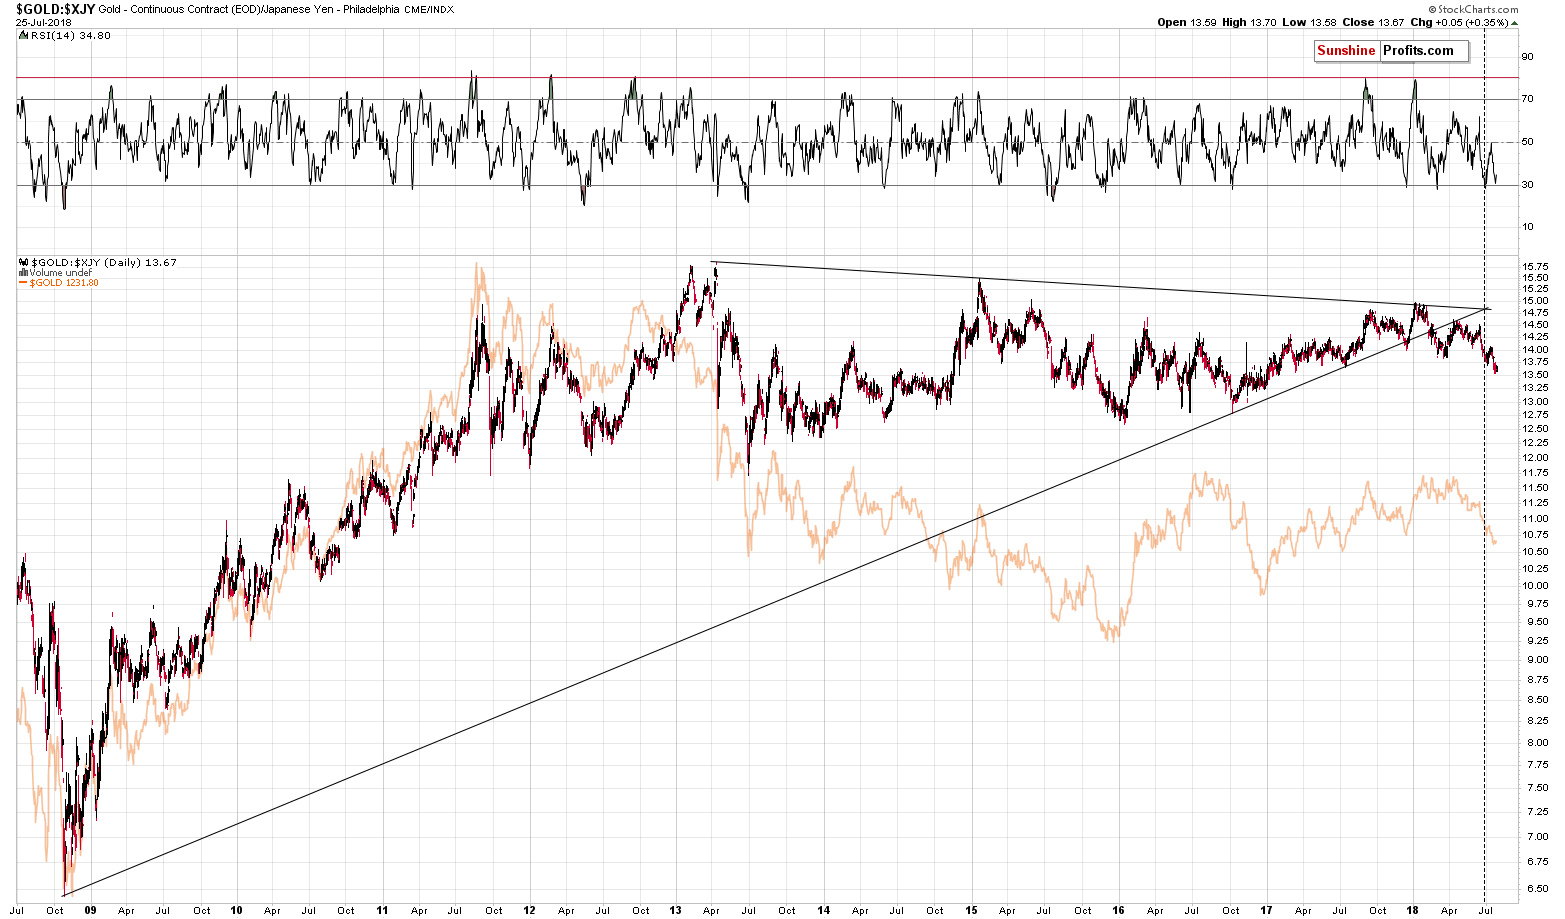
Looking at gold in terms of the Japanese yen, we see that it’s after a breakdown below the key long-term support line, after the verification of the breakdown and after yet another corrective upswing that was likely to be seen based on the apex of the triangle.
Since the correction has already taken place and gold moved below its starting point, the decline can and is likely to continue.
Silver Breakdowns
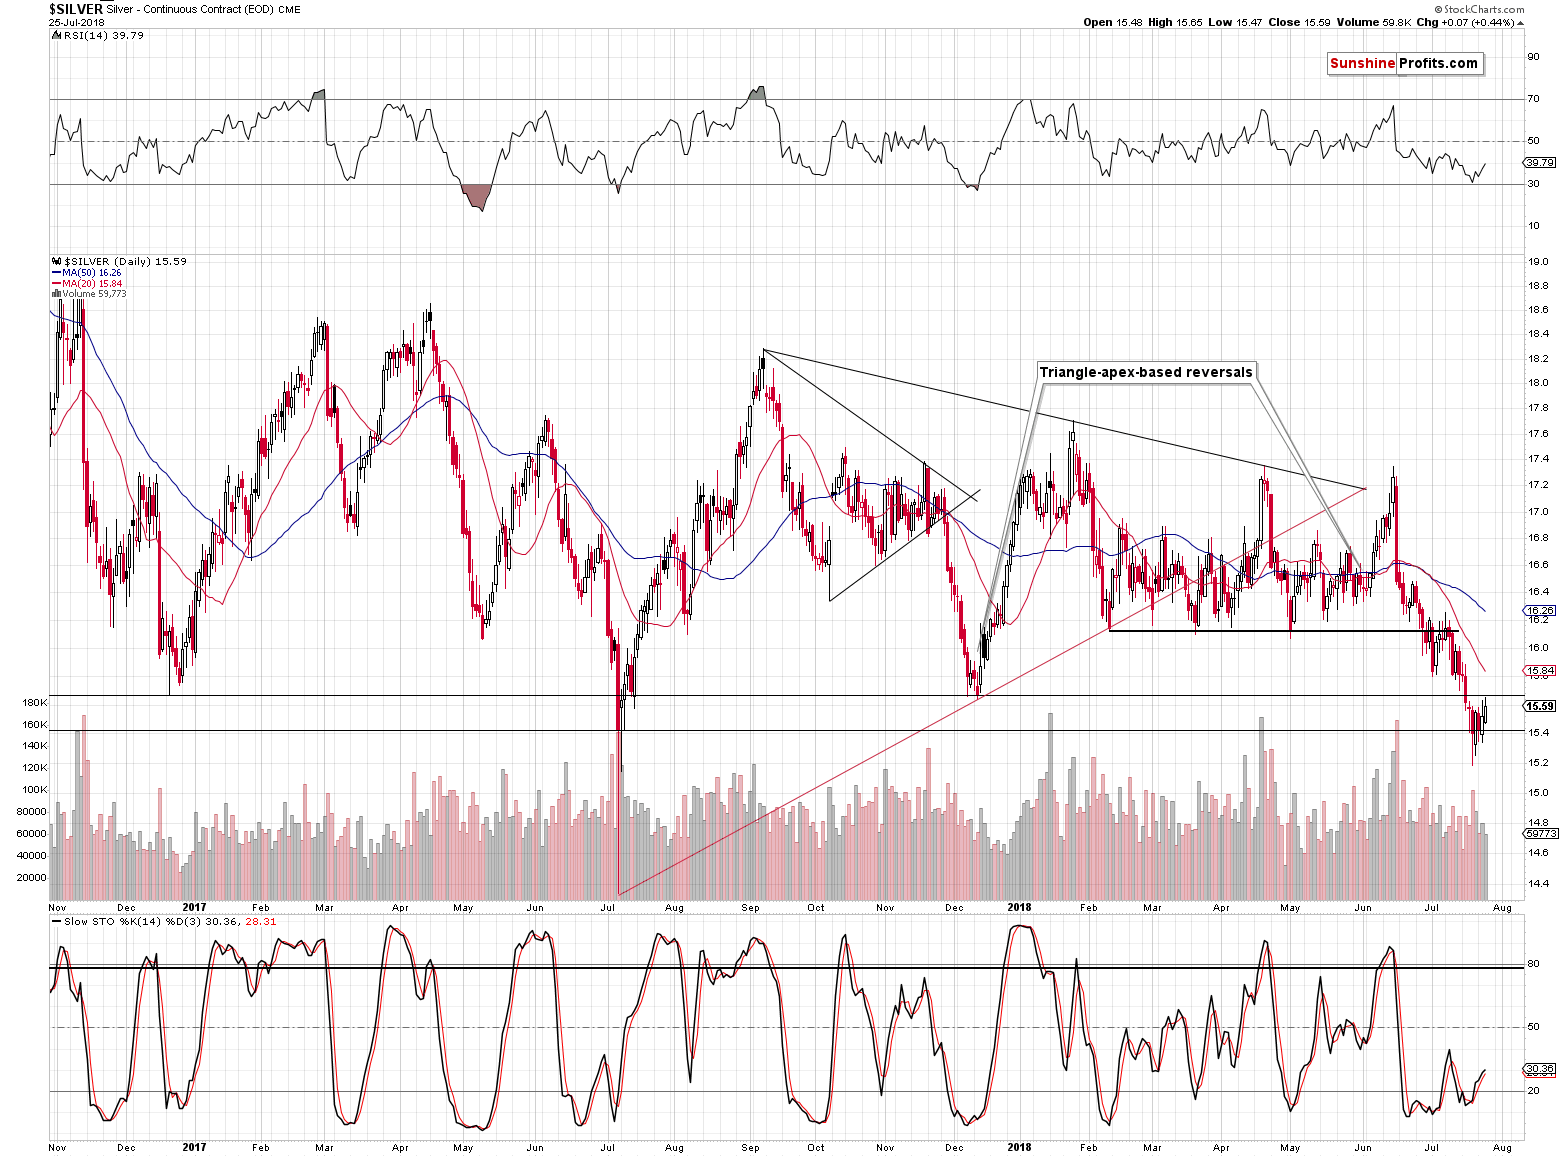
The white metal moved higher again and this move was accompanied by rather low volume. Once again silver didn’t manage to close back above the December 2016 and December 2017 lows, which means that the breakdowns were not invalidated, but confirmed. This seems more important than the invalidation of the breakdown below the July 2017 low. After all, two major bottoms are more important than one.
Therefore, the overall implications are bearish.
Forex Implications
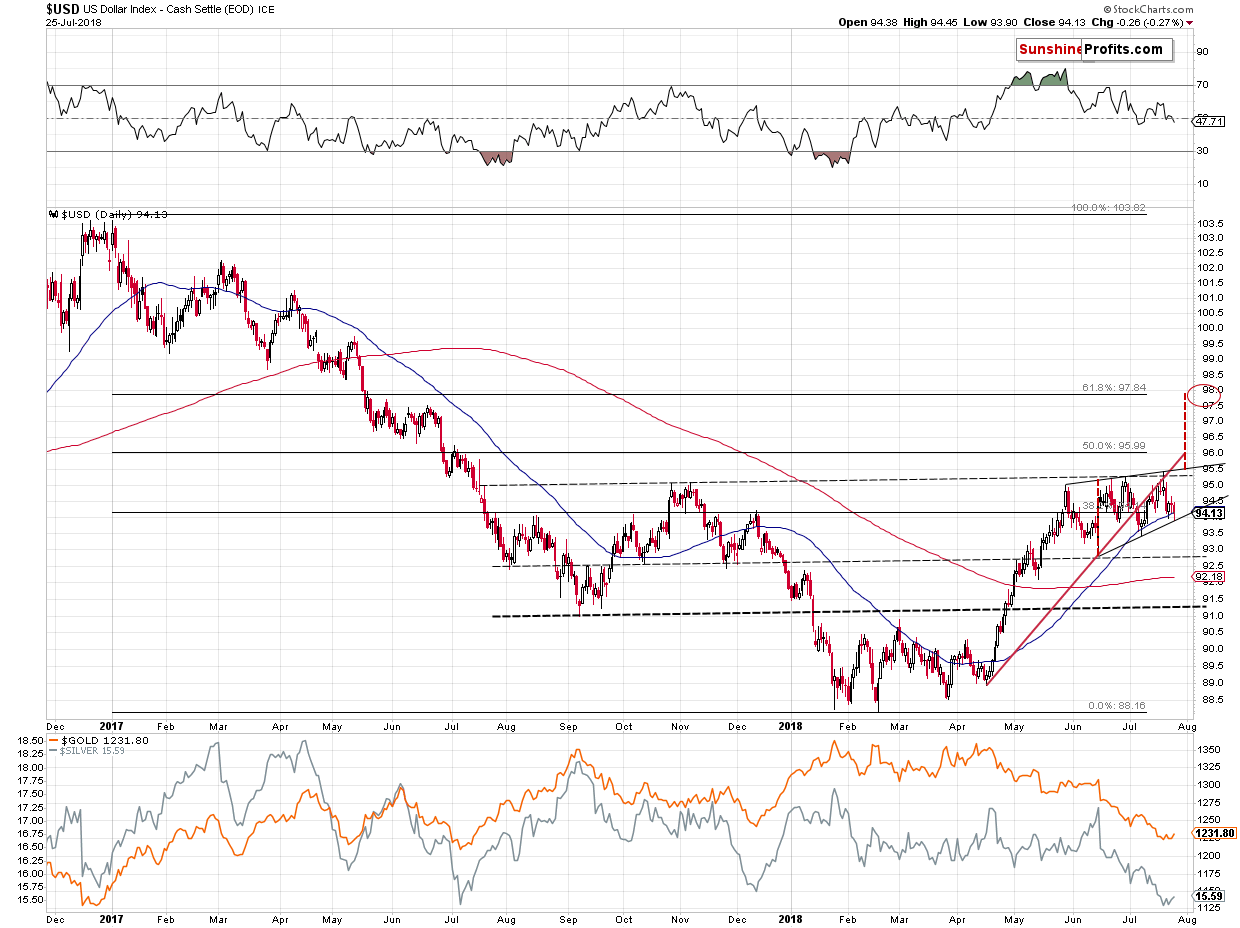
The situation in the USD Index is quite bullish as it reached its short-term support line. This line is the lower border of the rising wedge pattern. The implications of this pattern will depend on the way in which the USD Index breaks from it. If the breakout is to the upside, then we’ll likely see a rally. If it’s to the downside, it will likely herald a decline.
During yesterday’s session, the USD Index moved to the lower border of the wedge and bounced from it. Since the index value is closer to the lower border, it may seem more likely that a breakdown will be seen. But that is not the case. A breakout is much more in tune with the long-term USD picture, so it’s quite likely that we saw a bottom yesterday. This means that even though the HUI Index invalidated its breakdown, there may be no rally in it at all.
Moreover, the breakout from the rising wedge pattern would likely be followed by a rally as big as the height of the wedge. We marked it with red dashed lines. Interestingly, this technique provides us with a target of approximately 98, which we’ve been featuring for many weeks. This level is (approximately) the 61.8% Fibonacci retracement level that’s based on the entire 2017 – 2018 decline.
In the last two months, gold managed to decline over $70 without the USD’s help and it still seems that gold is magnifying the USD’s rallies while somewhat ignoring its weakness. In such an environment we can say that gold is on bearish fire and a rallying USD would be like gasoline.
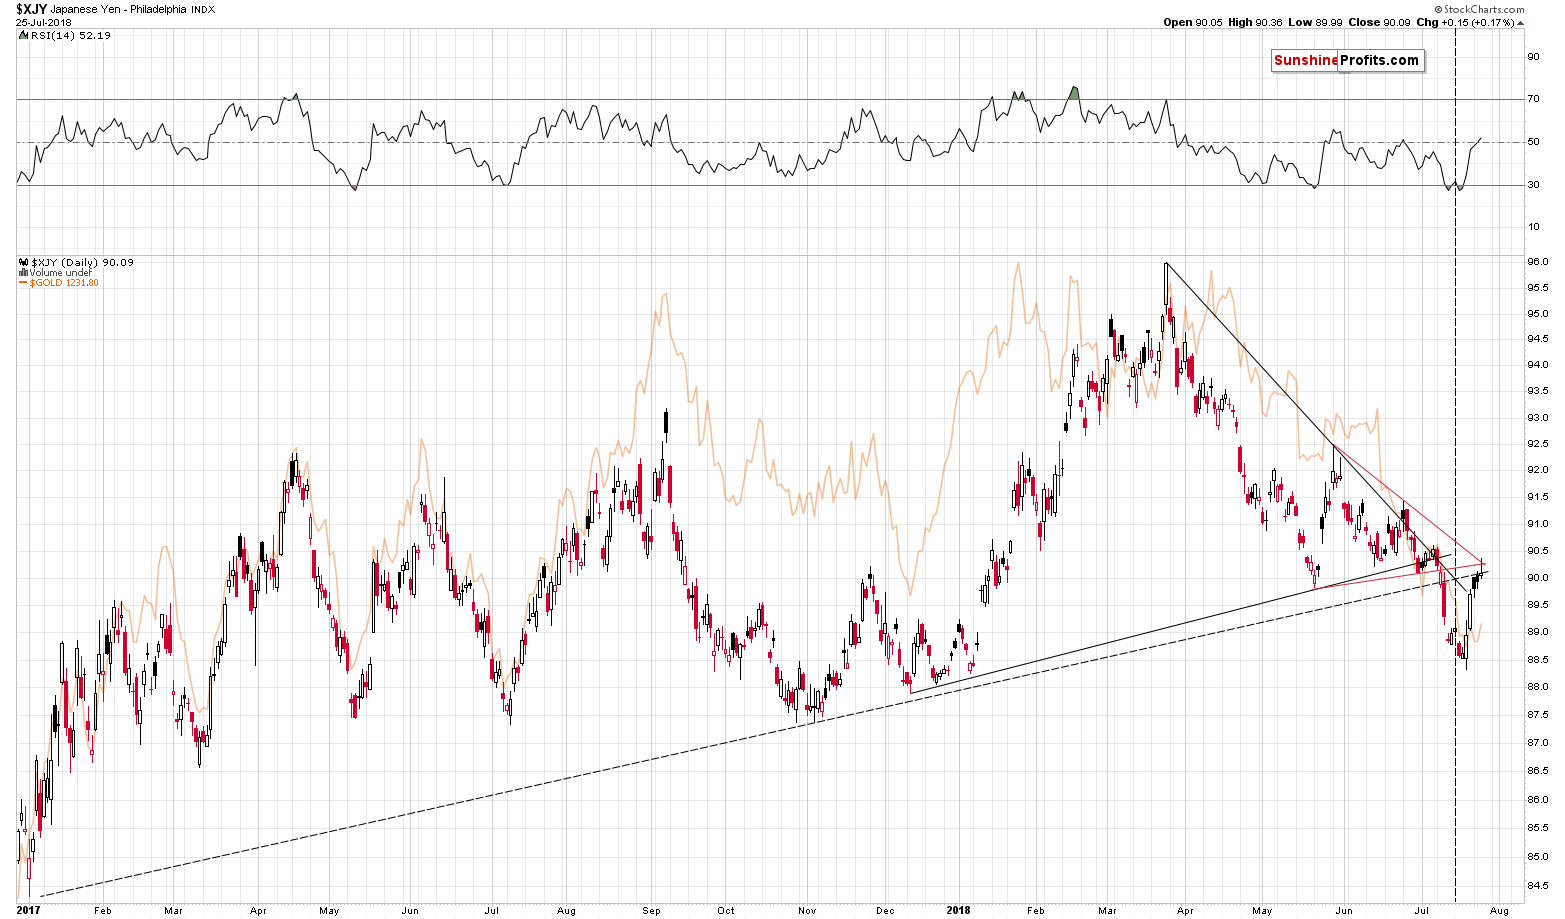
The Japanese yen moved a bit higher in the past few days, so you may be wondering if the outlook for it changed. In short, it didn’t. The yen seems to have moved back to its rising dashed medium-term resistance line and formed a bullish reversal candlestick. That’s a bearish combination and that’s not even the most bearish detail. The key thing is that it happened at the apex of the red triangle, which makes it very likely that yesterday’s session was a reversal.
The implications for the Japanese yen are bearish, they are bullish for the USD Index, and bearish for the precious metals sector.
Summary
Summing up, even though the HUI Index invalidated its previous breakdown, the follow-up rally could be already over. The currency sector supports lower precious metals values and the same goes for multiple other factors.
There are some signs that the corrective upswing is already over, but even if it isn’t, gold’s upside target is still at about $1,240, which means that the potential upside is not worth risking missing out on the following big slide.
The extra-large short positions in gold, silver, and mining stocks are definitely justified from the risk to reward point of view. It’s likely that the profits on the short position that we opened only several days ago will increase much more before this trade is over, even if they correct temporarily first.
As always, we will keep you – our subscribers – informed.
To summarize:
Trading capital (supplementary part of the portfolio; our opinion): Full short positions (200% of the full position) in gold, silver and mining stocks are justified from the risk/reward perspective with the following stop-loss orders and initial target price levels:
- Gold: initial target price: $1,142; stop-loss: $1,272; initial target price for the DGLD ETN: $63.96; stop-loss for the DGLD ETN $46.38
- Silver: initial target price: $14.42; stop-loss: $16.46; initial target price for the DSLV ETN: $32.97; stop-loss for the DSLV ETN $24.07
- Mining stocks (price levels for the GDX ETF): initial target price: $19.12; stop-loss: $23.64; initial target price for the DUST ETF: $37.97; stop-loss for the DUST ETF $20.87
In case one wants to bet on junior mining stocks’ prices (we do not suggest doing so – we think senior mining stocks are more predictable in the case of short-term trades – if one wants to do it anyway, we provide the details), here are the stop-loss details and initial target prices:
- GDXJ ETF: initial target price: $28.10; stop-loss: $34.82
- JDST ETF: initial target price: $74.83 stop-loss: $42.78
Long-term capital (core part of the portfolio; our opinion): No positions (in other words: cash)
Insurance capital (core part of the portfolio; our opinion): Full position
Important Details for New Subscribers
Whether you already subscribed or not, we encourage you to find out how to make the most of our alerts and read our replies to the most common alert-and-gold-trading-related-questions.
Please note that the in the trading section we describe the situation for the day that the alert is posted. In other words, it we are writing about a speculative position, it means that it is up-to-date on the day it was posted. We are also featuring the initial target prices, so that you can decide whether keeping a position on a given day is something that is in tune with your approach (some moves are too small for medium-term traders and some might appear too big for day-traders).
Plus, you might want to read why our stop-loss orders are usually relatively far from the current price.
Please note that a full position doesn’t mean using all of the capital for a given trade. You will find details on our thoughts on gold portfolio structuring in the Key Insights section on our website.
As a reminder – “initial target price” means exactly that – an “initial” one, it’s not a price level at which we suggest closing positions. If this becomes the case (like it did in the previous trade) we will refer to these levels as levels of exit orders (exactly as we’ve done previously). Stop-loss levels, however, are naturally not “initial”, but something that, in our opinion, might be entered as an order.
Since it is impossible to synchronize target prices and stop-loss levels for all the ETFs and ETNs with the main markets that we provide these levels for (gold, silver and mining stocks – the GDX ETF), the stop-loss levels and target prices for other ETNs and ETF (among other: UGLD, DGLD, USLV, DSLV, NUGT, DUST, JNUG, JDST) are provided as supplementary, and not as “final”. This means that if a stop-loss or a target level is reached for any of the “additional instruments” (DGLD for instance), but not for the “main instrument” (gold in this case), we will view positions in both gold and DGLD as still open and the stop-loss for DGLD would have to be moved lower. On the other hand, if gold moves to a stop-loss level but DGLD doesn’t, then we will view both positions (in gold and DGLD) as closed. In other words, since it’s not possible to be 100% certain that each related instrument moves to a given level when the underlying instrument does, we can’t provide levels that would be binding. The levels that we do provide are our best estimate of the levels that will correspond to the levels in the underlying assets, but it will be the underlying assets that one will need to focus on regarding the signs pointing to closing a given position or keeping it open. We might adjust the levels in the “additional instruments” without adjusting the levels in the “main instruments”, which will simply mean that we have improved our estimation of these levels, not that we changed our outlook on the markets. We are already working on a tool that would update these levels on a daily basis for the most popular ETFs, ETNs and individual mining stocks.
Our preferred ways to invest in and to trade gold along with the reasoning can be found in the how to buy gold section. Additionally, our preferred ETFs and ETNs can be found in our Gold & Silver ETF Ranking.
As a reminder, Gold & Silver Trading Alerts are posted before or on each trading day (we usually post them before the opening bell, but we don't promise doing that each day). If there's anything urgent, we will send you an additional small alert before posting the main one.
=====
Latest Free Trading Alerts:
What comes to your mind when you hear about Auburn, Alabama? I guess nothing. But this is a mistake. There is a real treasure hidden there. Am I talking about gold?
=====
Hand-picked precious-metals-related links:
PRECIOUS-Gold prices edge lower as U.S- EU trade concerns abate
Barrick Gold reports Q2 loss of US$94 million
Goldcorp reports net loss of $131 million in Q2
South Korean firm backtracks on $130 billion 'treasure ship' gold claims
UK's largest gold nugget found by man who lay in Scottish river for hours
=====
In other news:
World stocks hit four-month high on EU-U.S. trade breakthrough hopes
ECB keeps policy unchanged, sees QE ending this year
Trump and EU officials agree to work toward 'zero tariff' deal
The U.S. Housing Market Looks Headed for Its Worst Slowdown in Years
Emerging Markets May Have Bottomed, Goldman Sachs Says
=====
Thank you.
Sincerely,
Przemyslaw Radomski, CFA
Founder, Editor-in-chief, Gold & Silver Fund Manager
Gold & Silver Trading Alerts
Forex Trading Alerts
Oil Investment Updates
Oil Trading Alerts

