

Briefly: in our opinion, full (300% of the regular position size) speculative short positions in mining stocks are justified from the risk/reward point of view at the moment of publishing this Alert.
During yesterday’s session, gold and gold stocks declined, while silver remained relatively flat, and the USD Index moved to new 2020 lows. That’s not normal. The PMs “should have” rallied since their “main adversary,” the USD Index, moved to new lows. Especially considering that PMs tend to react more profoundly to the USD’s breakouts and breakdowns than to other types of moves.
This is not normal – this is simply bearish, and a clear sign that the precious metals sector is not ready to move higher at this time. It’s the middle of December and I previously wrote that gold might be bottoming at this time, however, based on this clear (and quite extreme) weakness it doesn’t seem anything like that is likely to be taking place. Instead, this all looks like a big prelude to another substantial wave down.
Gold rallied in today’s (Dec. 15) pre-market trading – did it invalidate the above, or at least yesterday’s indications?
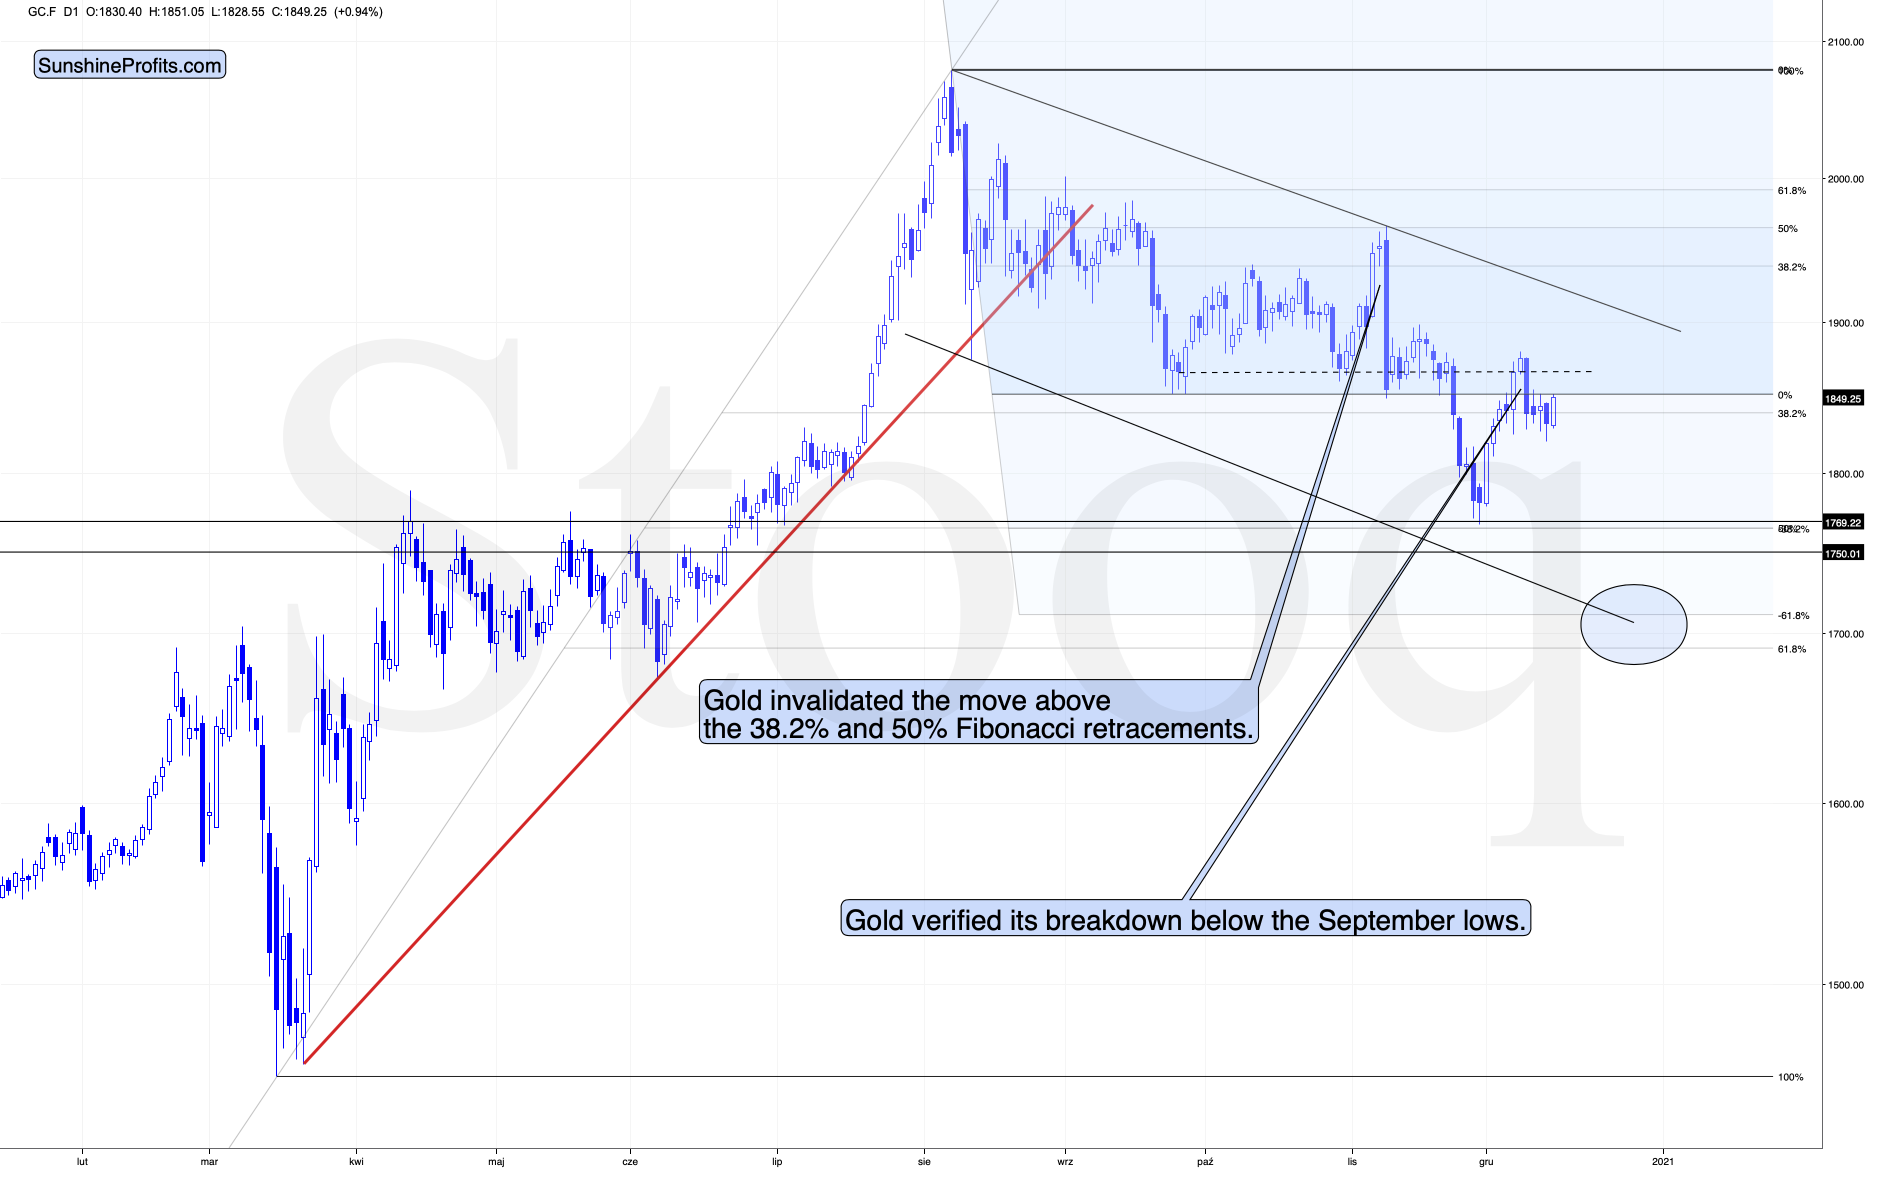
Looking at gold on its own doesn’t indicate any major changes. Gold continues to move back and forth after the first big daily decline, which happened once gold verified its breakdown below its September lows. This is a relatively normal course of action – nothing to call home about. Getting bullish based on today’s pre-market rally doesn’t seem justified and rather risky.
But things get much more interesting when we compare this action with the USDX movement.
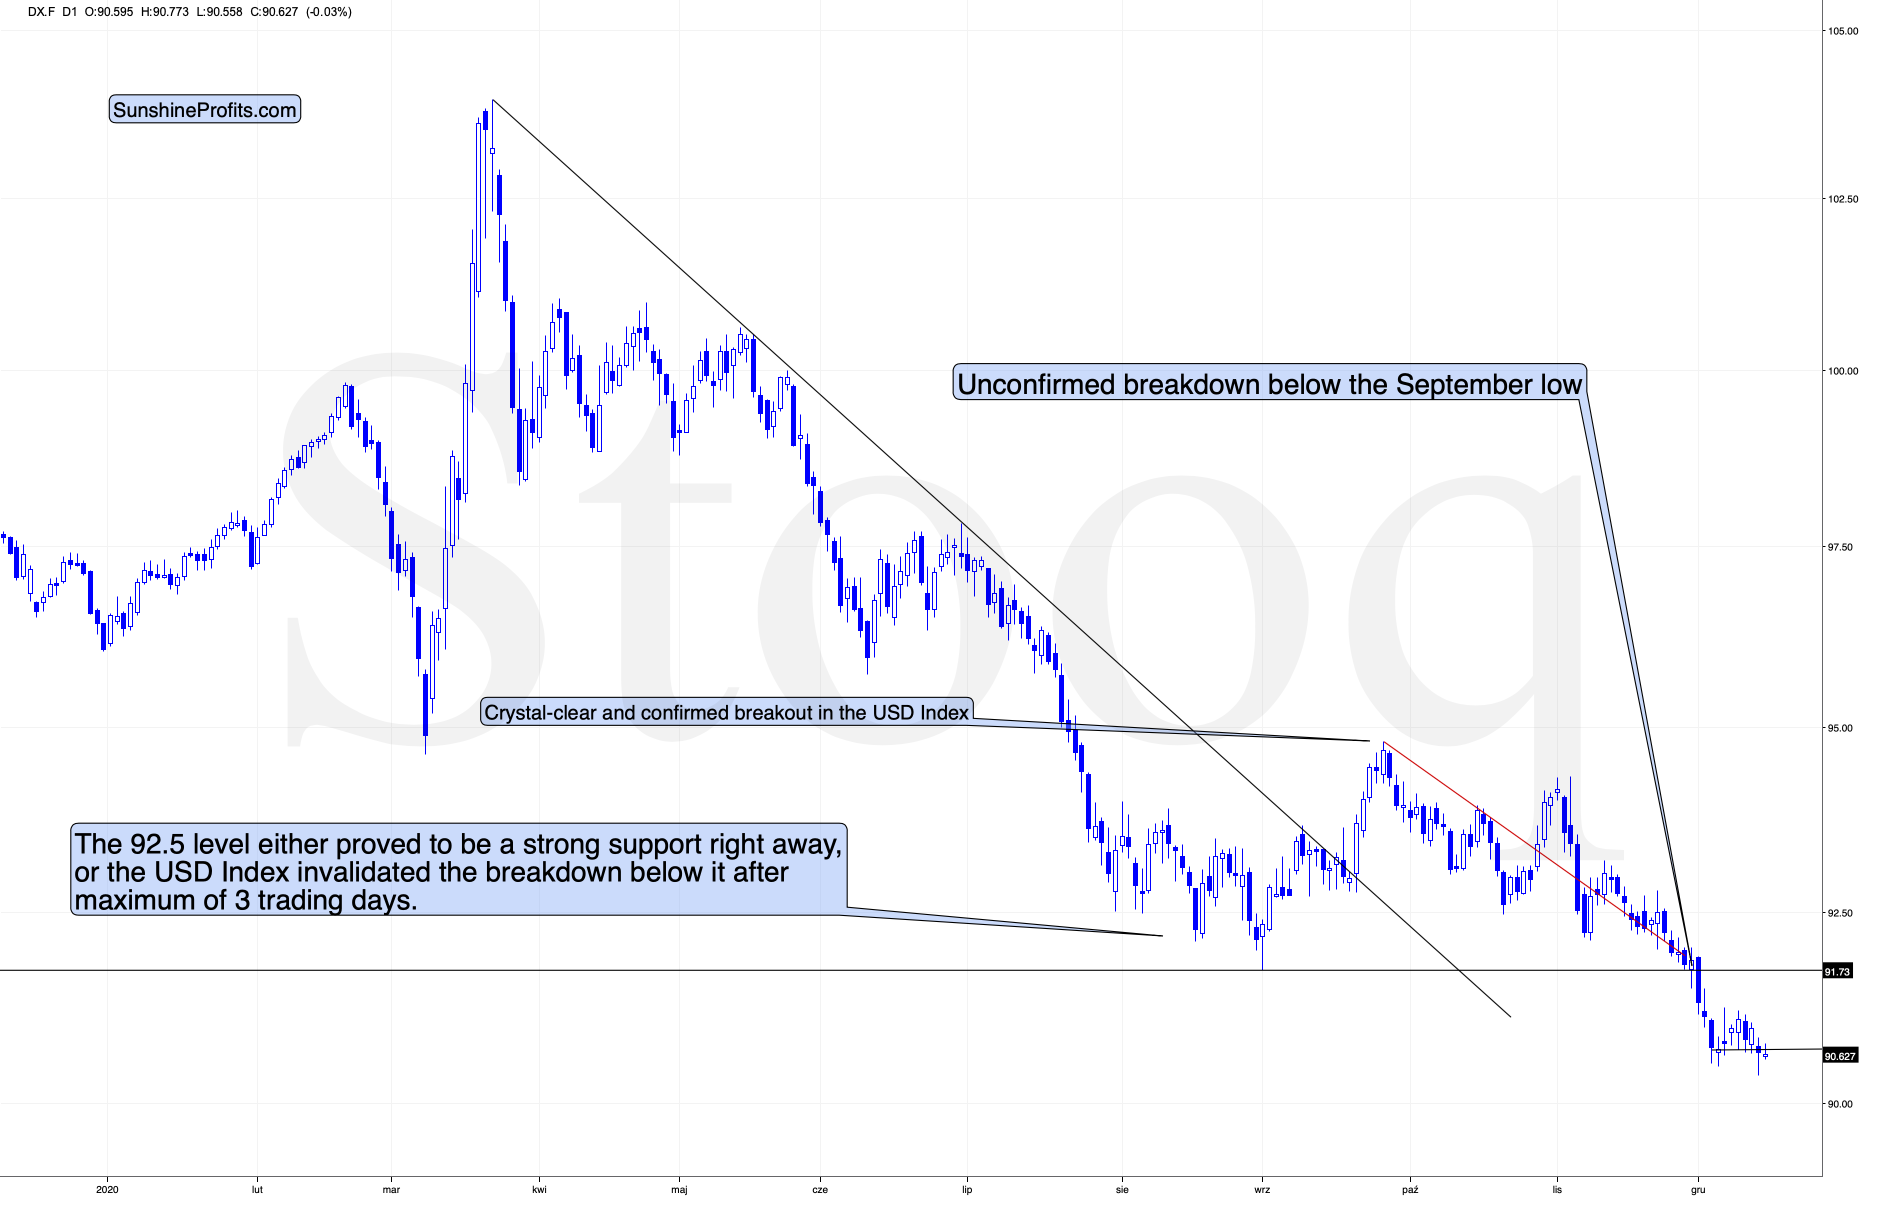
What the USD Index is doing right now – at the moment of writing these words – is verifying the breakdown below the previous 2020 lows in terms of the daily closing prices.
This makes further declines more likely, but at the same time it shows that gold’s rally is not as strong as should be if this was a new medium-term uptrend in it. The USD Index just broke below new yearly lows and new monthly lows. Gold is very far from its yearly highs and it didn’t even manage to move back to its monthly highs. Instead, it corrected about half of the preceding December decline.
This means that practically everything I wrote about gold’s connection with the USD Index as well as the outlook and price target for the latter remains up-to-date:
The USD Index broke below its previous 2020 lows and this breakdown was confirmed. However, since the recent low was 90.47, it seems that the target for the bottom – the 90 level – is at hand. Therefore, the implications for gold as not as bullish as they might seem at the first sight.
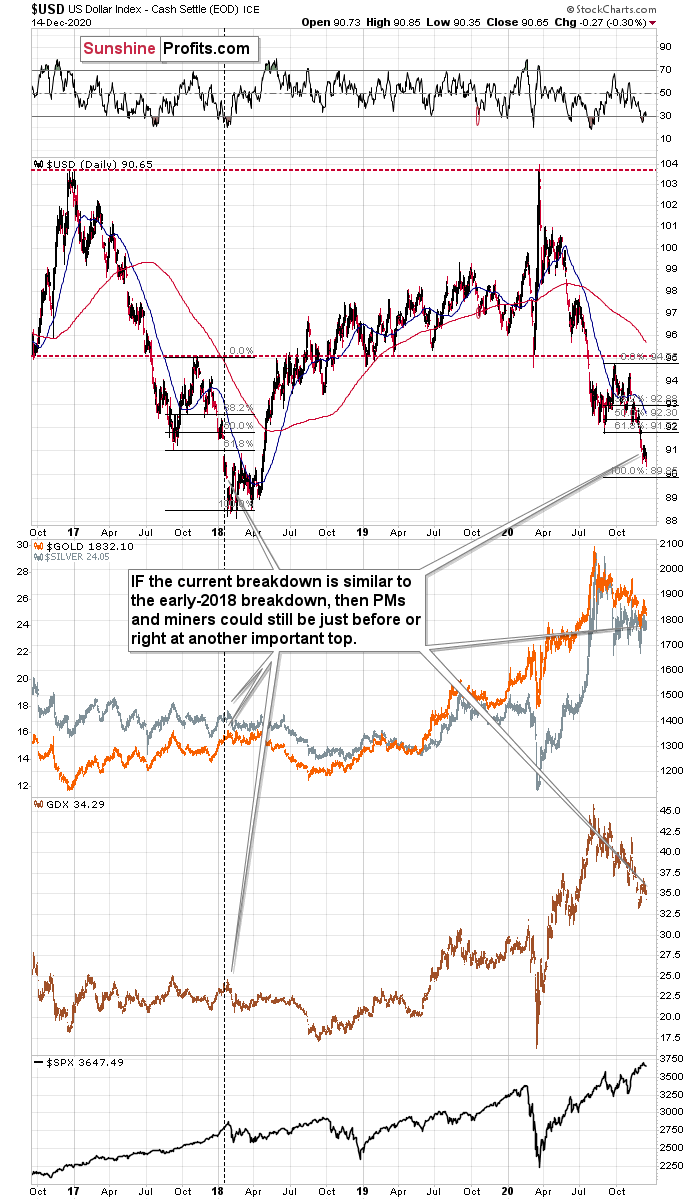
Why would the bottom in the USD Index form at about 90? Because this would be yet another way in which the history could rhyme. In case of the USD Index, we have more of a 1:1 repeat of what we already saw a few years earlier.
Namely, it appears that the USD Index is repeating its 2017 – 2018 decline to some extent. The starting points of the declines (horizontal red line) as well as the final high of the biggest correction are quite similar. The difference is that the recent correction was smaller than it was in 2017.
Since back in 2018, the USDX’s bottom was at about 1.618 Fibonacci extension of the size of the correction, we could expect something similar to happen this time. Applying the above to the current situation would give us the proximity of the 90 level as the downside target.
“So, shouldn’t gold soar in this case?” – would be a valid question to ask.
Well, if the early 2018 pattern was being repeated, then let’s check what happened to precious metals and gold stocks at that time.
In short, they moved just a little higher after the USDX’s breakdown. I marked the moment when the U.S. currency broke below its previous (2017) bottom with a vertical line, so that you can easily see what gold, silver, and GDX (proxy for mining stocks) were doing at that time. They were just before a major top. The bearish action that followed in the short term was particularly visible in the case of the miners.
Consequently, even if the USD Index is to decline further from here, then the implications are not particularly bullish for the precious metals market.
Silver is up in today’s pre-market trading as well, but – just like gold – it’s not at or above its December highs – it corrected about half of the monthly decline. This confirms the theory that the precious metals market is not willing to rally from here, but rather is waiting for specific triggers / direct reasons to decline. As a reminder – triggers would speed things up but are not necessary for prices to move.
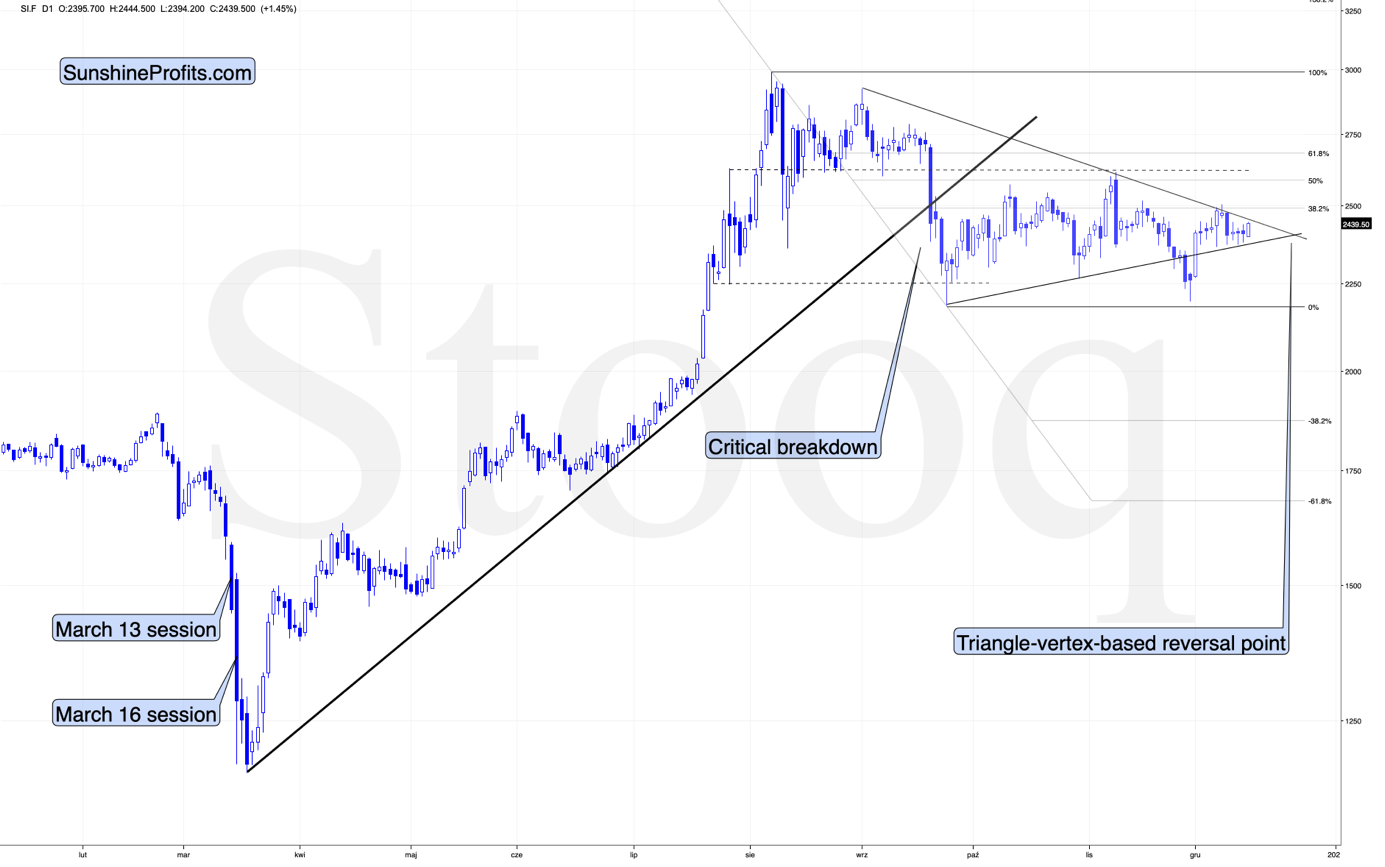
Since silver remains below its declining resistance line, the implications of the above chart remain as discussed previously:
While gold broke below its September low and now verified its breakout, silver just moved to its own September low and then bounced back. After moving higher, silver seems to have topped right at its 38.2% Fibonacci retracement based on the August – September decline and the declining resistance line.
What does this imply? Not much, actually – it means that the white metal is continuing to trade sideways after breaking below the rising, medium-term support line in mid-September.
Silver shrugged off the rally in the general stock market and the decline in the USD Index – it could have rallied on any of the above, and instead it just kept consolidating.
Consequently, silver seems to be preparing for a bigger mover lower.
It’s also important to note that silver is holding up much better than gold and – in particular – mining stocks. If this was the early stage of a rally, miners would have been strong, and silver would have been weak or average. What we see confirms the validity of the bearish case for the next few weeks or months.
As well, I would like to add that even if silver breaks above the declining resistance line, it might not mean much as silver is known for fake breakouts right before big declines.
Finally, let’s take a look at what happened in mining stocks yesterday.
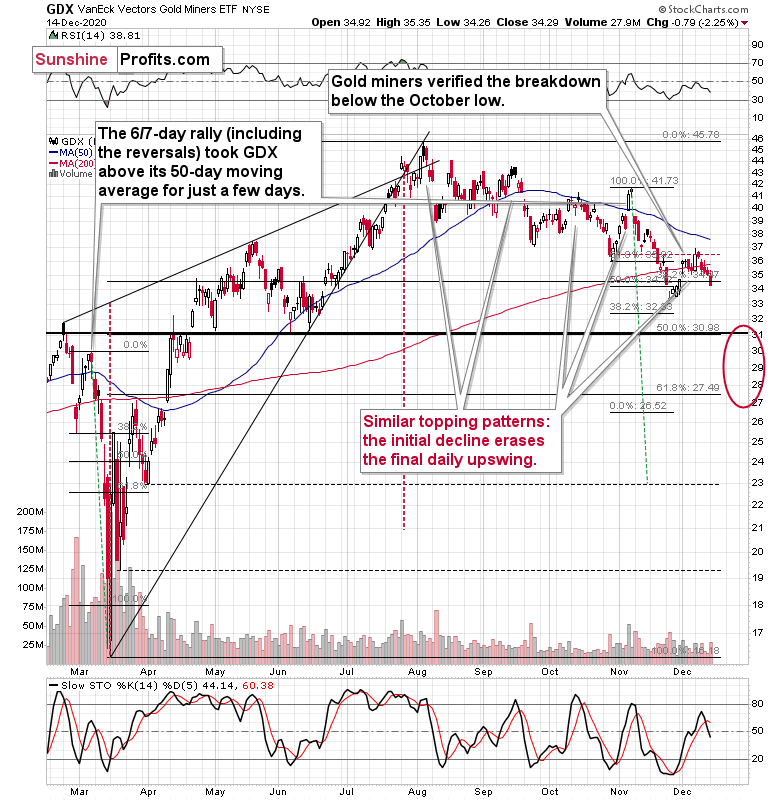
In short, they declined. The GDX declined to new monthly lows while GLD didn’t. This is yet another sign of weakness in the mining stock sector and a bearish confirmation.
The sell signal from the Stochastic indicator suggests that the rally is completely over. However, we wouldn’t rule out a situation in which miners move higher one more time before truly plunging – if gold rallies visibly based on USD’s decline.
Again, it’s a big “if”. Nothing like that has to happen – miners could decline right away with only a minor (or nonexistent), intraday correction.
Overview of the Upcoming Decline
As far as the current overview of the upcoming decline is concerned, I think it has already begun.
During the final part of the slide (which could end within the next 1-5 weeks or so), I expect silver to decline more than miners. That would align with how the markets initially reacted to the Covid-19 threat.
The impact of all the new rounds of money printing in the U.S. and Europe on the precious metals prices is incredibly positive in the long run, which does not make the short-term decline improbable. Markets can and will get ahead of themselves and decline afterward – sometimes very profoundly – before continuing with their upward climb.
The plan is to exit the current short positions in miners after they decline far and fast, but at the same time, silver drops just “significantly” (we expect this to happen in 0 – 3 weeks). In other words, the decline in silver should be severe, but the decline in the miners should look “ridiculous”. That’s what we did in March when we bought practically right at the bottom. It is a soft, but simultaneously broad instruction, so additional confirmations are necessary.
I expect this confirmation to come from gold, reaching about $1,700 - $1,750. If – at the same time – gold moves to about $1,700 - $1,750 and miners are already after a ridiculously big drop (say, to $31 - $32 in the GDX ETF – or lower), we will probably exit the short positions in the miners and at the same time enter short positions in silver. However, it could also be the case that we’ll wait for a rebound before re-entering short position in silver – it’s too early to say at this time. It’s also possible that we’ll enter very quick long positions between those short positions.
The precious metals market's final bottom is likely to take shape when gold shows significant strength relative to the USD Index. It could take the form of a gold’s rally or a bullish reversal, despite the ongoing USD Index rally.
Summary
Summing up, the next big move lower in the precious metals market is definitely underway and it seems that it will take another 1-5 weeks (likely in the second half of December) before the decline ends.
However, I would like to emphasize that the signals that we continue to see almost on a daily basis (gold’s relative weakness to the USD Index, miners’ weakness relative to gold) are more important than the above-described prediction with regard to timing of the bottom. Unless the precious metals sector manages to show relative strength, it’s not likely to form a major, let alone final bottom.
This corrective upswing might have already ended, but it’s possible that we will see one additional move higher – based on the USD’s decline – before the very short-term top is in.
Despite a recent decline, it seems that the USD Index is going to move higher in the following months and weeks, in turn causing gold to decline. At some point gold is likely to stop responding to dollar’s bearish indications, and based on the above analysis, it seems that we might expect this to take place in December.
Naturally, everyone's trading is their responsibility. But in our opinion, if there ever was a time to either enter a short position in the miners or increase its size if it was not already sizable, it's now. We made money on the March decline, and on the March rebound, with another massive slide already underway.
After the sell-off (that takes gold to about $1,700 or lower), we expect the precious metals to rally significantly. The final decline might take as little as 1-5 weeks, so it's important to stay alert to any changes.
Most importantly, please stay healthy and safe. We made a lot of money on the March decline and the subsequent rebound (its initial part) price moves (and we'll likely earn much more in the following weeks and months), but you have to be healthy to enjoy the results.
As always, we'll keep you - our subscribers - informed.
To summarize:
Trading capital (supplementary part of the portfolio; our opinion): Full speculative short positions (300% of the full position) in mining stocks is justified from the risk to reward point of view with the following binding exit profit-take price levels:
Senior mining stocks (price levels for the GDX ETF): binding profit-take exit price: $32.02; stop-loss: none (the volatility is too big to justify a SL order in case of this particular trade); binding profit-take level for the DUST ETF: $28.73; stop-loss for the DUST ETF: none (the volatility is too big to justify a SL order in case of this particular trade)
Junior mining stocks (price levels for the GDXJ ETF): binding profit-take exit price: $42.72; stop-loss: none (the volatility is too big to justify a SL order in case of this particular trade); binding profit-take level for the JDST ETF: $21.22; stop-loss for the JDST ETF: none (the volatility is too big to justify a SL order in case of this particular trade)
For-your-information targets (our opinion; we continue to think that mining stocks are the preferred way of taking advantage of the upcoming price move, but if for whatever reason one wants / has to use silver or gold for this trade, we are providing the details anyway. In our view, silver has greater potential than gold does):
Silver futures downside profit-take exit price: unclear at this time - initially, it might be a good idea to exit, when gold moves to $1,703.
Gold futures downside profit-take exit price: $1,703
Long-term capital (core part of the portfolio; our opinion): No positions (in other words: cash
Insurance capital (core part of the portfolio; our opinion): Full position
Whether you already subscribed or not, we encourage you to find out how to make the most of our alerts and read our replies to the most common alert-and-gold-trading-related-questions.
Please note that we describe the situation for the day that the alert is posted in the trading section. In other words, if we are writing about a speculative position, it means that it is up-to-date on the day it was posted. We are also featuring the initial target prices to decide whether keeping a position on a given day is in tune with your approach (some moves are too small for medium-term traders, and some might appear too big for day-traders).
Additionally, you might want to read why our stop-loss orders are usually relatively far from the current price.
Please note that a full position doesn't mean using all of the capital for a given trade. You will find details on our thoughts on gold portfolio structuring in the Key Insights section on our website.
As a reminder - "initial target price" means exactly that - an "initial" one. It's not a price level at which we suggest closing positions. If this becomes the case (like it did in the previous trade), we will refer to these levels as levels of exit orders (exactly as we've done previously). Stop-loss levels, however, are naturally not "initial", but something that, in our opinion, might be entered as an order.
Since it is impossible to synchronize target prices and stop-loss levels for all the ETFs and ETNs with the main markets that we provide these levels for (gold, silver and mining stocks - the GDX ETF), the stop-loss levels and target prices for other ETNs and ETF (among other: UGL, GLL, AGQ, ZSL, NUGT, DUST, JNUG, JDST) are provided as supplementary, and not as "final". This means that if a stop-loss or a target level is reached for any of the "additional instruments" (GLL for instance), but not for the "main instrument" (gold in this case), we will view positions in both gold and GLL as still open and the stop-loss for GLL would have to be moved lower. On the other hand, if gold moves to a stop-loss level but GLL doesn't, then we will view both positions (in gold and GLL) as closed. In other words, since it's not possible to be 100% certain that each related instrument moves to a given level when the underlying instrument does, we can't provide levels that would be binding. The levels that we do provide are our best estimate of the levels that will correspond to the levels in the underlying assets, but it will be the underlying assets that one will need to focus on regarding the signs pointing to closing a given position or keeping it open. We might adjust the levels in the "additional instruments" without adjusting the levels in the "main instruments", which will simply mean that we have improved our estimation of these levels, not that we changed our outlook on the markets. We are already working on a tool that would update these levels daily for the most popular ETFs, ETNs and individual mining stocks.
Our preferred ways to invest in and to trade gold along with the reasoning can be found in the how to buy gold section. Furthermore, our preferred ETFs and ETNs can be found in our Gold & Silver ETF Ranking.
As a reminder, Gold & Silver Trading Alerts are posted before or on each trading day (we usually post them before the opening bell, but we don't promise doing that each day). If there's anything urgent, we will send you an additional small alert before posting the main one.
Thank you.
Przemyslaw Radomski, CFA
Founder, Editor-in-chief

